U.S. March Personal Income, Spending and Core PCE Prices confirm Q1 totals, March Pending Home Sales rebound
March’s personal income and spending report is largely old news with Q1 totals visible in the GDP report. Despite the upside surprise in the Q1 core PCE price index, March’s data was even softer than expected at unchanged, with the upside surprise in Q1 coming from an upward revision to February. March pending home sales showed surprising strength with a rise of 6.1%.
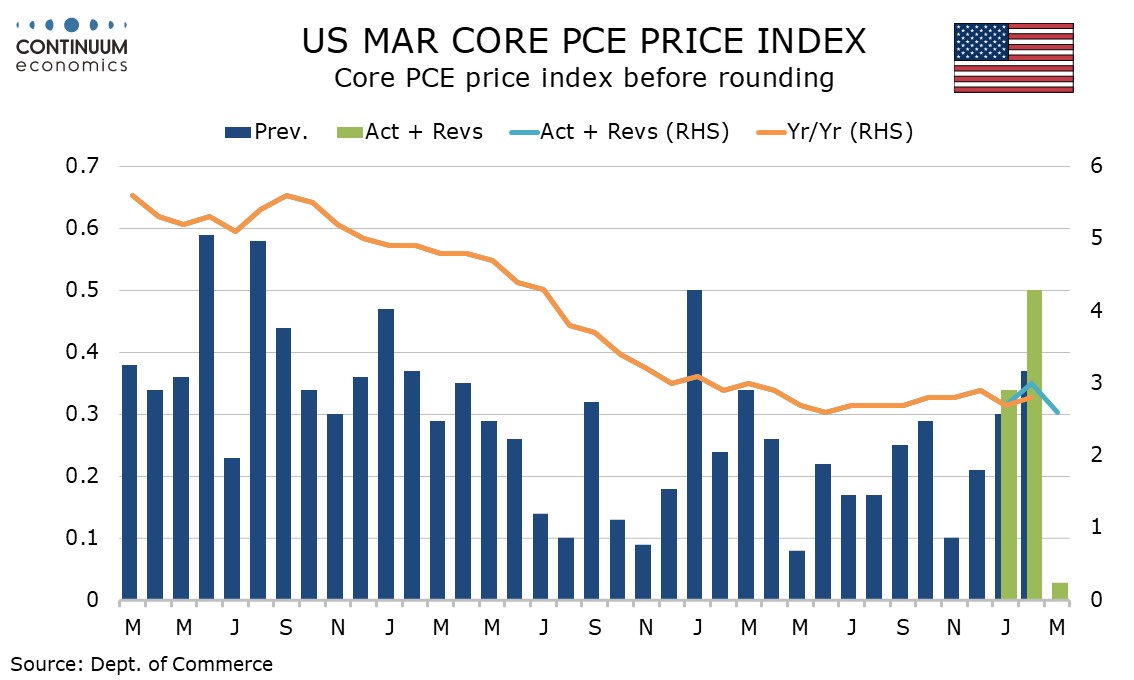
February core PCE prices were revised up to a 0.5% rise from 0.4%, while January was unrevised at 0.3%. Overall PCE prices were also unchanged, with February revised up to 0.4% from 0.3%. Yr/yr data saw core PCE prices as expected at 2.6% with February revised to 3.0% from 2.8%. Overall PCE prices were slightly stronger than expected at 2.3% yr/yr, with February revised up to 2.7% from 2.5%.
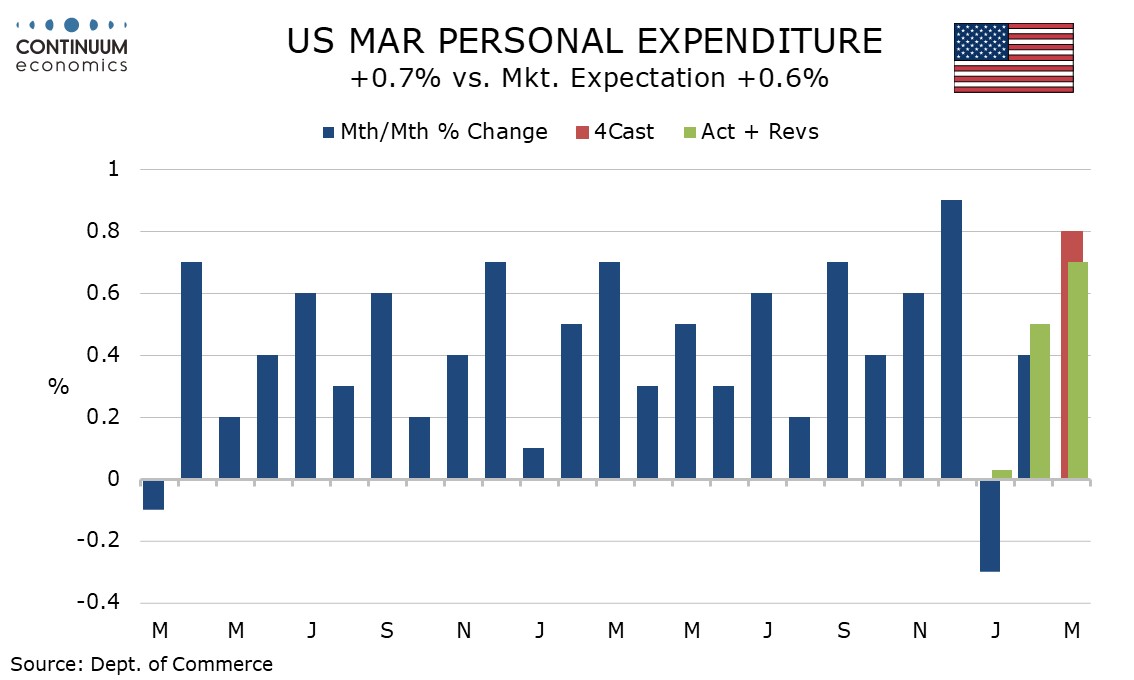
Personal income with a 0.5% March increase and personal spending at 0.7% were both stronger than expected. Personal income back revisions were negative but those for spending were positive, particularly for January, now unchanged rather than down by 0.3%, helping explain the upside surprise in Q1 consumer spending.
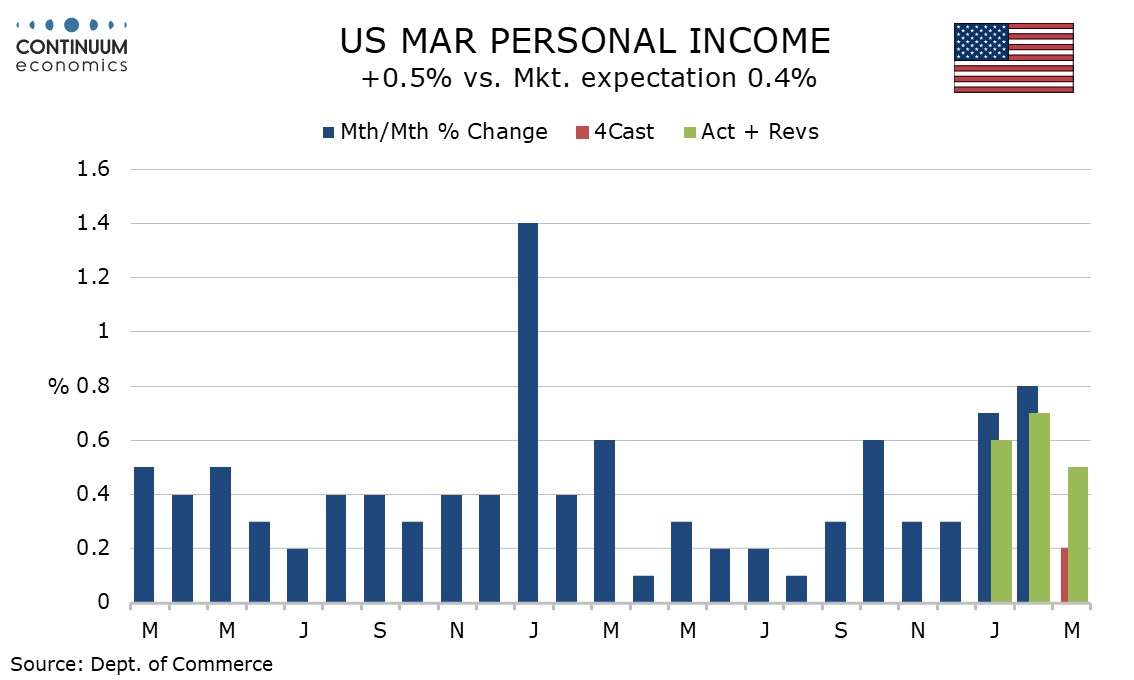
Personal income detail shows wages and salaries up by 0.5%, matching overall personal income after unusually underperforming in January and February when government benefits were strong. March personal spending was led by a pre-tariff 3.2% rise in durables, notably autos, but services were also strong at 0.6%, with January and February both revised higher to gains of 0.5%.
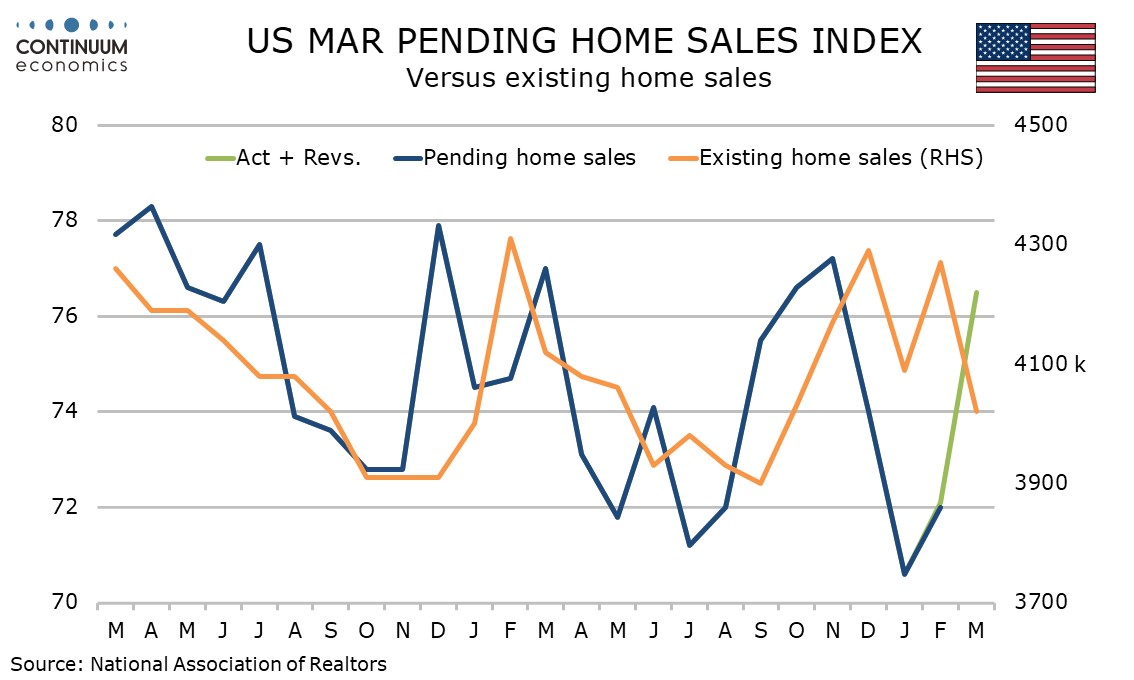
The pending home sales bounce is stronger than most recent housing sector data have suggested, but even with a 2.1% rise in February does not fully erase declines of over 4.0% in both December and January. Those took the series to a record low, significantly underperforming existing home sales which pending home sales are declined to predict. Improved weather in March may have been supportive.