U.S. Personal Income slips, Core PCE Prices remain firm
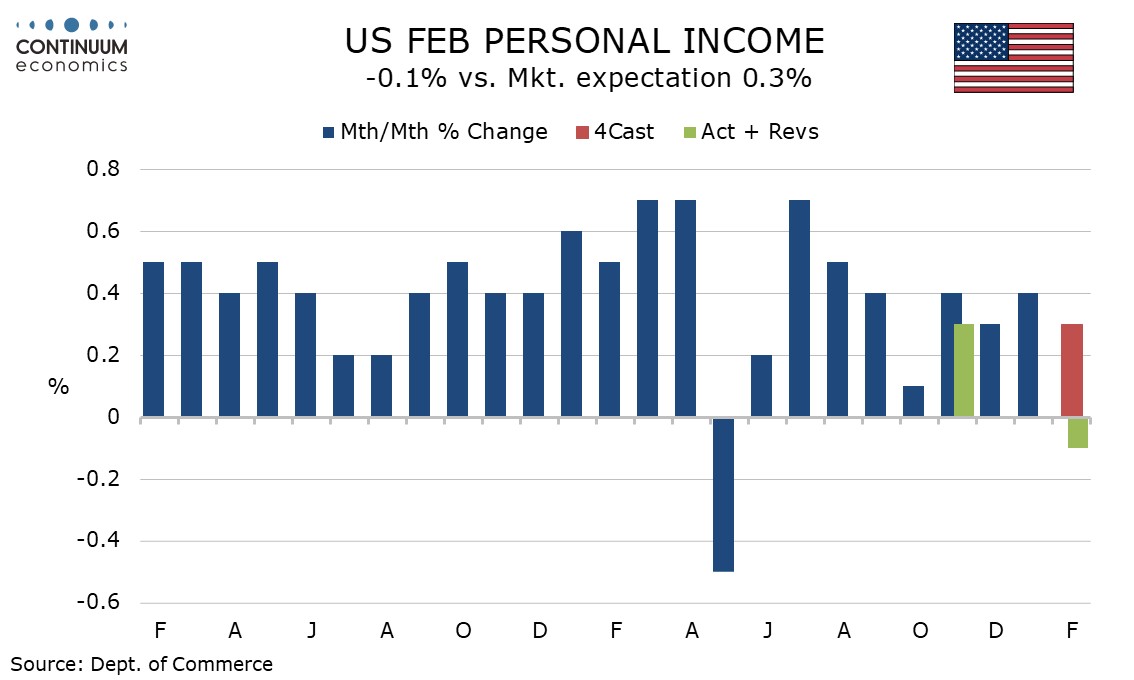
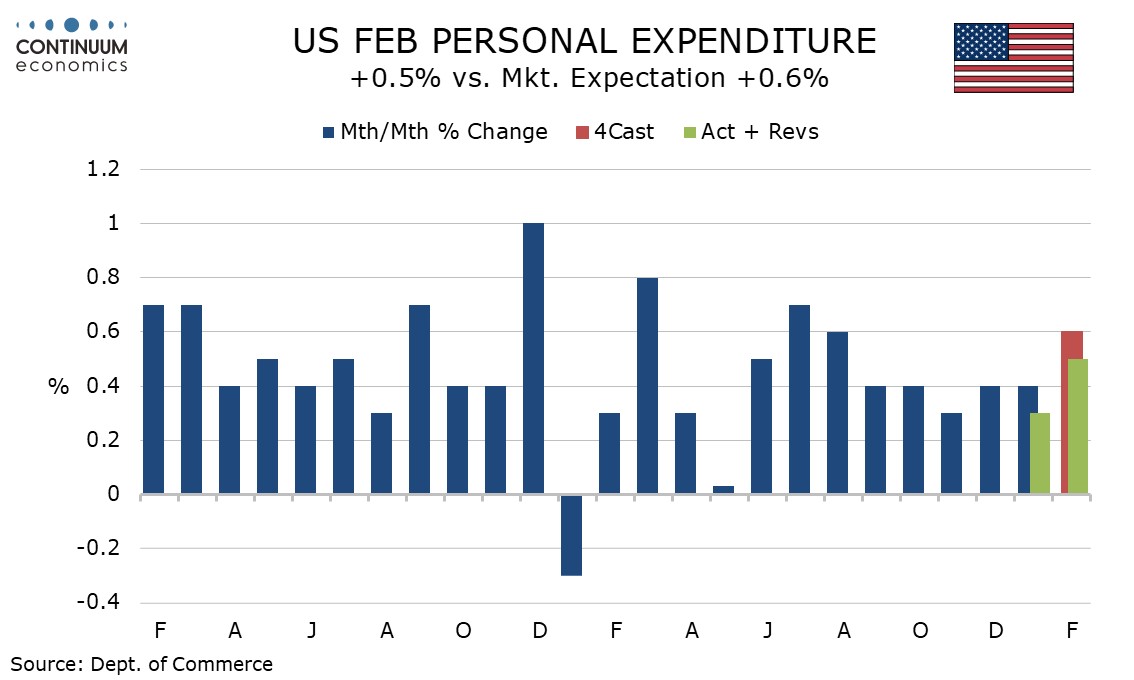
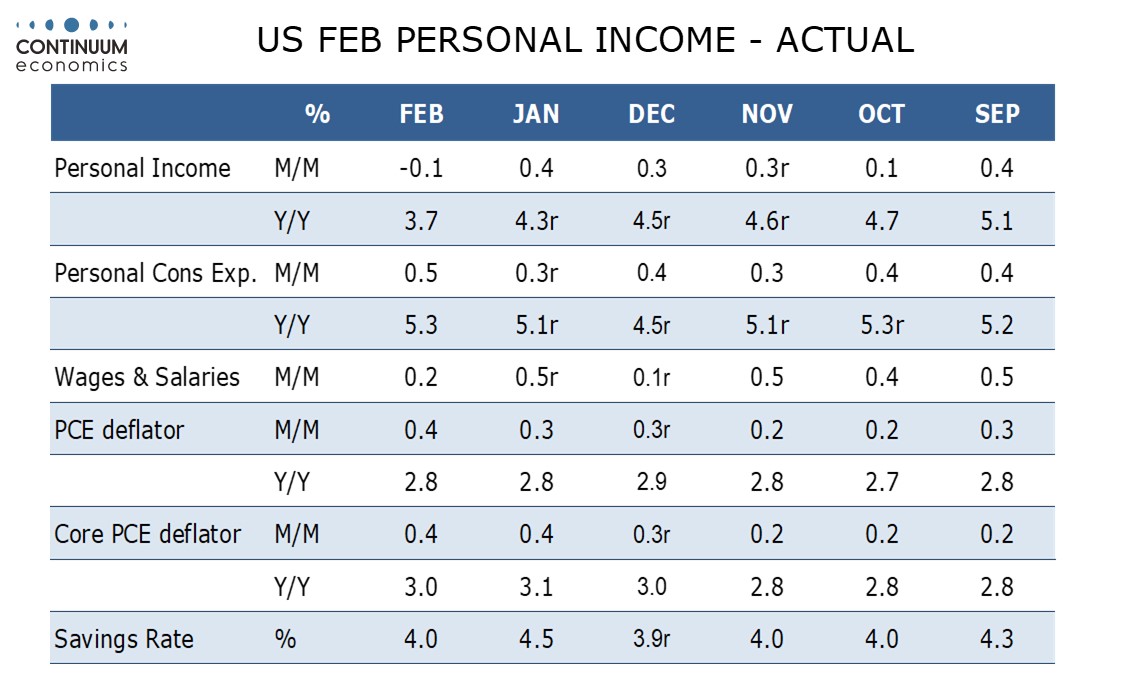
The latest US data is mostly on the weak side of expectations, most notably a 0.1% decline in personal income for February that significantly underperformed a 0.5% rise in spending (itself slightly below expectations) which saw the savings rate slip back after a tax cut-assisted bounce in January. 0.4% gains in overall and core PCE prices are as expected but too high. Initial claims corrected higher but continued claims are down, while Q4 GDP was revised even lower, to 0.5% from 0.7%.
The personal income detail shows a 0.2% rise in wages and salaries, below trend as was February’s non-fark payroll. Causing overall personal income to fall were significant declines in dividend income and benefits from Affordable Health Care enrollments. Disposable income was supported in January by lower taxes. The flip side of lower taxes is lower benefits. Real disposable income fell by 0.5% after a 0.6% increase in January.
Personal spending was supported by strength in February retail sales already released, led by autos which rebounded from a weak January, but service spending rose by only 0.3%, weaker than expected and up only 0.1% in real terms. The savings ratio at 4.0% is back near Q4 levels after a bounce to 4.5% in January.
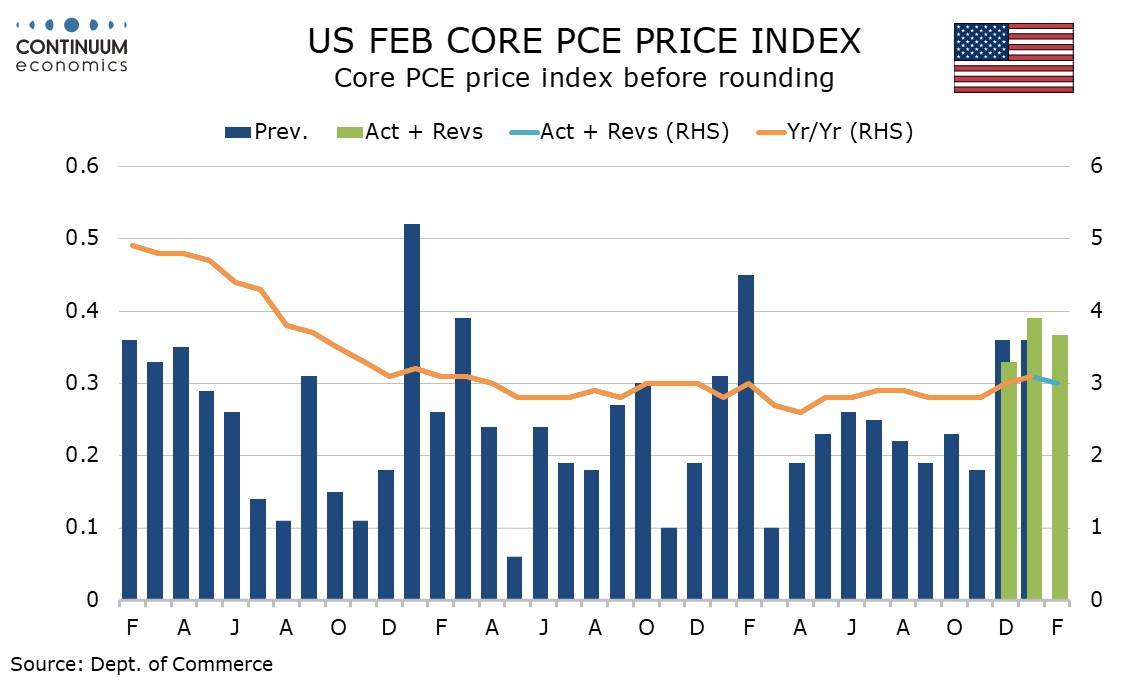
The core PCE price index is up by 0.4% for a second straight month, suggesting significant underlying inflationary pressure even before the oil price shock hit. Both of these gains were slightly below 0.4% before rounding, with February’s being 0.37%. Yr/yr core PCE prices slowed to 3.0% from 3.1%, but remain well above the 2.0% target. Overall PCE prices also rose by 0.4%, with yr/yr growth stable at 2.8%.
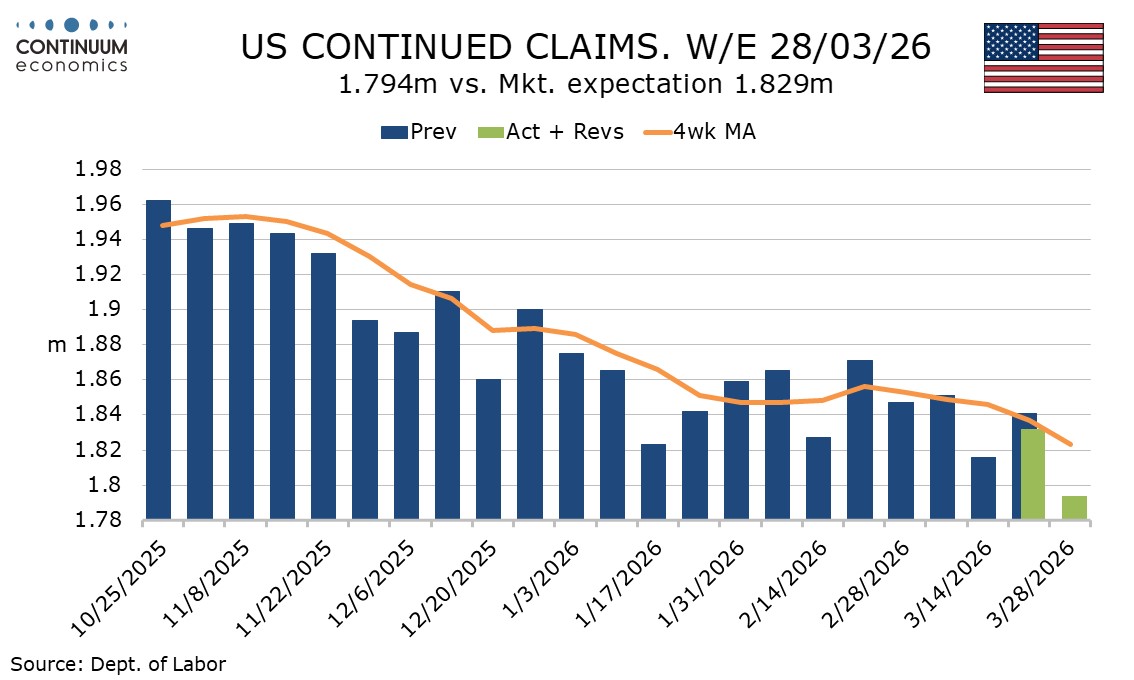
The latest initial claims number at 219k is the highest since February 7 after at 203k being at its lowest level since January 10. It is unclear at this point whether the weekly increase is a sign of the oil shock having a negative impact on activity or simply a correction from last week’s low figure. The 4-week average of 209.5k remains very low.
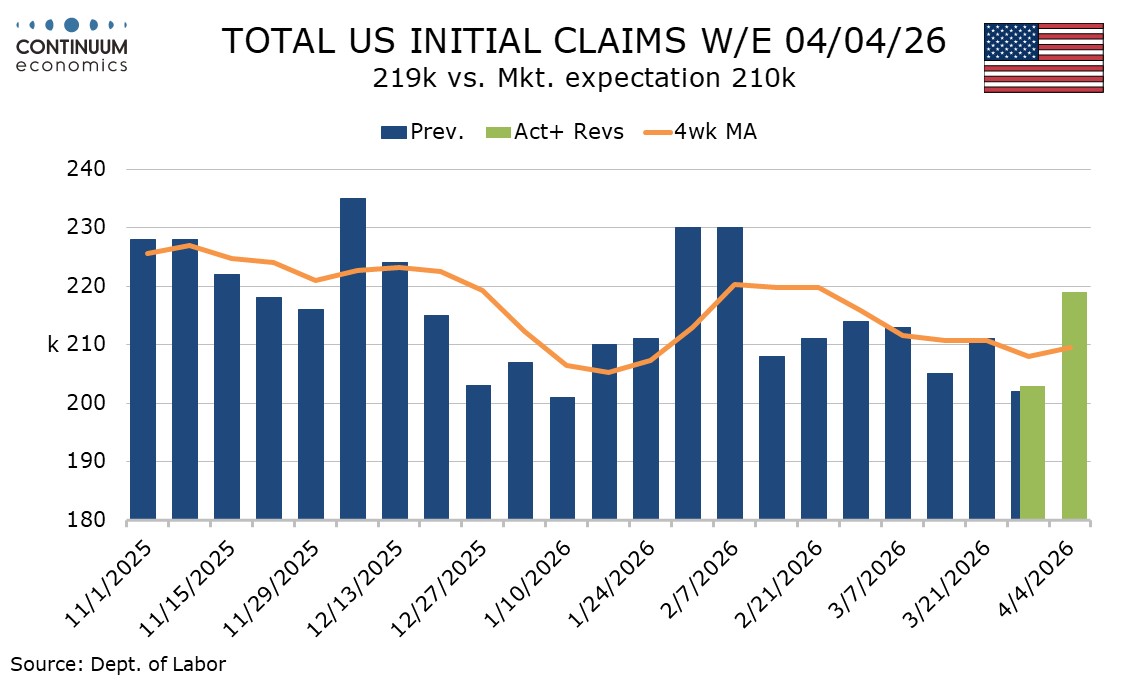
Continued claims cover the week before initial claims so the low continued claims number comes in a week when initial claims were low. At 1.794m from 1.832m the number is the lowest since May 2024 and a downtrend which appeared to have stalled in Q1 has resumed. This suggests jobs are becoming easier to find, supporting the message of March’s stronger non-farm payroll.
The downward revision to Q4 GDP to 0.5% from 0.7% saw negative revisions to inventories, housing and marginally consumer spending, with the negative from the shutdown-hit government now marginally less so. Final sales (GDP less inventories) were revised down to 0.3% from 0.4%, final sales to domestic purchasers (GDP less inventories and net exports) unrevised at 0.6%, while private sales to private domestic purchasers were revised to 1.8% from 1.9%.
Gross domestic income for Q4 was released for the first time and at 2.6% is significantly stronger than GDP, a positive signal. GDP understated the underlying GDP picture due to the government shutdown. Price indices for PCE and core PCE were unrevised at 2.9% and 2.7% respectively but the overall GDP price index saw a marginal downward revision to a still firm 3.7% from 3.8%.