The Aussie Chapter 1: Interest Rate and Yields
The Australian Dollar ,"Aussie", has been referred as the commodity currency, risk currency, proxy Yuan by market participants who see correlation between the corresponding benchmark and the Aussie. While they all have sounded reasons to support their perspective, the level of correlation seems to be conveniently overlooked. In "The Aussie", we will look into the historical correlation among the Aussie and well-known benchmark to give our readers a closer look towards factors that have been affecting the movement of the Australian Dollar. In Chapter 1, we will first see how interest rate and yields affects the currency.
Whenever a market participant go long or short a currency pair, there is always a positive or negative carry. In simpler terms, it mean they are either earning or losing money every day they decide to sit on their position. The basis of carry is interest rate differential, the difference between two central banks' interest rate. Naturally, a currency with higher yield will be favored against lower yield and the RBA has long kept a relatively high interest rate within the major DM central banks, which theoretically should see the Australian Dollar being favored against lower yielding counterparts. Let's take a look into the Aussie performance against G7 counterparts in regard to interest rate.
Interest rate are much more dynamic in 2000-2001 (dot-com bubble & 9-11), 2007-2008 (GFC), 2008-2010 (Europe Debt Crisis) and 2020 (COVID-19), else central banks mostly follow tightening/easing cycle in their policy decision.
In early 2001, the RBA remains dynamic after the "dot-com burst". From December 2001 to June 2002, RBA tightened to 6.25% before beginning to ease in October 2002 to September 2003 at 4.25%. From there onward to October 2009, the RBA has been gradually pushing rates to 7.25% then eased throughout the next two quarters to 3% in May 2010. The tightening cycle resumes for another two years and since is on the easing cycle till May 2022 when tightening resumes.
Figure 1: AUD/USD Performance with reference to RBA and Fed Rate
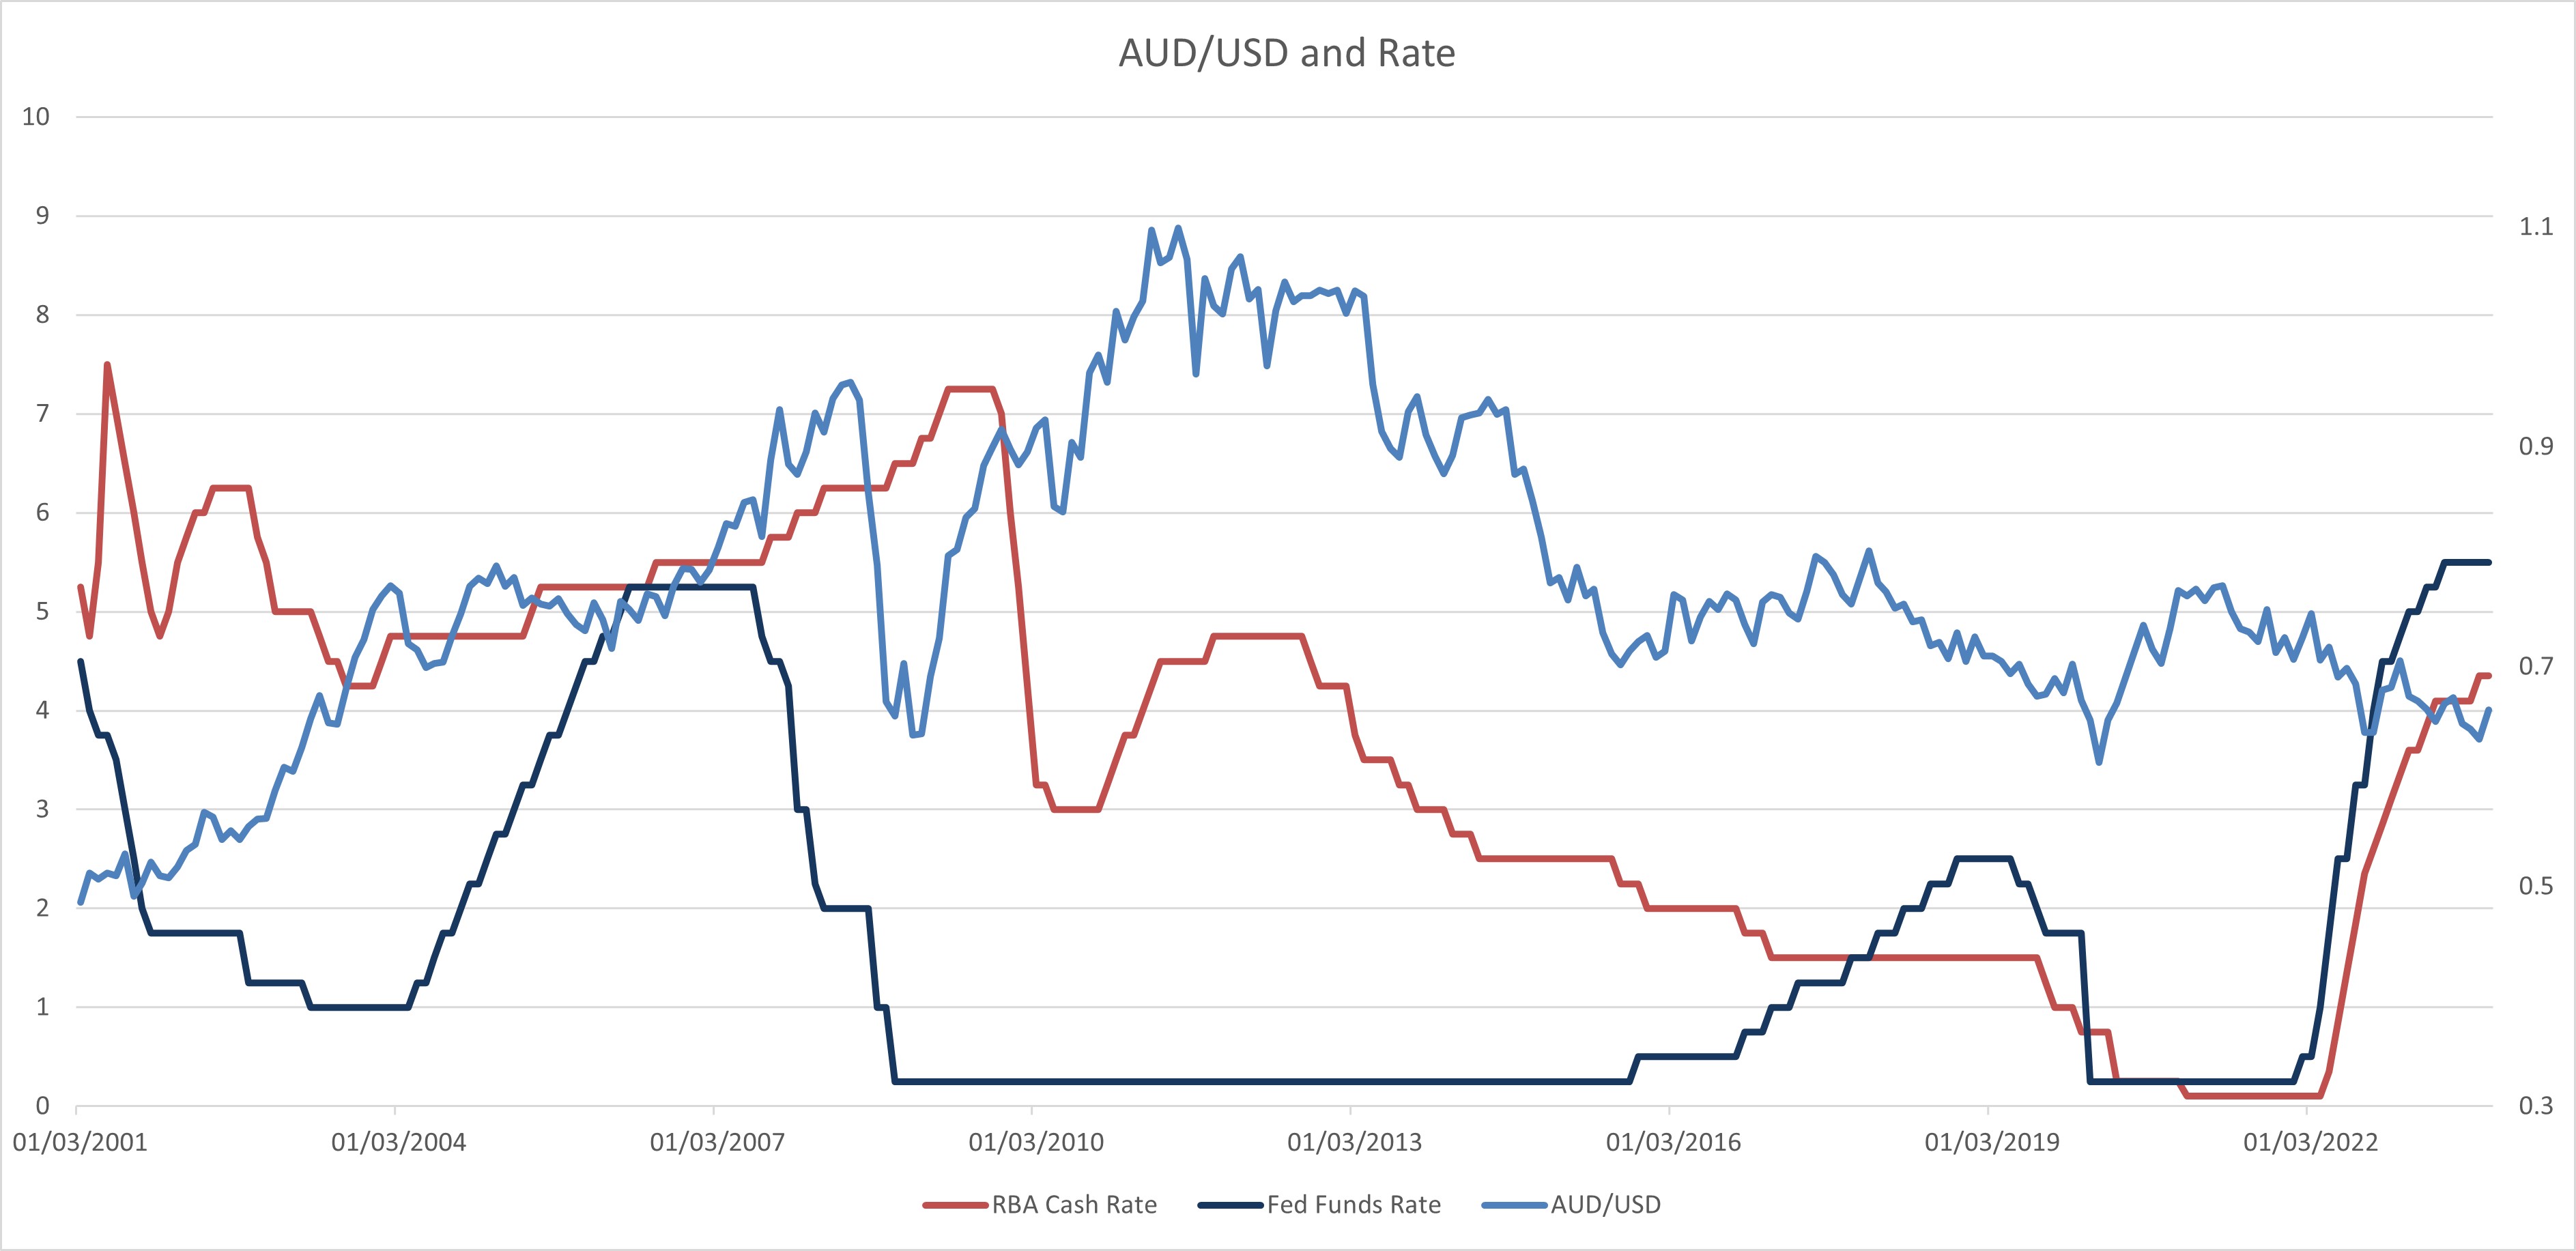
Figure 1 showed how the AUD/USD perform with reference to both the RBA and Fed rates.
In the past two decades, the Fed fund rate peaked at 6.5% on April 2000 and is on the easing cycle till 1% at April 2004. The subsequent tightening brought rate to 5.25% before easing in August 2007 to November 2008 with rates staying at 0.25% for seven years. The next tightening cycle last four years, easing cycle another two and a half year before the current tightening cycle with rates holding at 5.5%.
There are major time interval when the rate differential between the RBA cash rate and Fed fund rate are larger than usual. In Q2 2022, RBA is holding the cash rate 4.5-5% higher than the Fed; in Q1-3 2009, RBA's cash rate is 6.5-7% higher than Fed rate and from Jan 2018 to Jan 2020, the Fed rate is higher than RBA cash rate by 0.75-1%. In present day, when both the RBA and Fed is expected to hold rates after rapid tightening from 2022, the Fed's rate is 1.15% higher than RBA cash rate. Generally speaking, the correlation is stark that AUD/USD mostly follows rate differential in the past 20 years except for the GFC year.
Figure 1.1: AUD/USD Performance with reference to U.S. and Australia 2yr Government Bond Yield
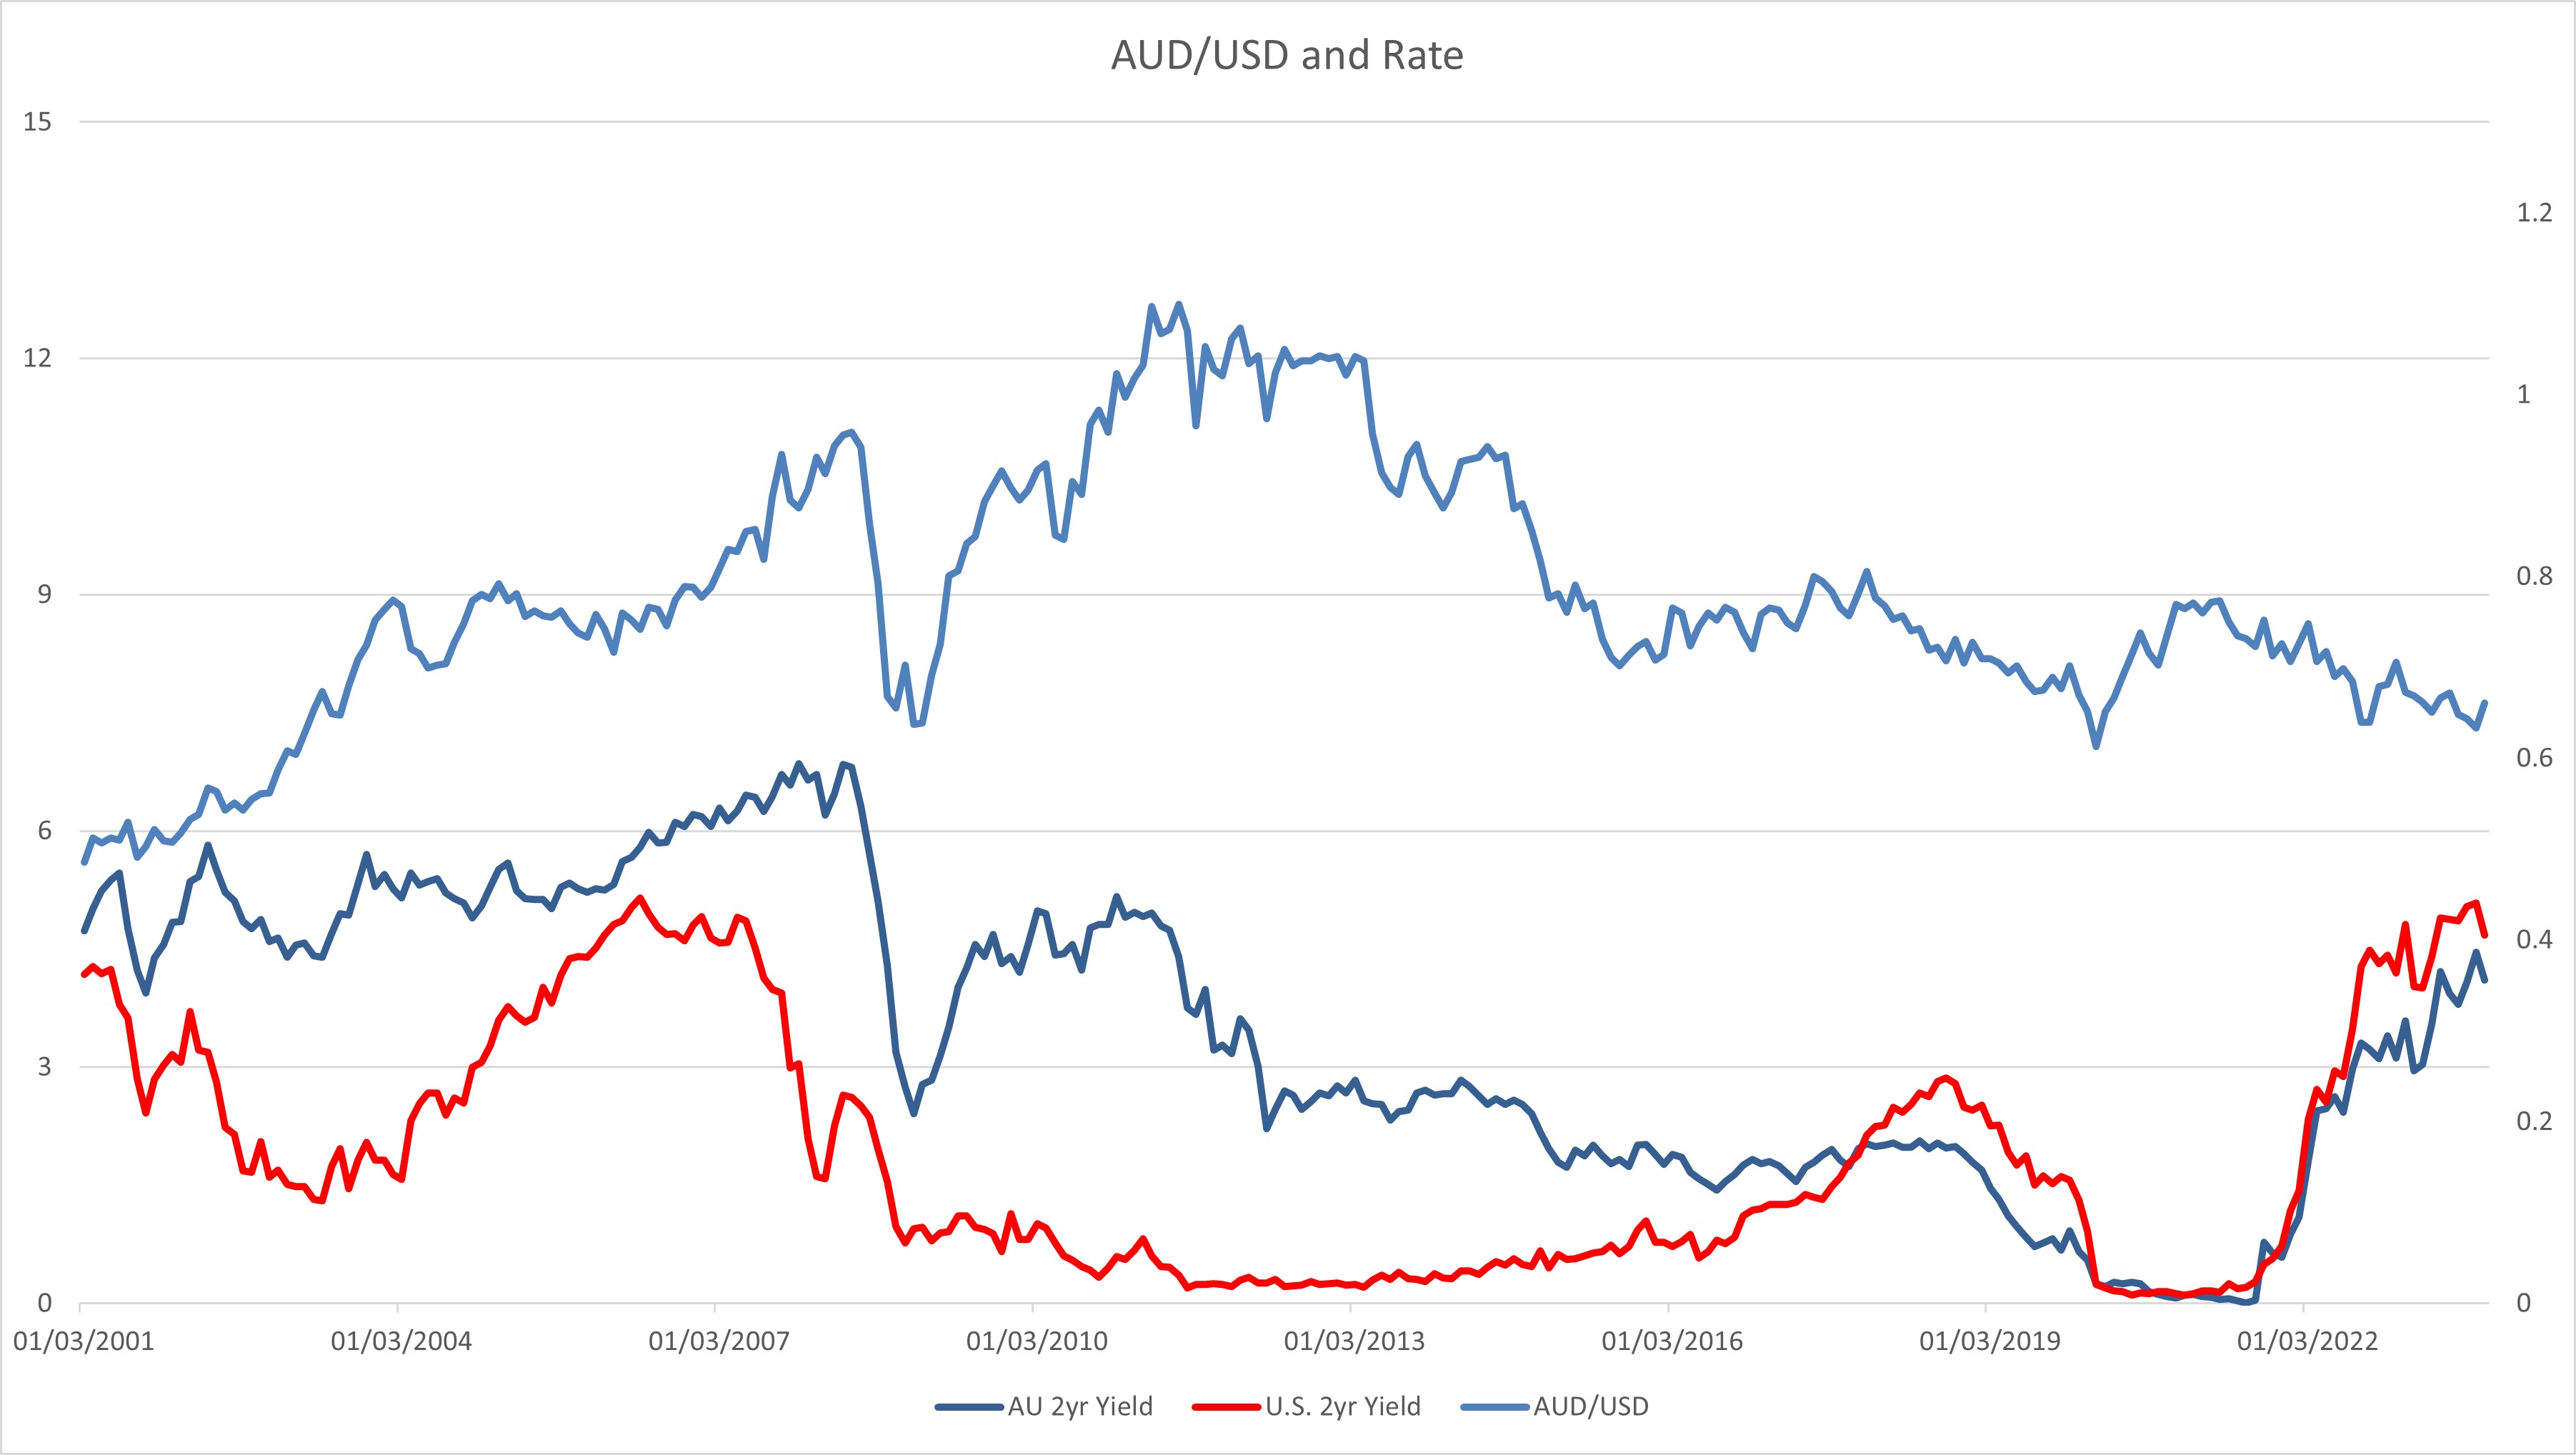
Figure 1.1 shows the AUD/USD's performance along with changes in U.S. and Australia 2yr Government Bond Yield. The Australian yields seems to always front run rate decision while U.S. Yields track closer.
In comparison with RBA rate decision, the 2yr Australian government bond yields seems to be a better guide for AUD/USD's performance. It is clear that in times of Australian 2yr yields are higher than U.S. 2r T-yields, the AUD/USD is closely tracking the yield differentials and the same is also correct when U.S. 2yr T-yields are higher for the past two decades. In the 2003 and 2010, the yield differentials are the biggest at 3.5-4.5% and subsequently see the AUD/USD to appreciate at an accelerating pace for such differential to widen. And in 2018 (first time in twenty years U.S. 2yr T-yields are higher than Australian 2yr yield) and since 2022, the AUD/USD declined at a sharper than average pace.
Figure 2: AUD/NZD Performance with reference to RBA and RBNZ Rate
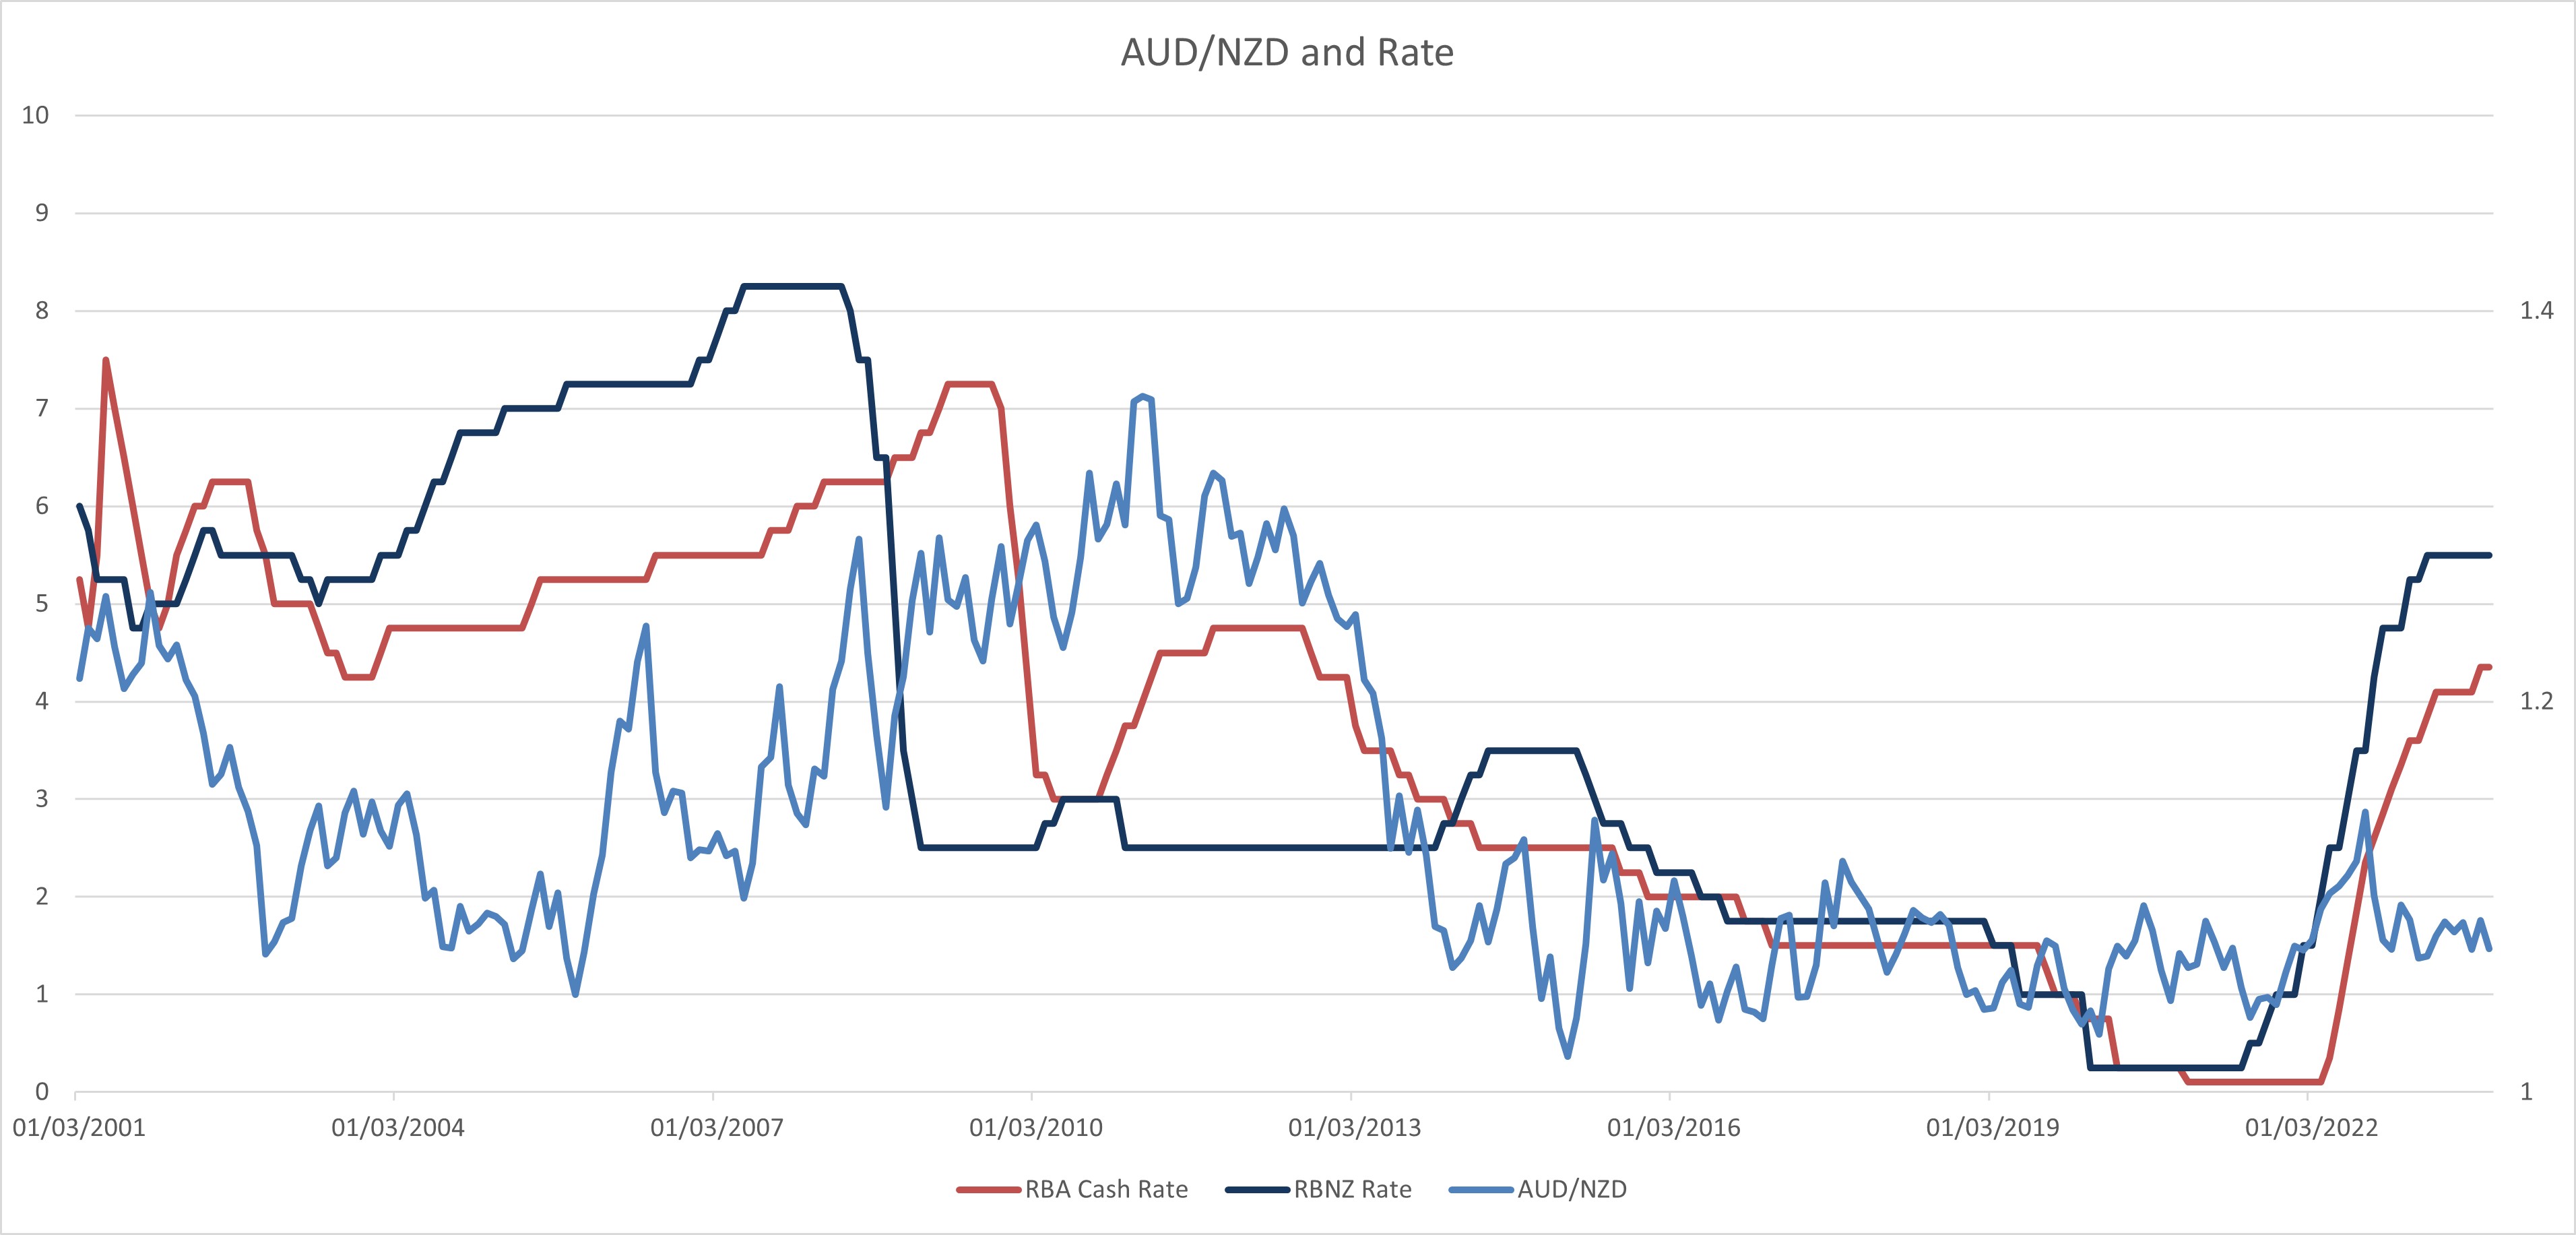
Figure 2 showed how the AUD/NZD perform with reference to both the RBA and RBNZ rates.
The RBNZ has a dynamic start in 2001 to December 2003 where rates ranging from 4.75 - 6%. Starting from January 2004, the RBNZ began their tightening cycle till 8.25% in May 2008 before easing rapidly to 2.5% in the following two quarters. The rate is then hold steady December 2013 with a 0.5% hike from May to December 2010. The next tightening cycle last one and a half year before turning to easing for more than seven years. Tightening is resumed in October 2021 till now when rates steady at 5.5%.
This is an interesting read given the close proximity of Australia and New Zealand, both geographically and economically. The largest rate difference came in at Q3 2007 of 2.5% and 5% throughout Q2-3 2009. Else, the rate path for both the RBA and RBNZ looks similar. It looks like the impact of interest rate differential is clearly shown in most years except the period of 2005-2007. The interesting read here is that AUD/NZD players to be fronting running rate decision and have great faith in forward guidance. Moreover, the rate differential seems to have a less lasting impact to the pair compared to other major Aussie pairs.
Figure 2.1: AUD/NZD Performance with reference to U.S. and NZ 2yr Government Bond Yield
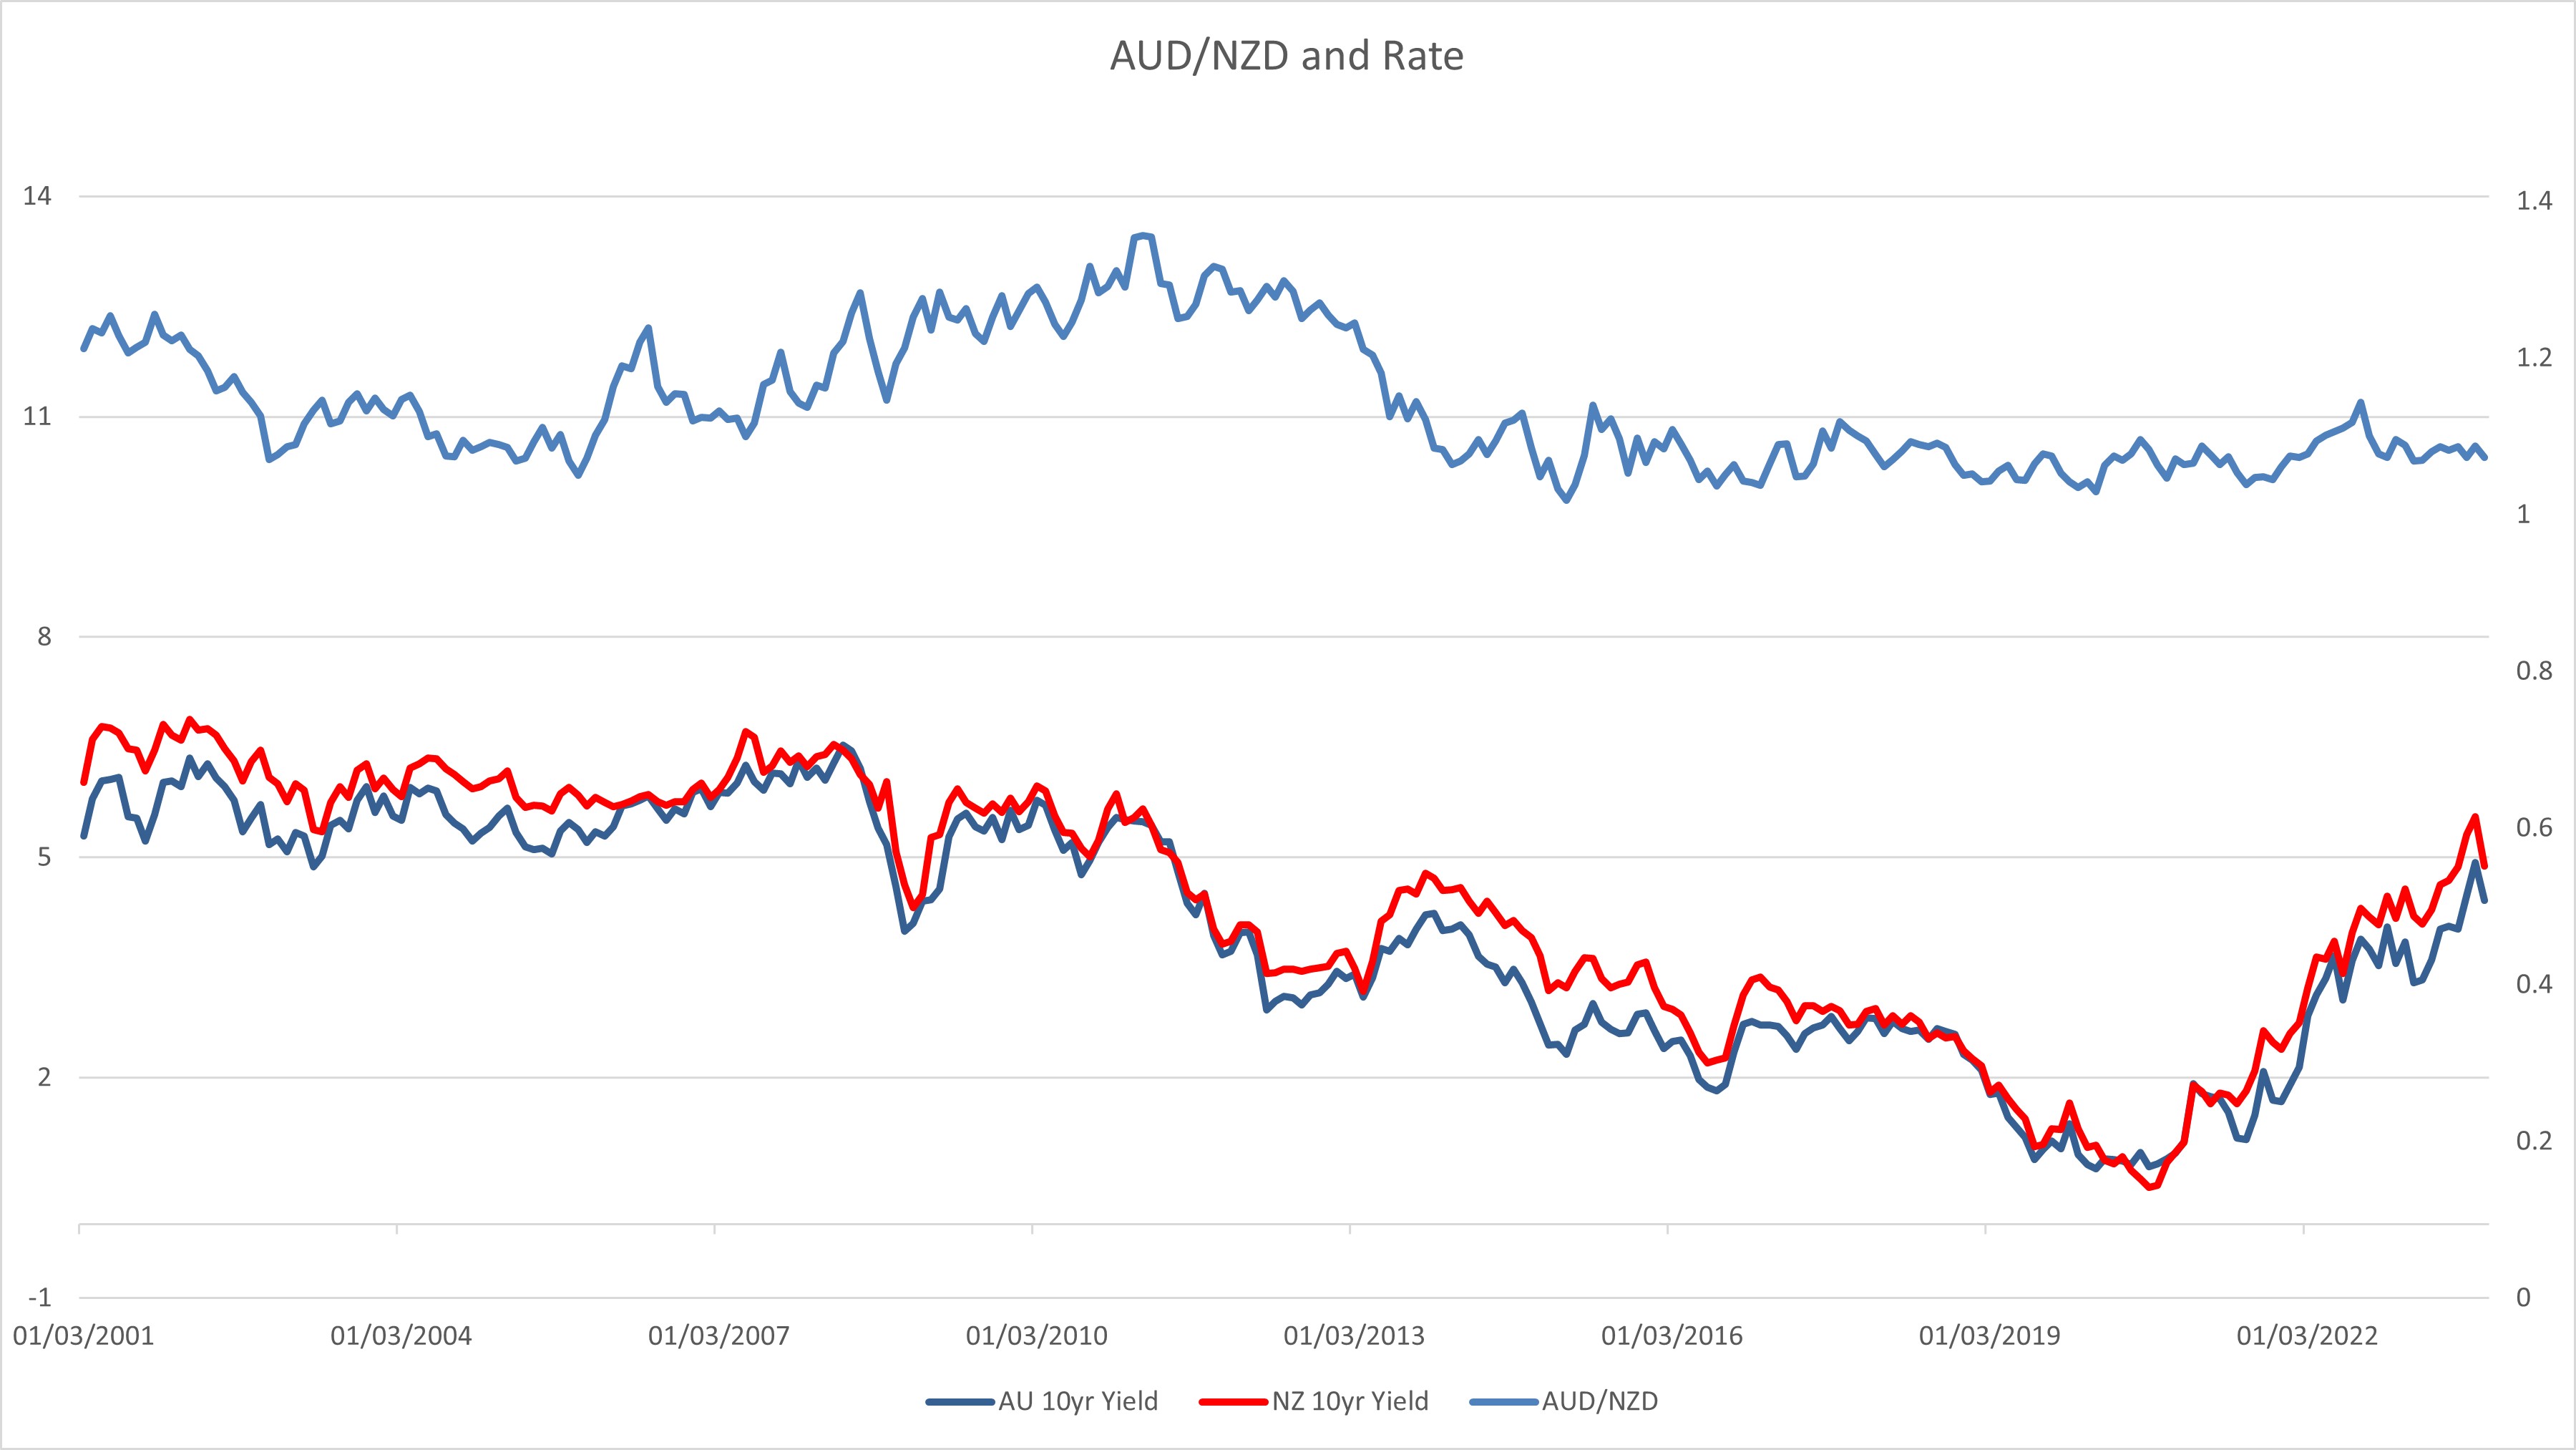
Figure 2.1 shows the AUD/NZD's performance along with changes in AU and NZ 2yr Government Bond Yield. The NZ 2yr yields are tracking closely to RBNZ's rate decision.
As intertwined as the Australia and New Zealand, the government bond yields are very close for both countries with the NZ yields on average higher not more than one percent. The time interval between 2004 -2006 and 2013 - 2015, when yield differentials began to widen, showing the AUD/NZD to fall at a faster pace than average yield trend.
Figure 3: AUD/EUR Performance with reference to RBA and ECB Rate
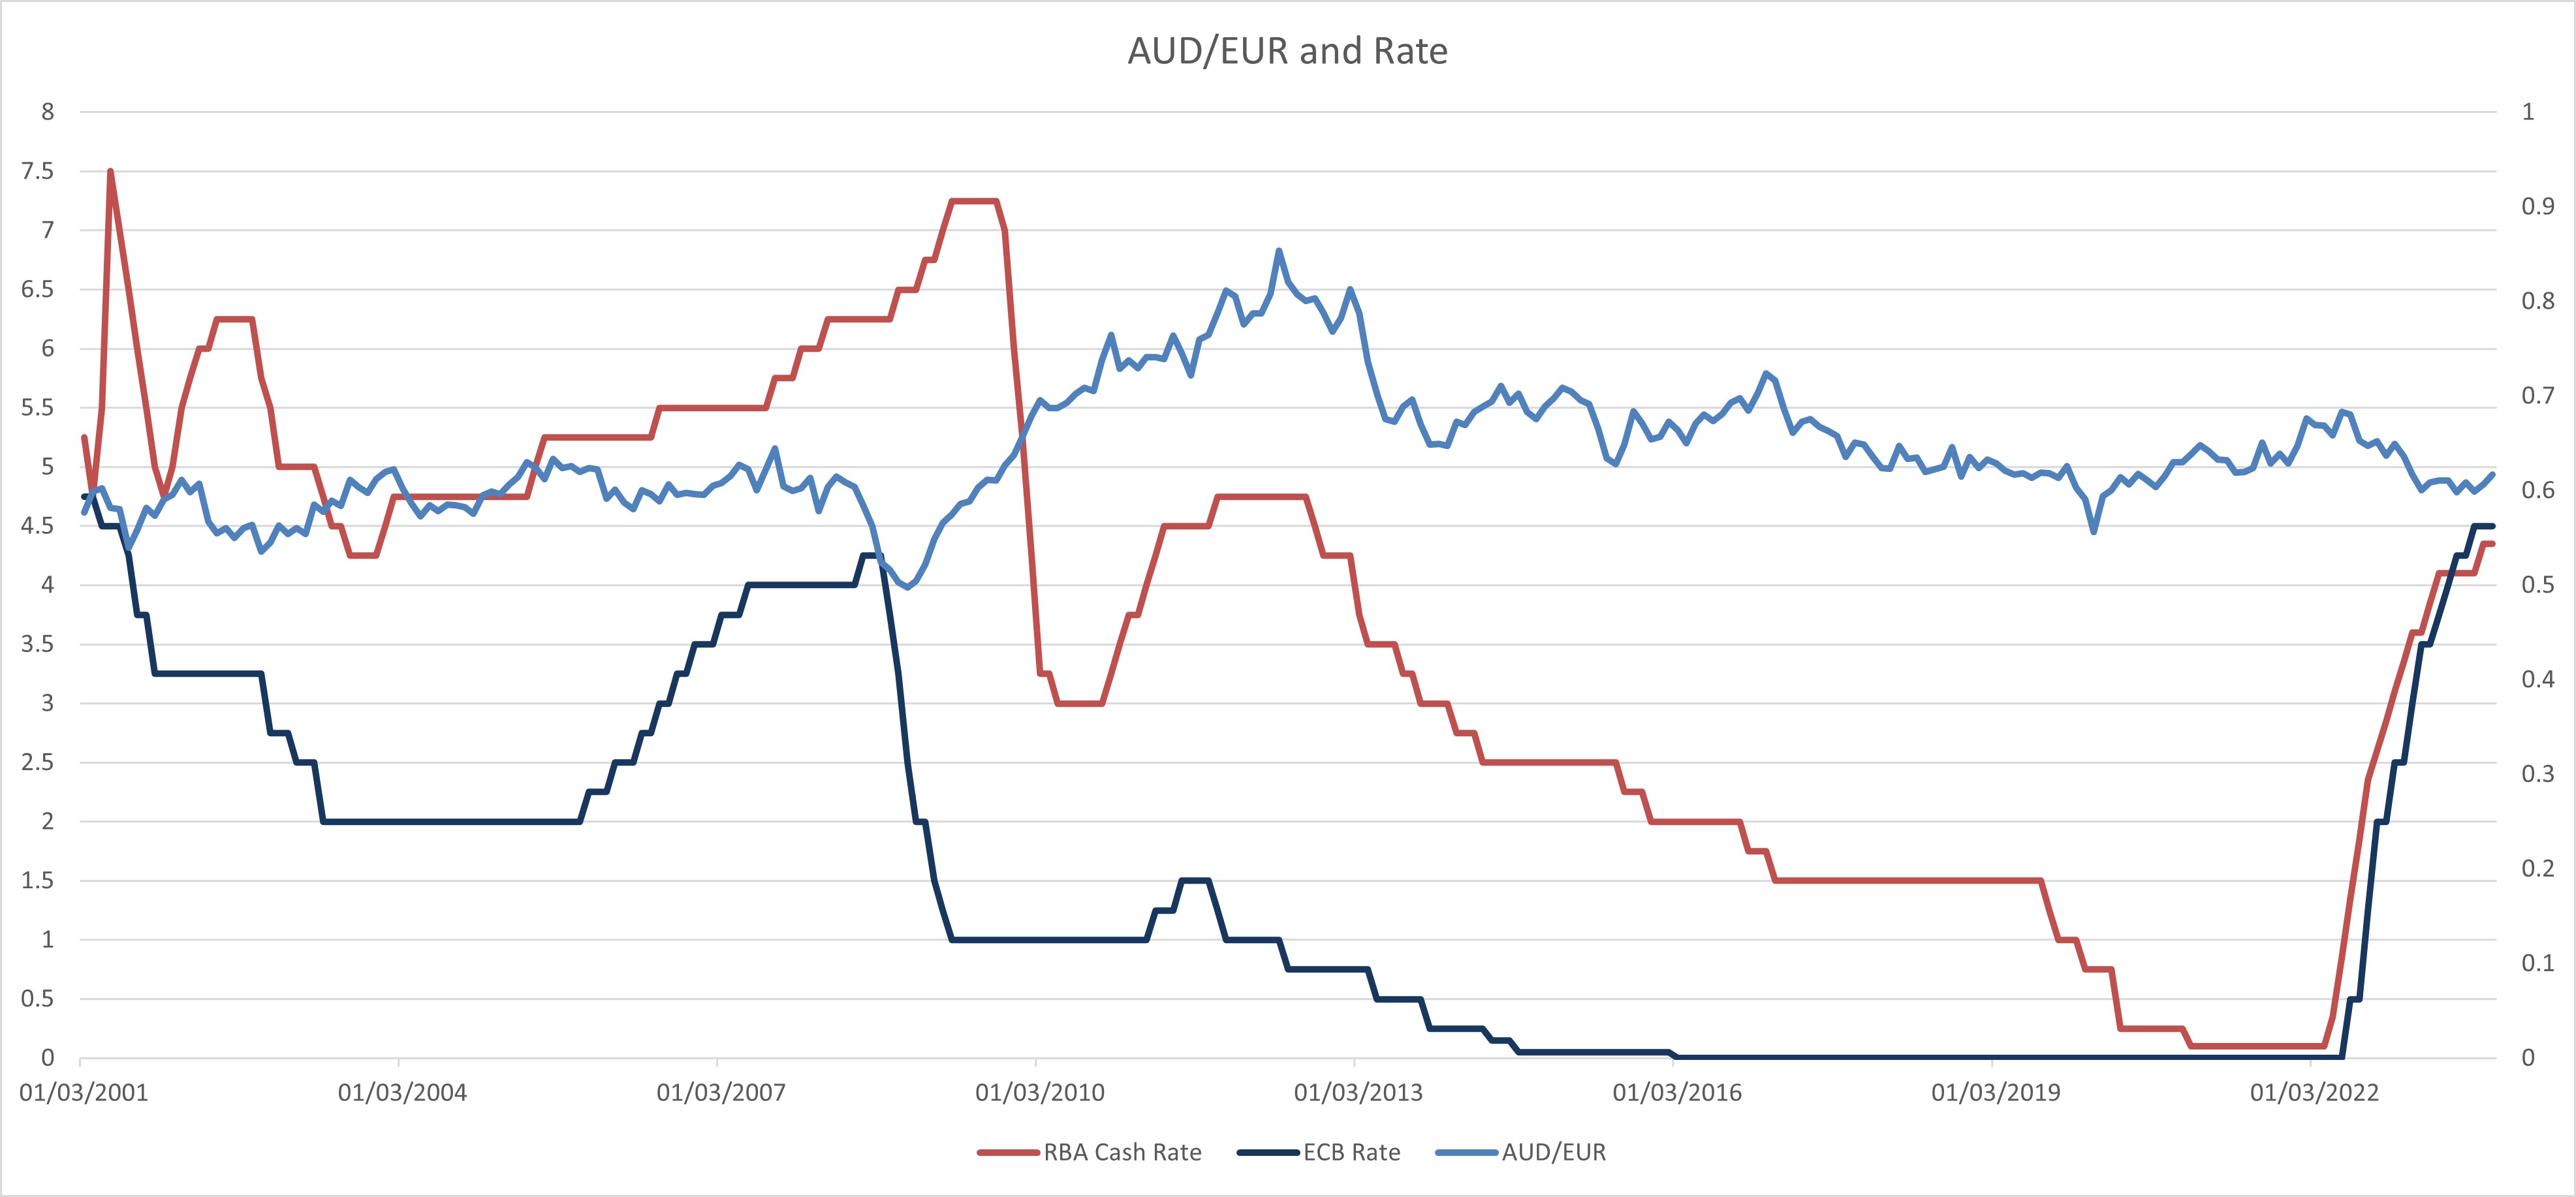
Figure 3 showed how the AUD/EUR perform with reference to both the RBA and ECB rates.
The pace of RBA and ECB policy decision is similar with the RBA mostly leading 1.5-2% in interest rate. The ECB has been steadily easing from 4.75% in 2001 to 2% in November 2005. They turned to tightening in December 2005 to 4.25% in September 2008, which swiftly see rates lower to 1% in two quarters. The ECB tried to resume tightening in April 2011 but the high only reached 1.5% in August 2011 when they began easing again til July 2022. That is the tightening cycle till the present with rate peaking so far at 4.5%.
With similar pace, there limited time when rate differential widens significantly and see AUD/EUR performing relatively steady. The key evident lies in 2009 to 2013 when the ECB begin cutting a year earlier and see AUD/EUR appreciate from 2008 to 2013. Subsequently, AUD/EUR tread lower as rate differential narrows from 2013 till now.
Figure 3.1: AUD/EUR Performance with reference to AU and Eurozone Generic 2yr Bond Yield
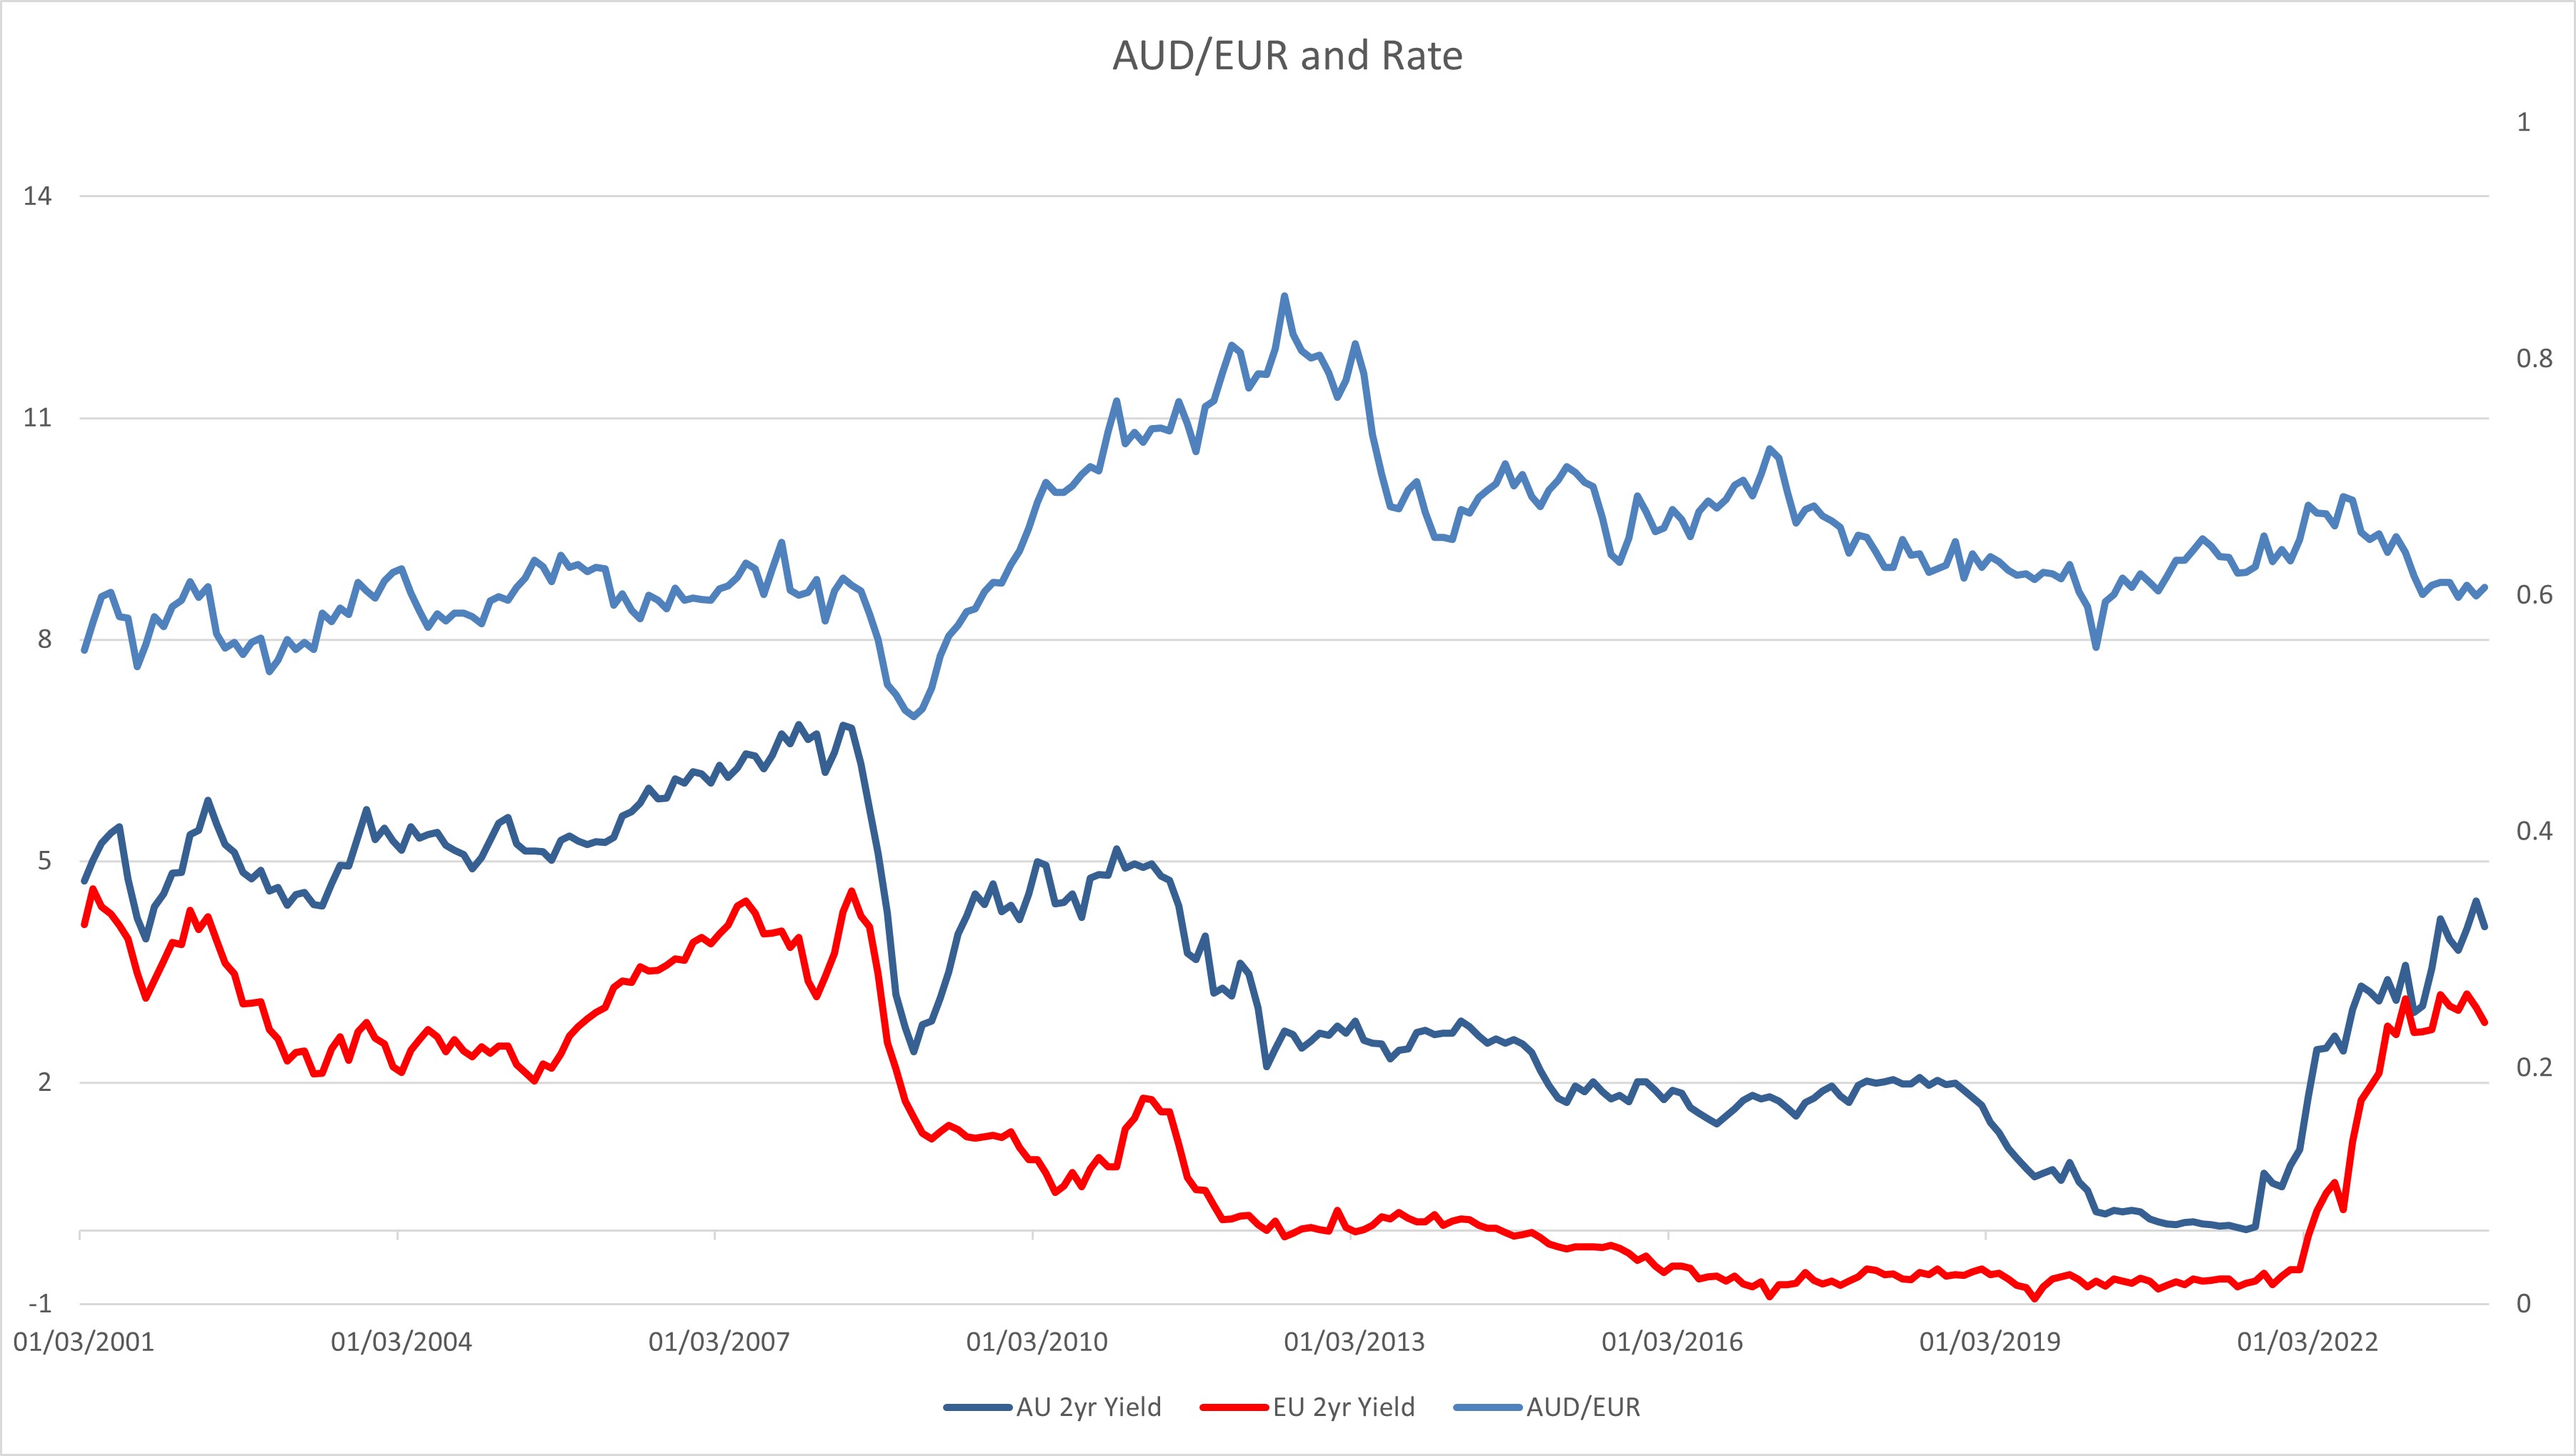
Figure 3.1 shows the AUD/EUR's performance along with changes in AU 2yr Government Bond and Eurozone 2yr Generic Government Bond Yield. The EU generic government bond yield seems to be front running rate decision by a quarter.
The Australian yields have been higher than EU yields for the past two decade and AUD/EUR is tracking closely to yield changes. The yield differentials are the largest in 2004 - 2005 and 2010 with the Australian yields being more than 3% higher. The AUD/EUR appreciation are the greatest when yield differential began to widen in 2009 - 2010, the move in 2004 - 2005 is dwarfed by it. The narrowing of yield differential from 2012 sees the AUD/EUR gradually tread lower.
Figure 4: AUD/GBP Performance with reference to RBA and BoE Rate
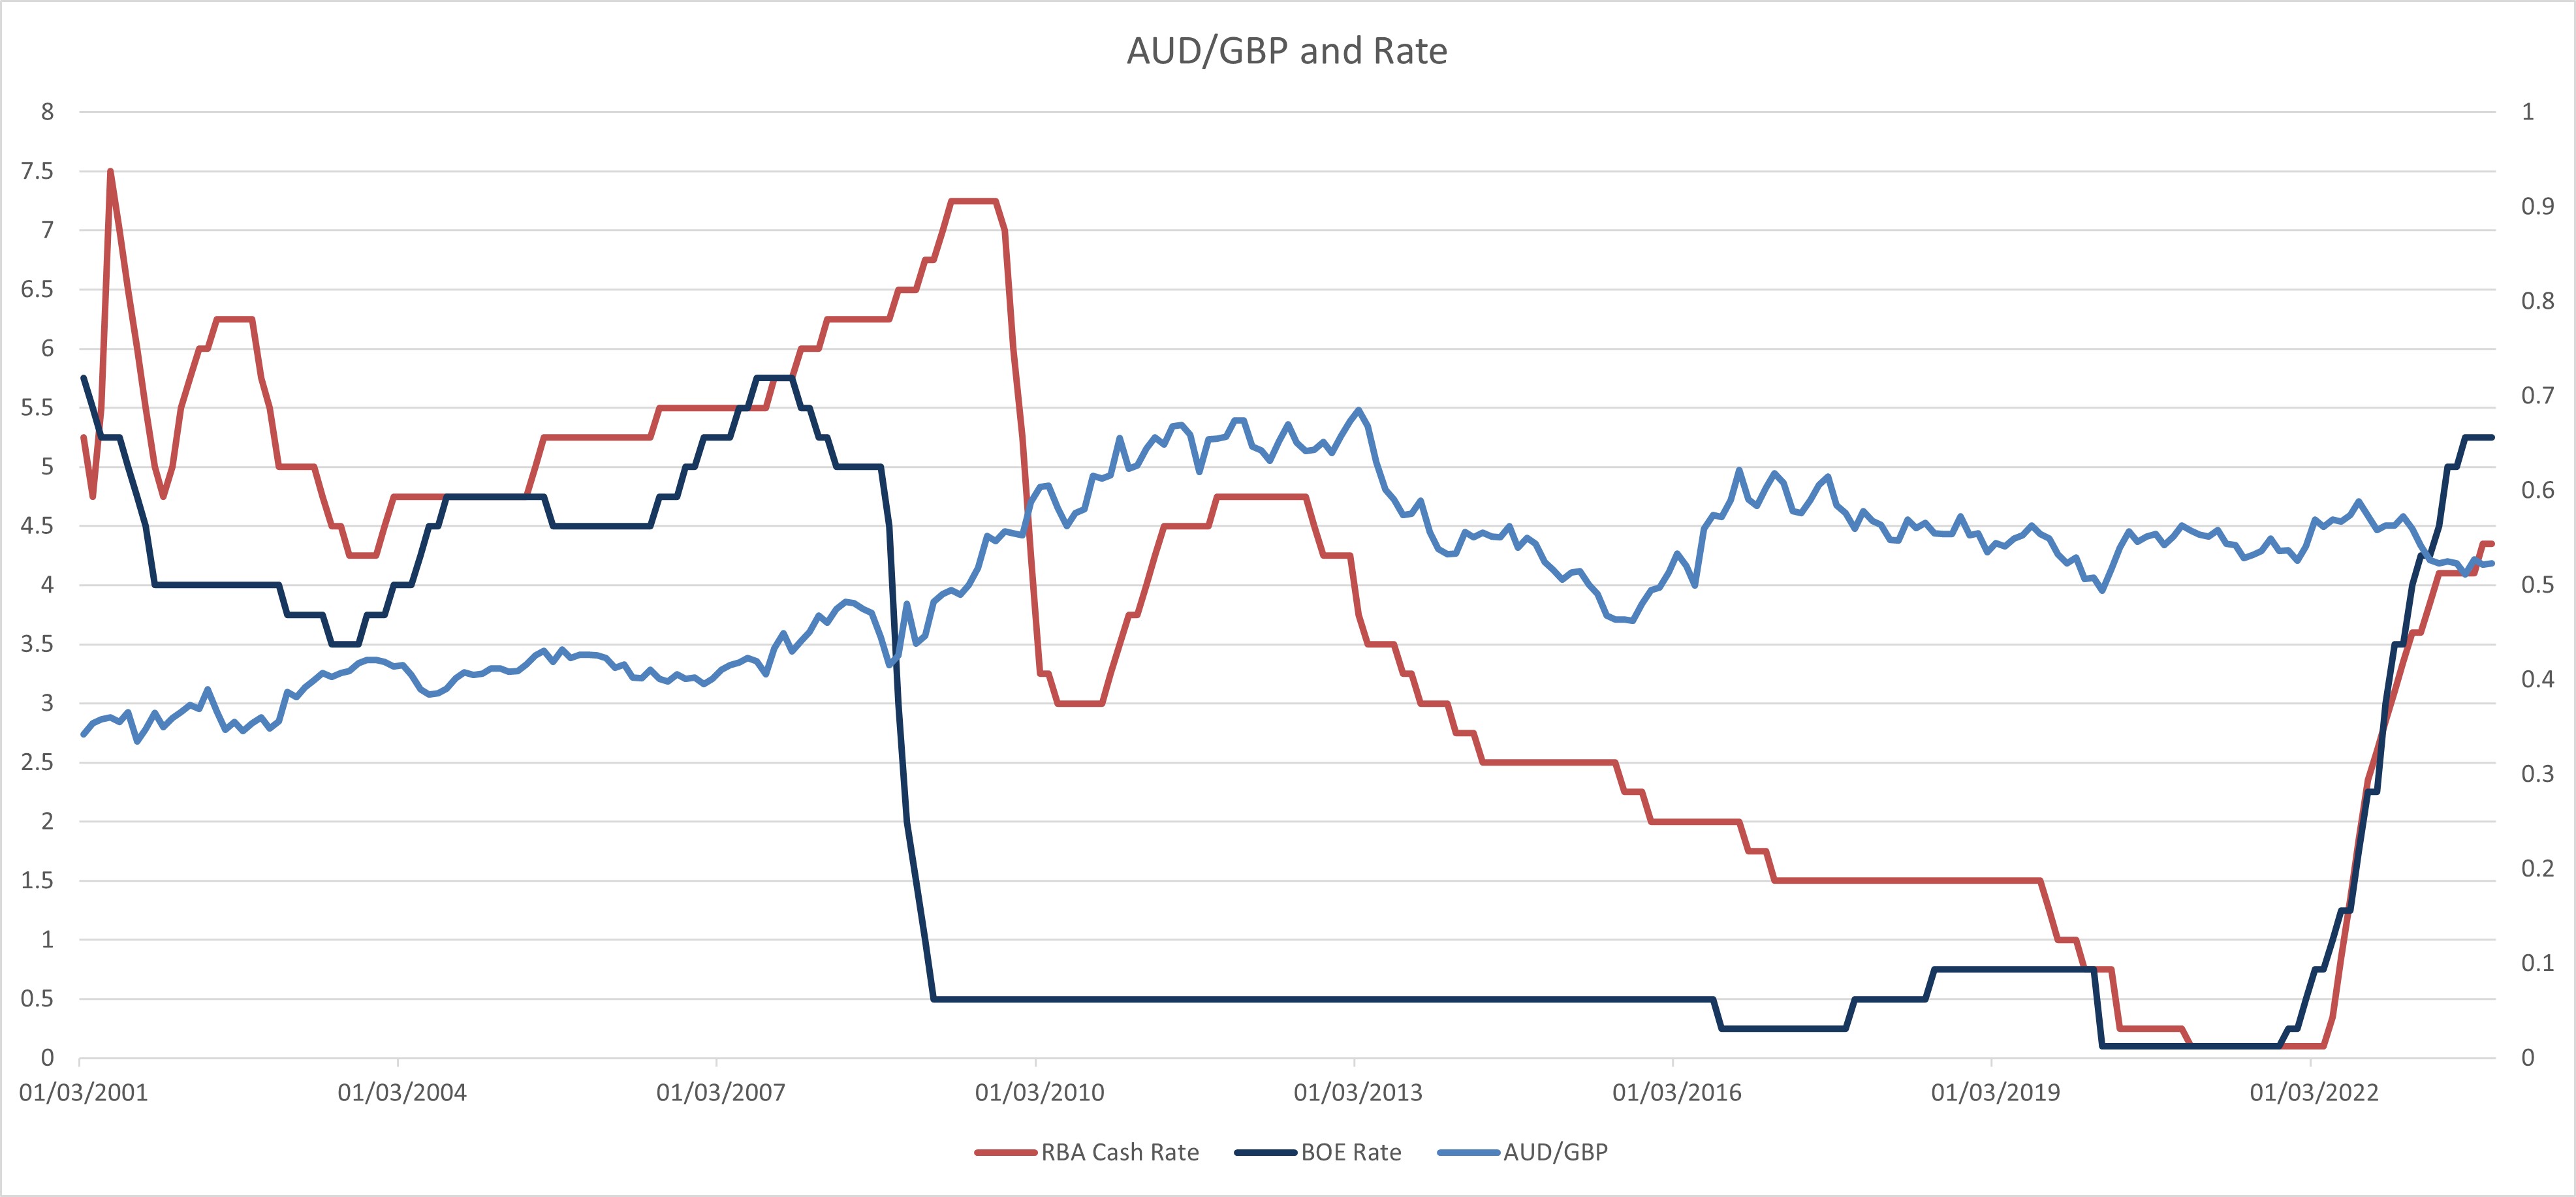
Figure 4 showed how the AUD/GBP perform with reference to both the RBA and BoE rates.
The BoE's policy pace is similar with the ECB but its rate is closer to RBA. The BoE has been easing from 5.75% since the beginning of March 2001 to 3.75% in January 2004. They hiked by 50bps in the following year before pausing in August 2005 and took a 25bps step back before resume tightening in August 2006 up to 5.75% at November 2007. The next easing cycle will persist till October 2017 where rates were 0.25% and the tightening was halted by COVID-19, taking rates lower to 0.1% The current tightening cycle began in December 2011 and see rates currently at 5.25%.
The BoE and RBA has minimal rate differential from 2003-2008 and COVID era. And in the days when RBA is holding a higher rate than the BoE, AUD/GBP generally trades higher, illustrated in 2002 - 2004, 2009 - 2013. The easing from RBA in 2012 - 2016 saw the Aussie weakens against Sterling and while BoE is holding a higher rate than RBA in 2023 Aussie weakens against Sterling again.
Figure 4.1: AUD/GBP Performance with reference to 2yr AU Government bond and GILT Yields
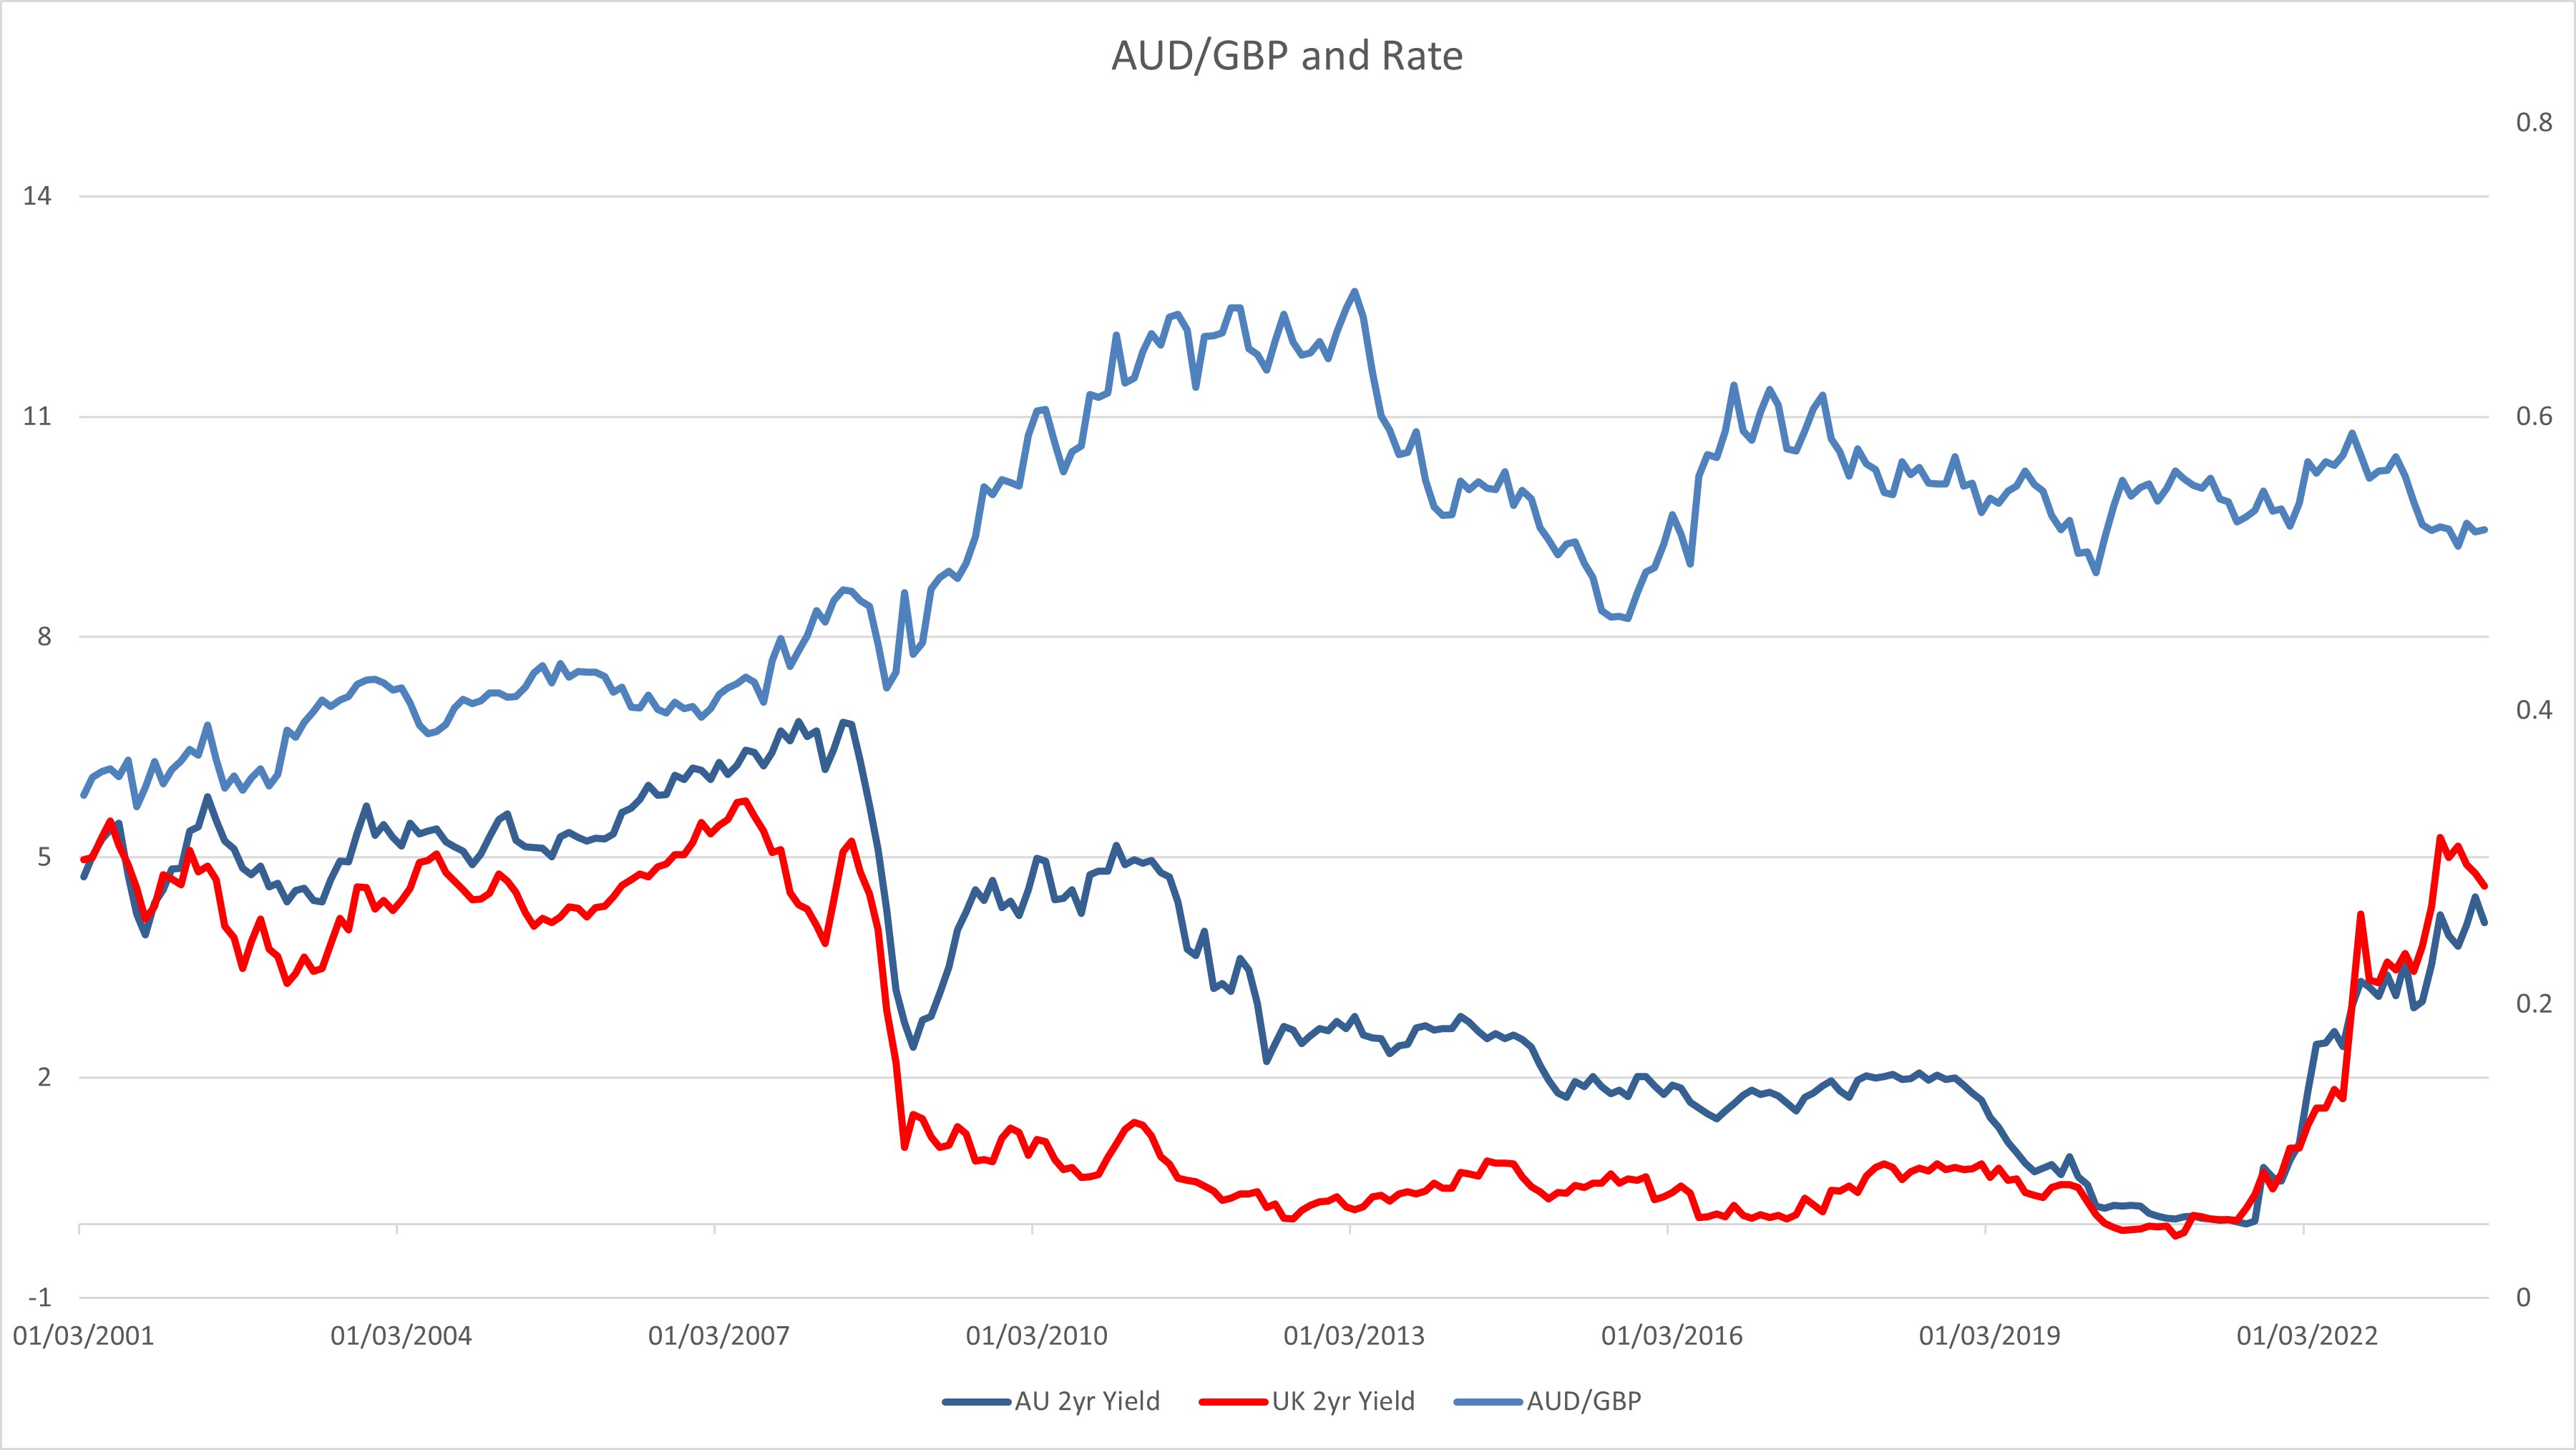
Figure 4.1 shows the AUD/GBP's performance along with changes in AU 2yr Government Bond and GILT 2yr Yield. GILT yields are tracking closely to BoE rate changes.
Australian 2yr yields mostly outperform 2yr GILT yields for the past two decades with a cross in early 2000. The largest yield differential lie in 2010 - 2011 at 3 - 4 percent. The beginning of differential widen in 2009 saw the AUD/GBP accelerate at the fastest pace for the past twenty years. The interesting read is that drop in AUD/GBP is the most fierce in 2013 when yield differential begin to narrows, instead of tracking the pace of narrowing. And indeed, there is a bounce in AUD/GBP in 2016 even when yields stay steady. GILT yields are higher than Australian's since mid 2022 but once again only the beginning of the move affects the performance of AUD/GBP.
Figure 5: AUD/CAD Performance with reference to RBA and BoC Rate
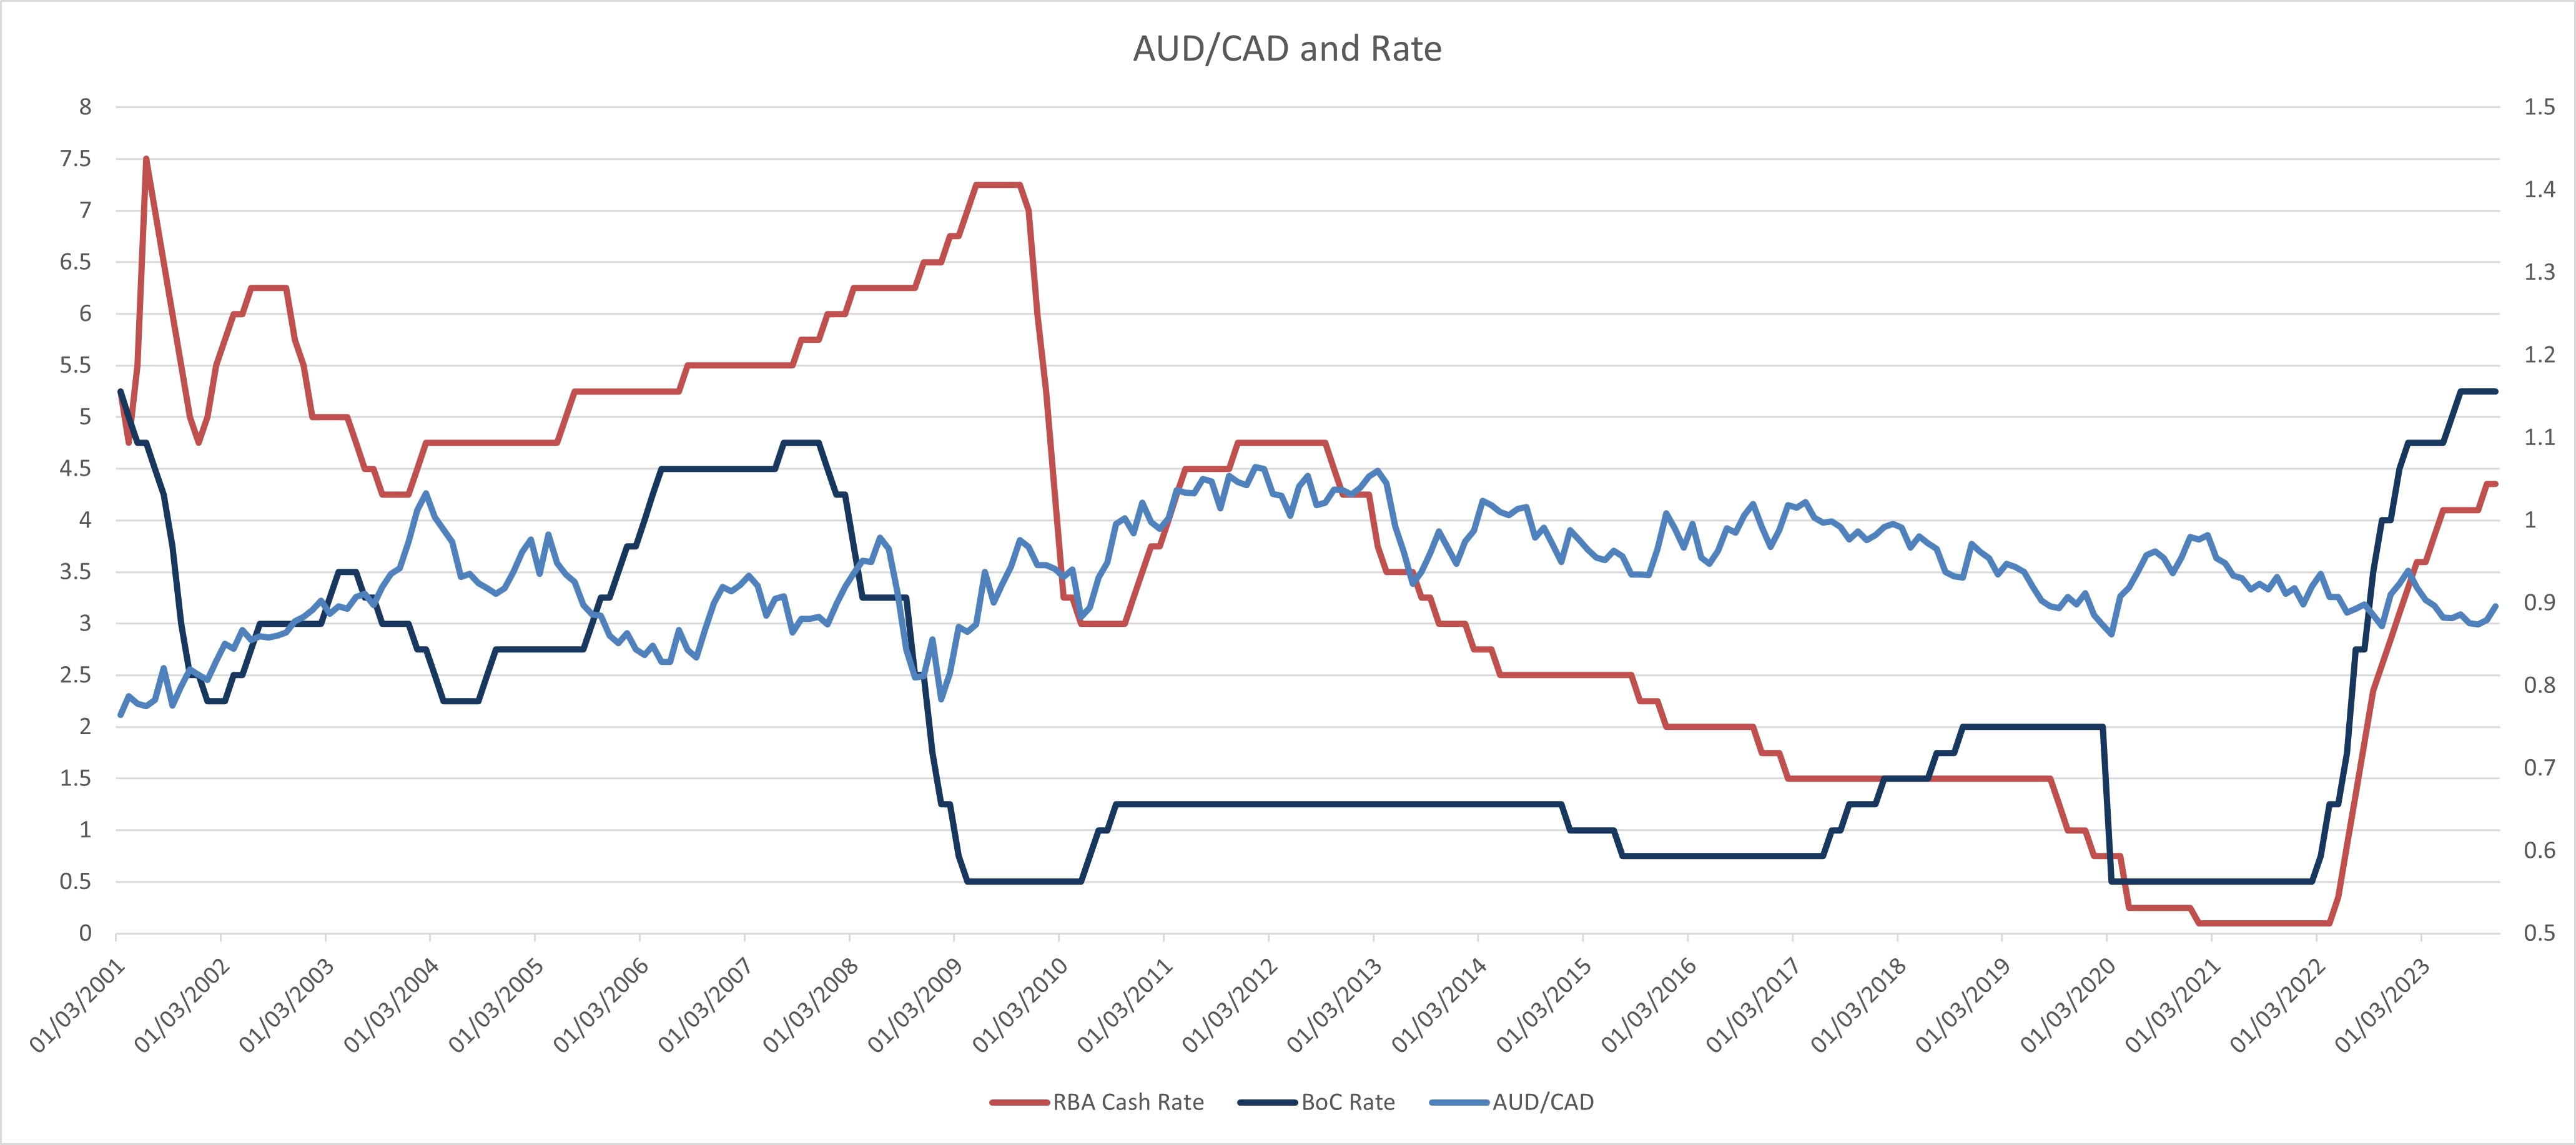
Figure 5 showed how the AUD/CAD perform with reference to both the RBA and BoC rates.
The RBA has been leading the BoC in rates from early 2001 to 2018. The BoC eased from 6% in December 2000 to 2.25% in March 2022 before going into a short tightening and easing cycle till August 2004. The next tightening cycle last three years till 4.75% in October 2007 and then ease till May 2010 to 0.5%. After a 75bps hike in the next quarter, the BoC kept rate at 1.25% for four years and ease by 50bps to 0.75% in June 2017. Thus, heading into tightening to 2% before COVID-19 easing happens in March 2020. The current tightening cycle began at March 2022 with rate potentially peaked at 5.25%.
The rate path between RBA and BoC are mostly different with occasional widening/narrowing of rate differential in the past two decades. The correlation between AUD/CAD performance and central bank rate seems to be weak before 2010. From 2010 afterwards, AUD/CAD is generality following the trend in yield differential but was not showing a strong correlation.
Figure 5.1: AUD/CAD Performance with reference to 2yr AU and CA Government bond Yields
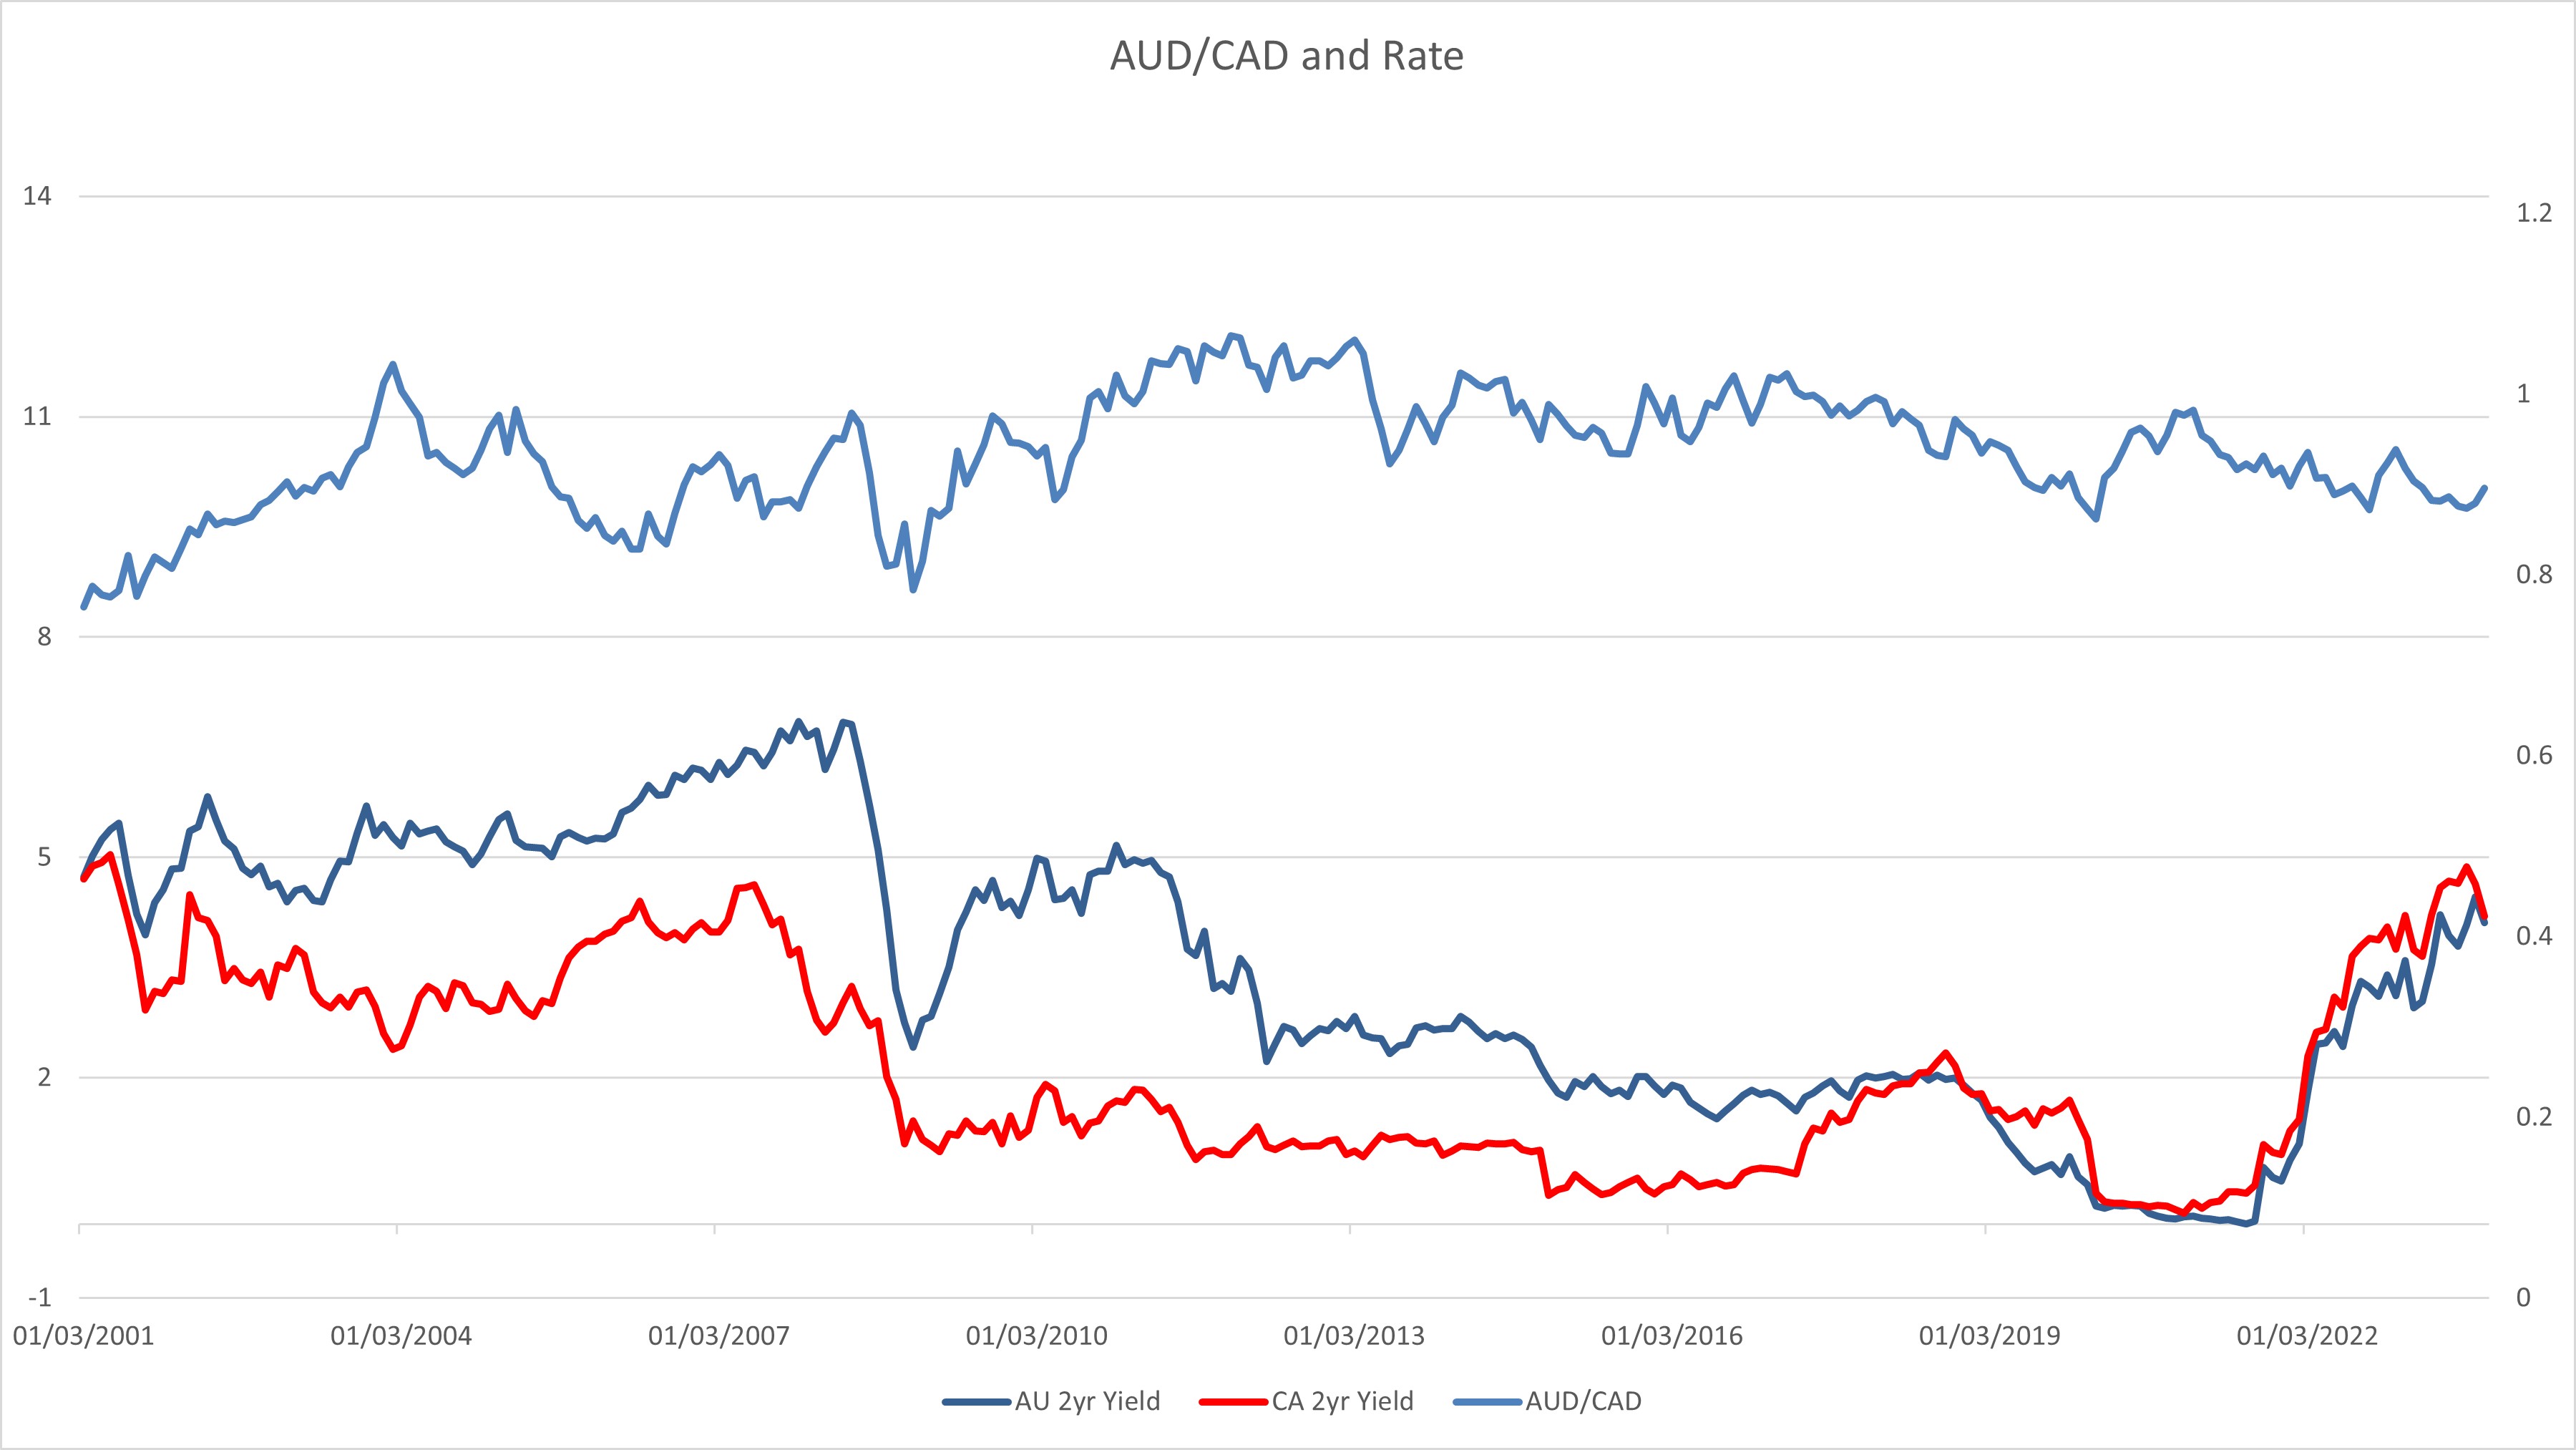
Figure 5.1 shows the AUD/CAD's performance along with changes in 2yr AU and CA Government bond Yields. The Canadian Government bond yields seems to mostly front running BoC rate decision when they are cutting and tracking closer when BoC is hiking.
The Australian yields are higher than Canadian counterpart from 2000 -2019 and the tables turned when BoC kept a higher rate than RBA since 2019. The yield differentials are the largest in 2004 and 2009 - 2012 at around 3%. AUD/CAD's appreciation closely track the widening of yield differential but seems to have a rather muted impact from it narrowing. The crossover after 2019 - 2020 did see the AUD/CAD to depreciate faster than average and widening of yield differential again in 2023 does not seem to have a strong correlation with AUD/CAD performance.
Figure 6: AUD/JPY Performance with reference to RBA and BoJ Rate
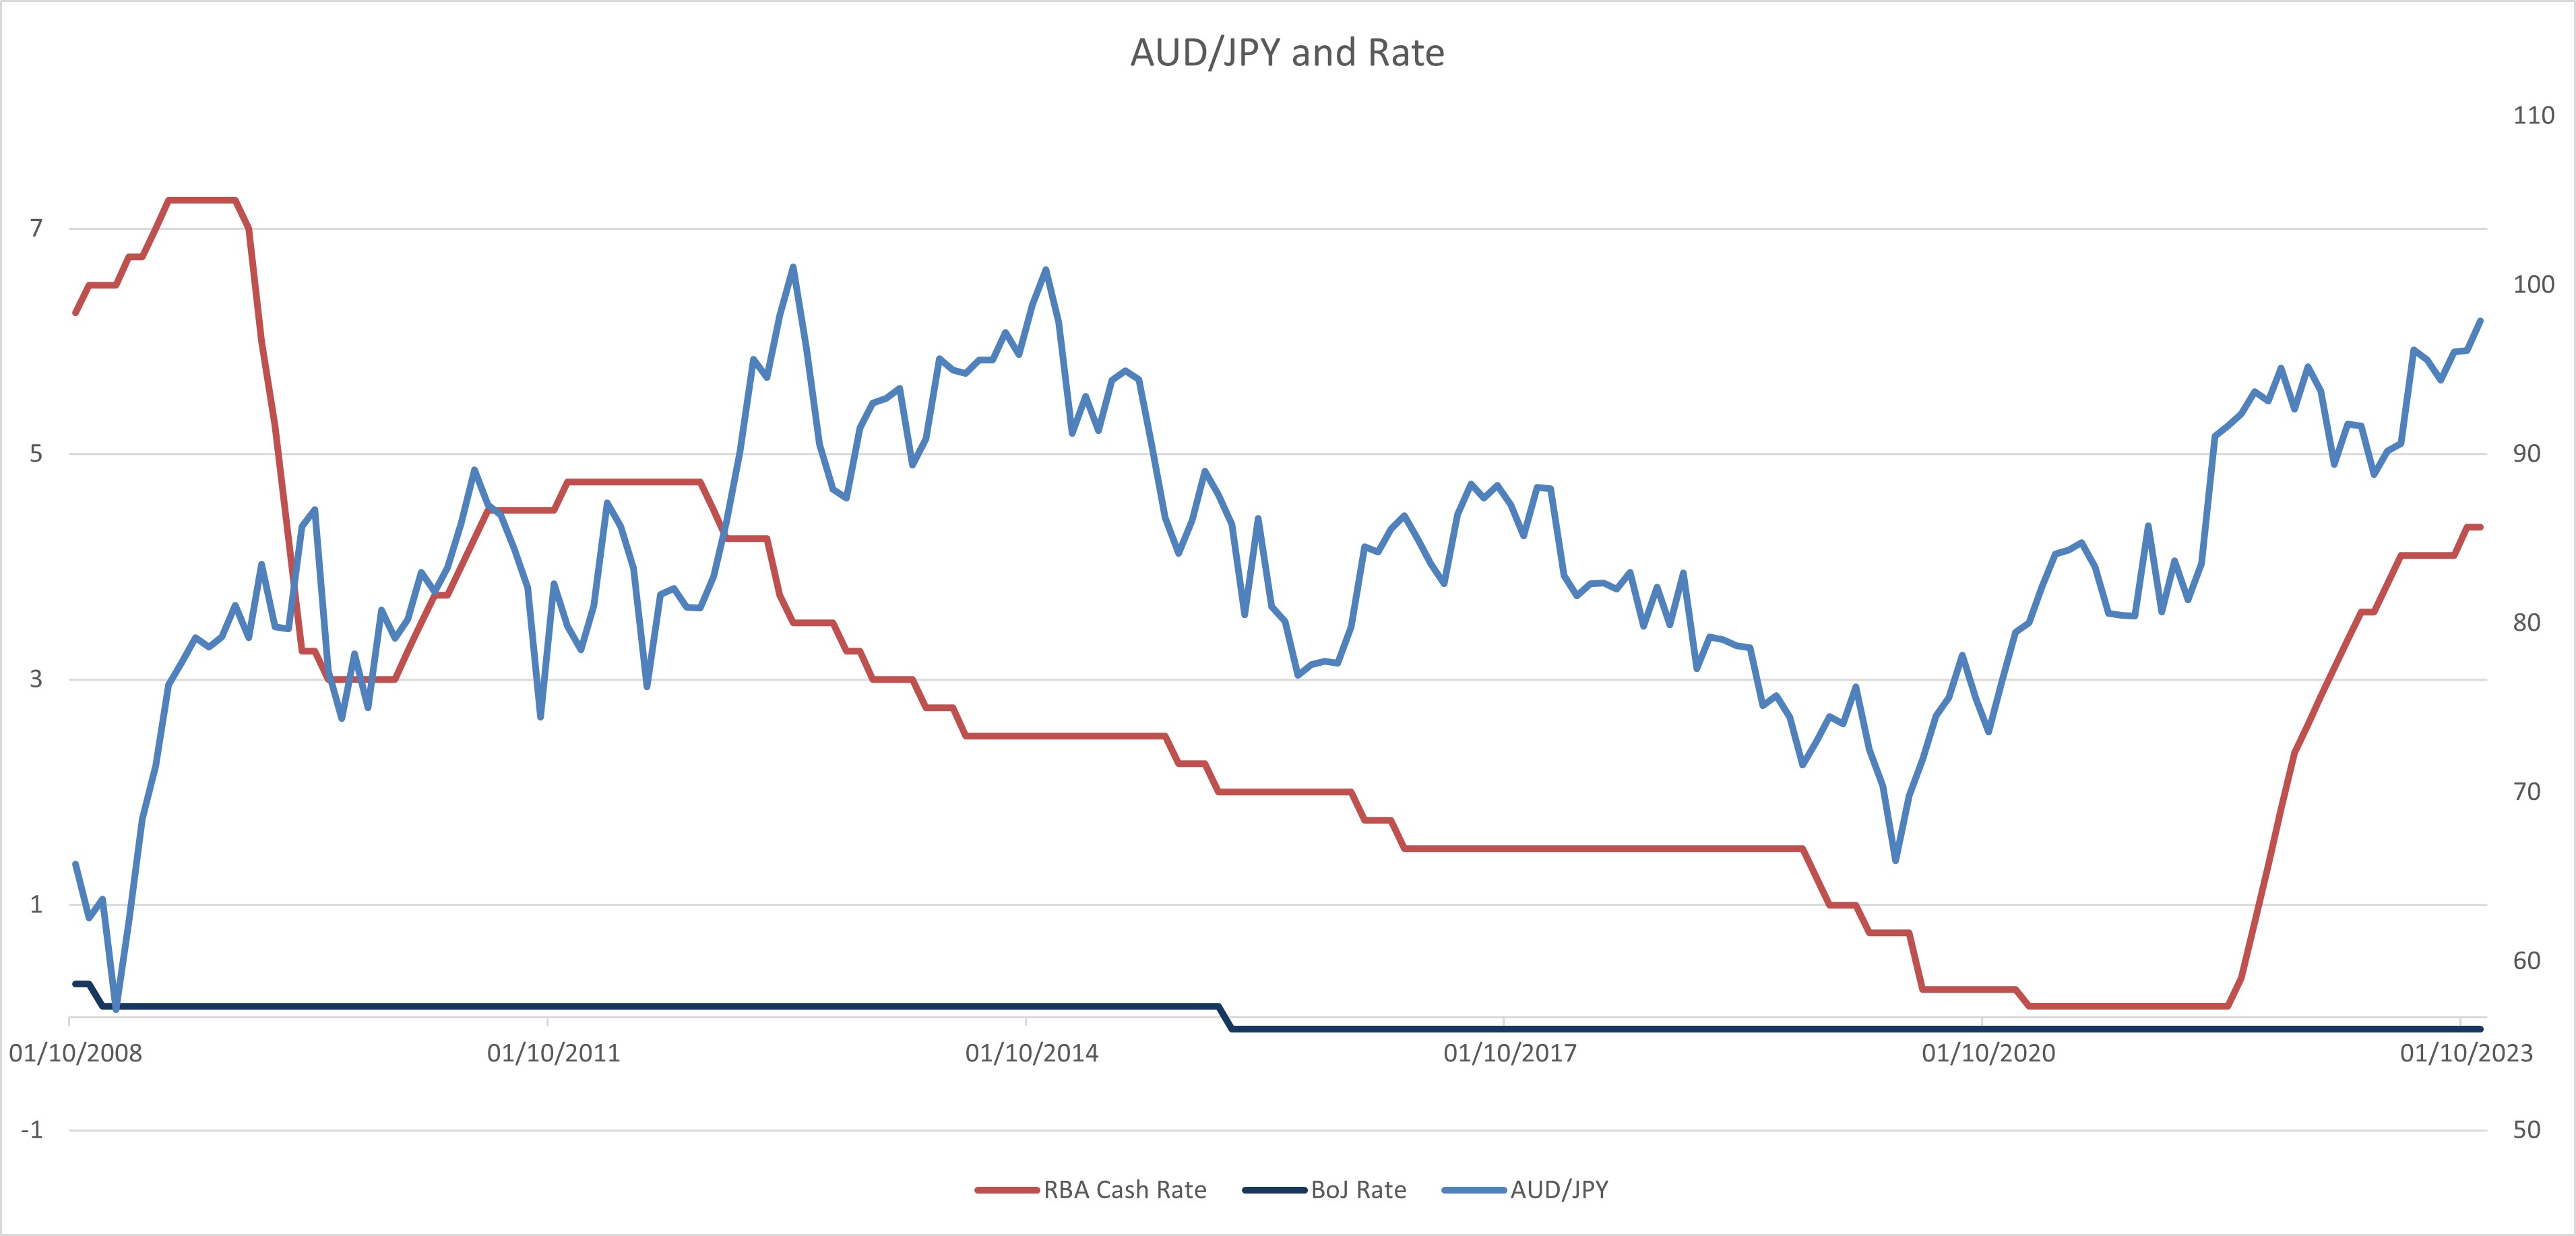
Figure 6 showed how the AUD/JPY perform with reference to both the RBA and BoJ rates.
BoJ's interest rate has been hovering between -0.1 to 0.1% since 2008 so the major factor in yield differential will be RBA rate changes. The major turning point is in January 2016 when the BoJ eased from 0.1% to -0.1% where we see a spike in AUD/JPY correspondingly.
As BoJ's interest rate decision are much less dynamic than other central banks and thus AUD/JPY market participants reacts more aggressively towards RBA rate cycle changes. We can see AUD/JPY significantly strengthens after the BoJ cut rate in 2008 and before RBA cut in 2009 and rebound in 2010 when RBA resumes tightening. And from 2012-2023, AUD/JPY follows the trend in rate differential between BoJ and RBA.
Figure 6.1: AUD/JPY Performance with reference to 2yr AU and JP Government bond Yields
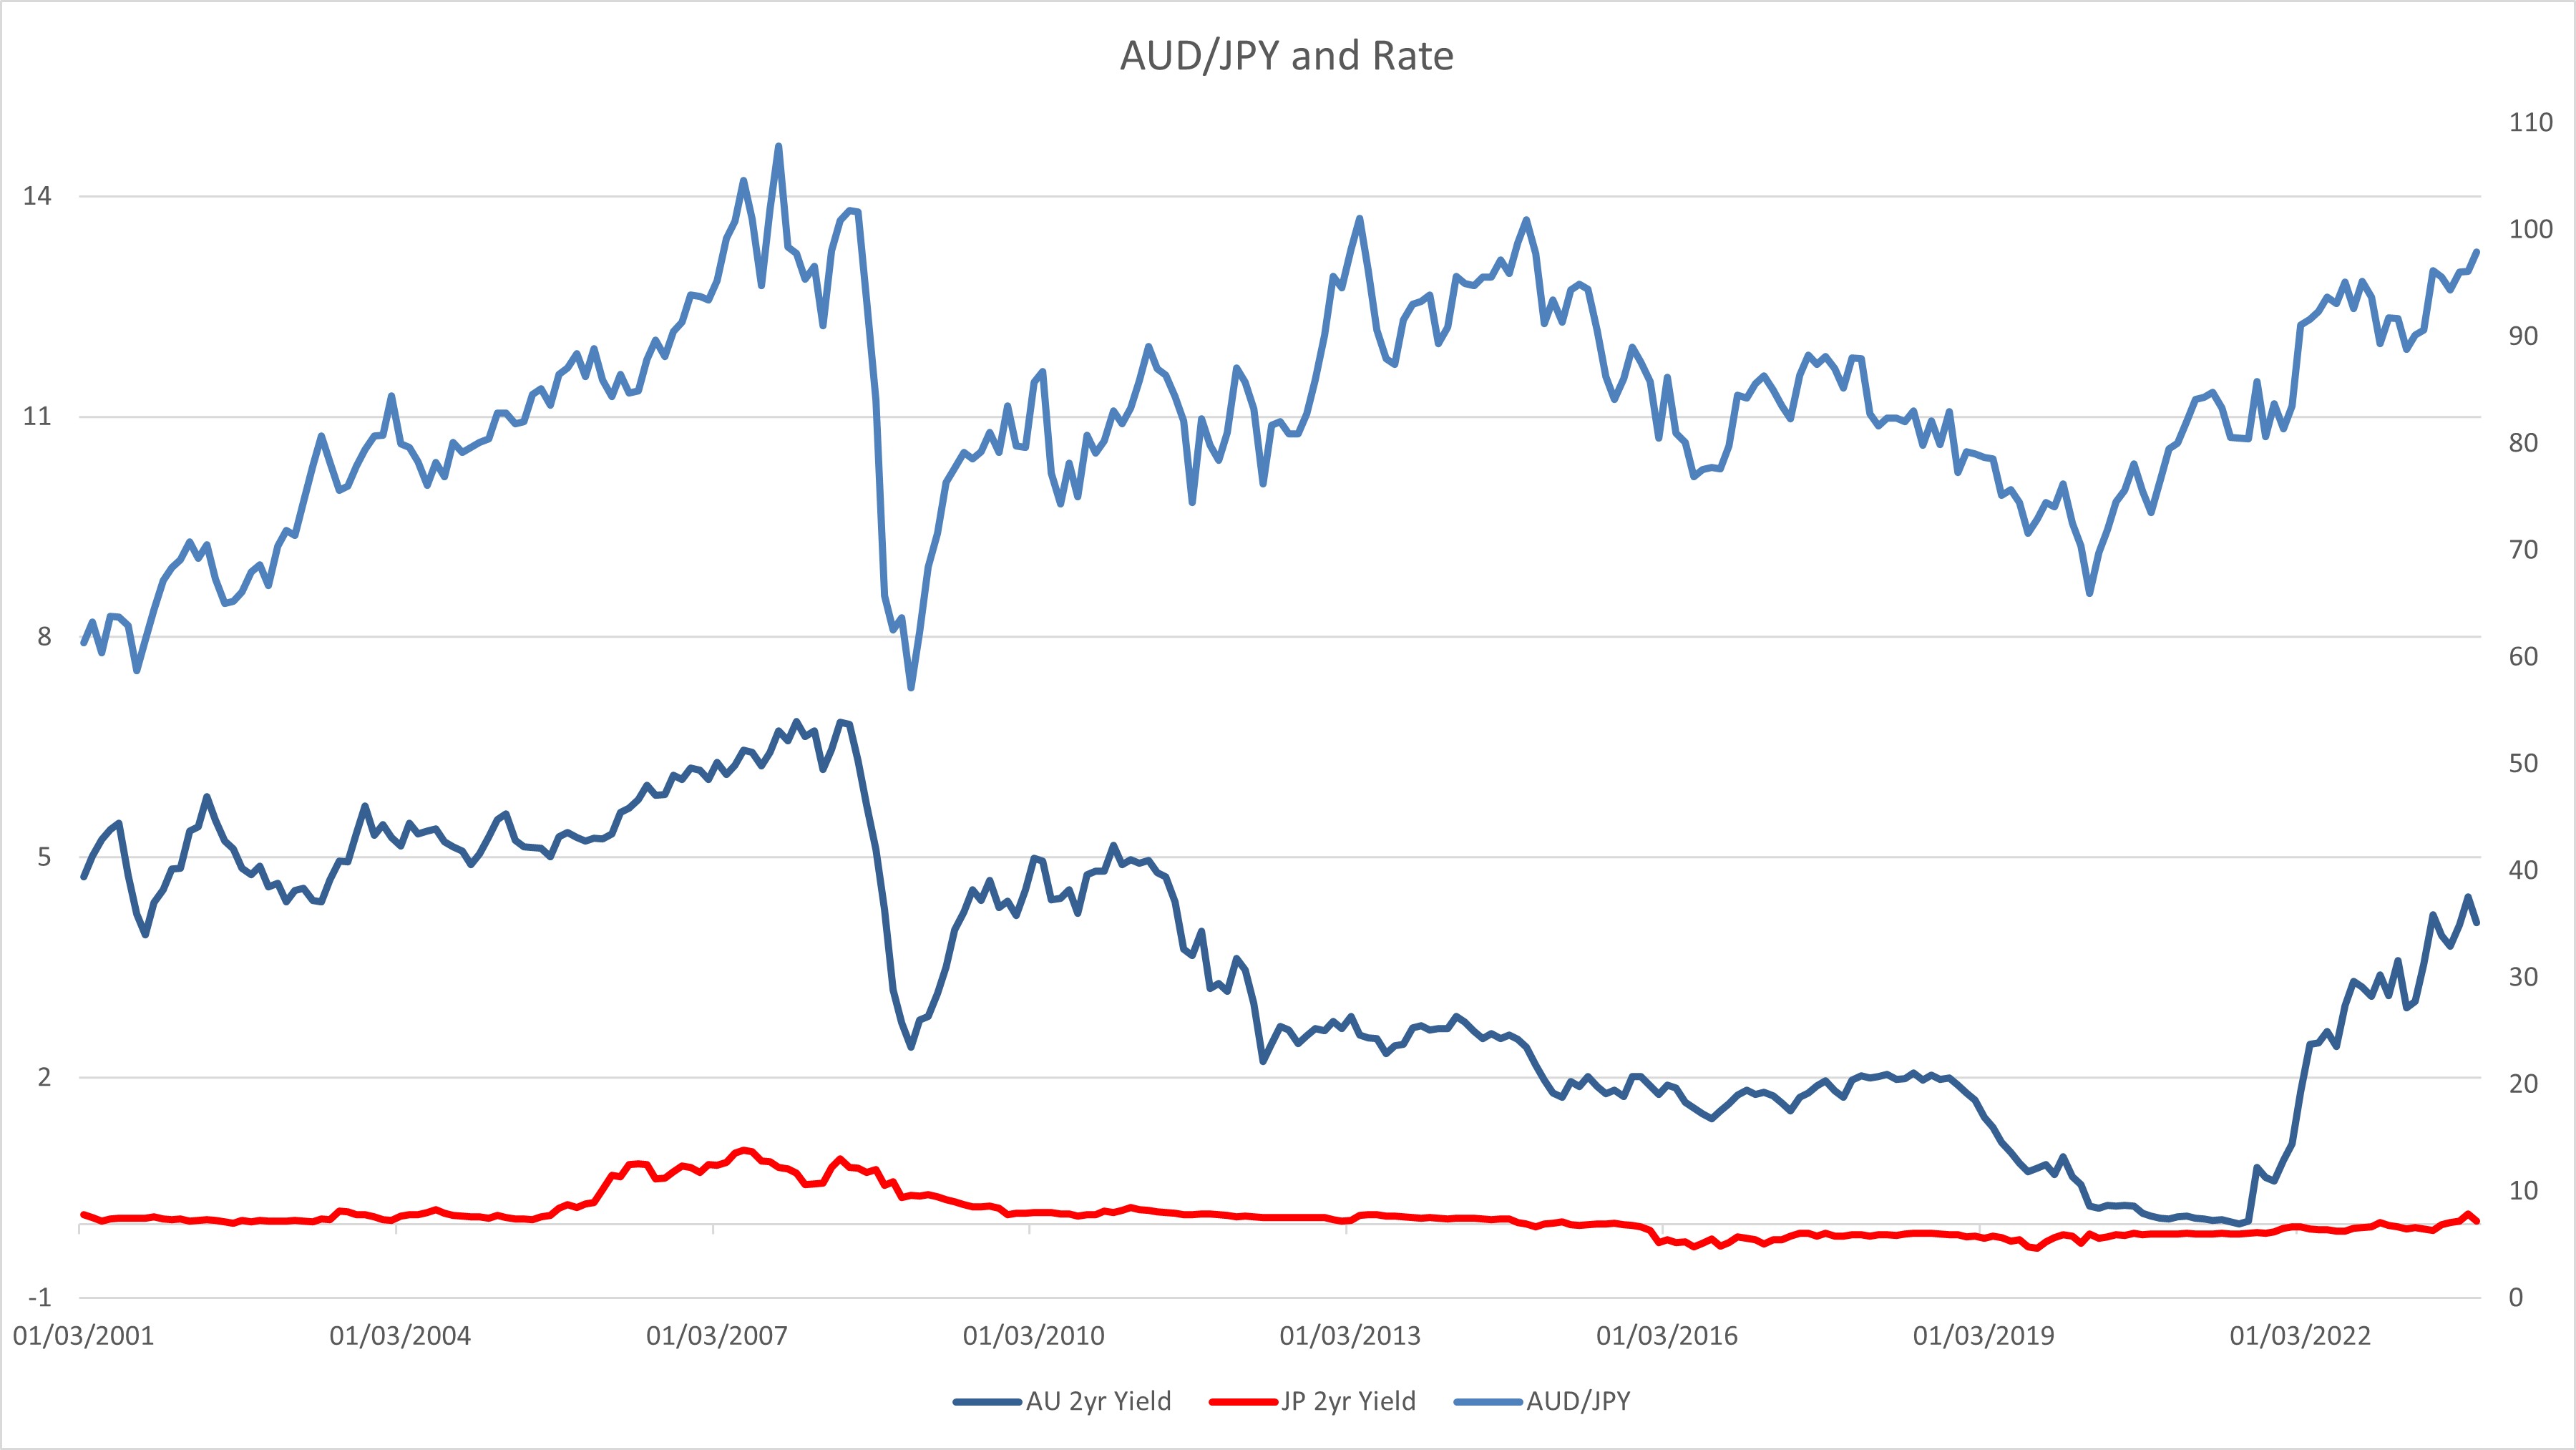
Figure 6.1 shows the AUD/JPY's performance along with changes in 2yr AU and JP Government bond Yields. The Japan government yields tracks closely to BoJ's rate decision in a way that is visible to see how bond market participants anticipate the changes in BoJ rate given their forward guidance.
Despite the JP government bond yields being rather low, there are time when yield differentials significantly change, for example in 2008 which see the yield changes slightly front run the slump in AUD/JPY. However, even when yield differential began to narrow in 2010 - 2022, it does not seem to have a long term impact until 2015. While we see a similar pattern on the chart, yields does not seem to be a good guide towards AUD/JPY performance.
Figure 7: AUD/CHF Performance with reference to RBA and SNB Rate
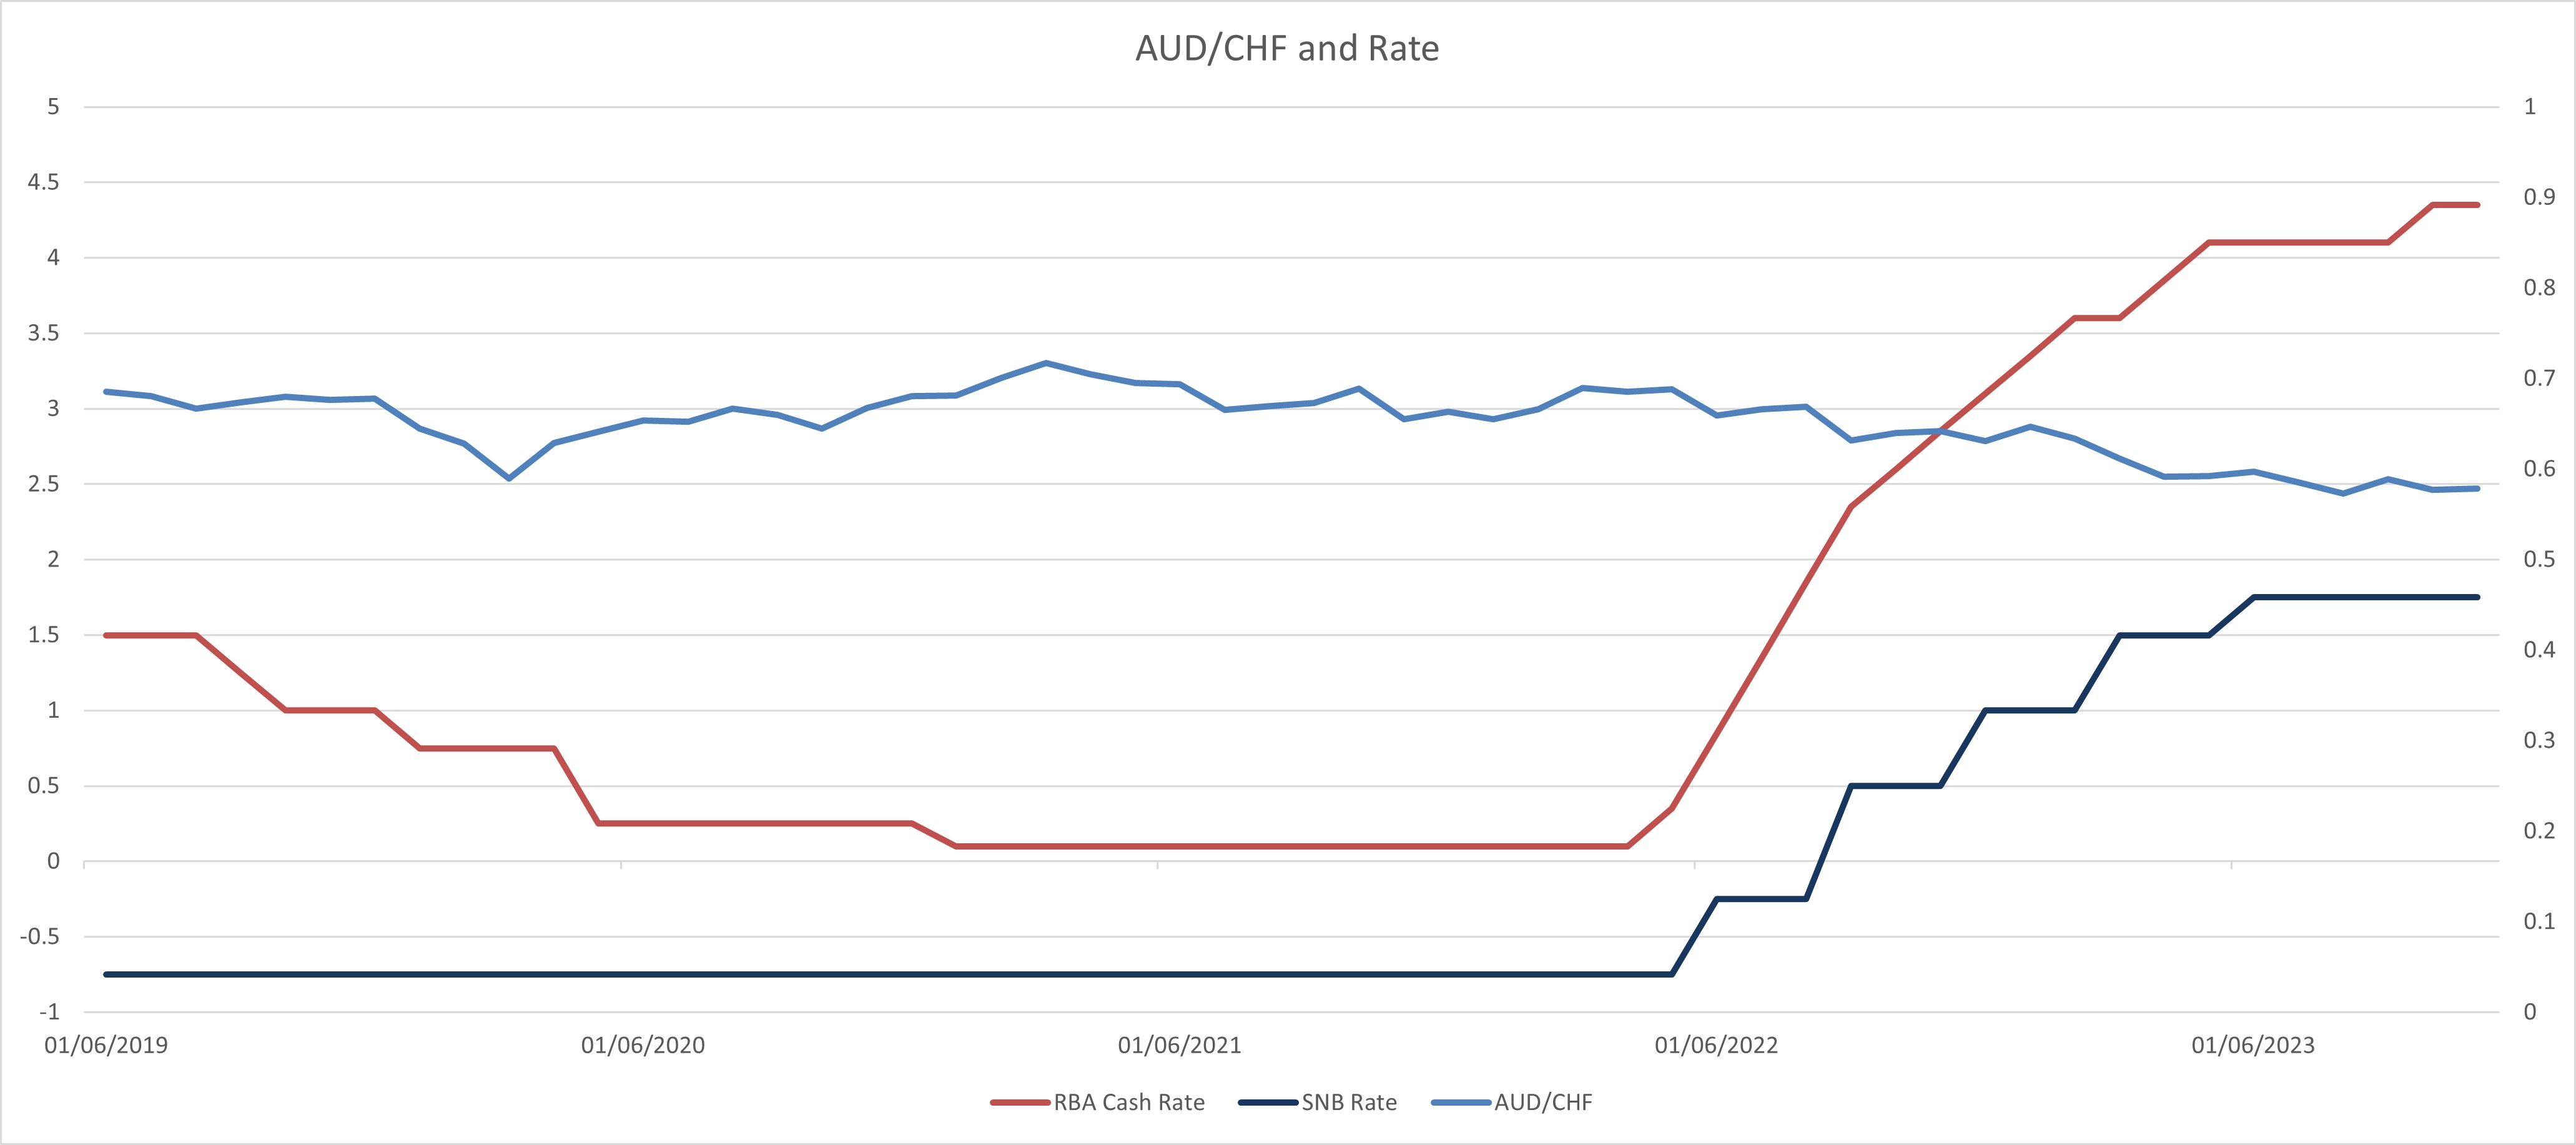
Figure 7 showed how the AUD/CHF perform with reference to both the RBA and SNB rates.
The SNB is another central bank taking a similar policy like the BoJ after 2008. After a dynamic 2000-2008, the SND kept rate from 0.25% to -0.75% from 2009 to 2022. It is only after global central banks tightening after the COVID-19 easing we see the SNB began tightening and seems to have paused at 1.75%.
Given the unique status of the Swiss France in global affairs, the AUD/CHF had performed mostly along rate changes except at years of major macroeconomics event. However, it is also clear the correlation is not very strong between the Aussie and Franc.
Figure 7.1: AUD/CHF Performance with reference to 2yr AU and Swiss Government bond Yields
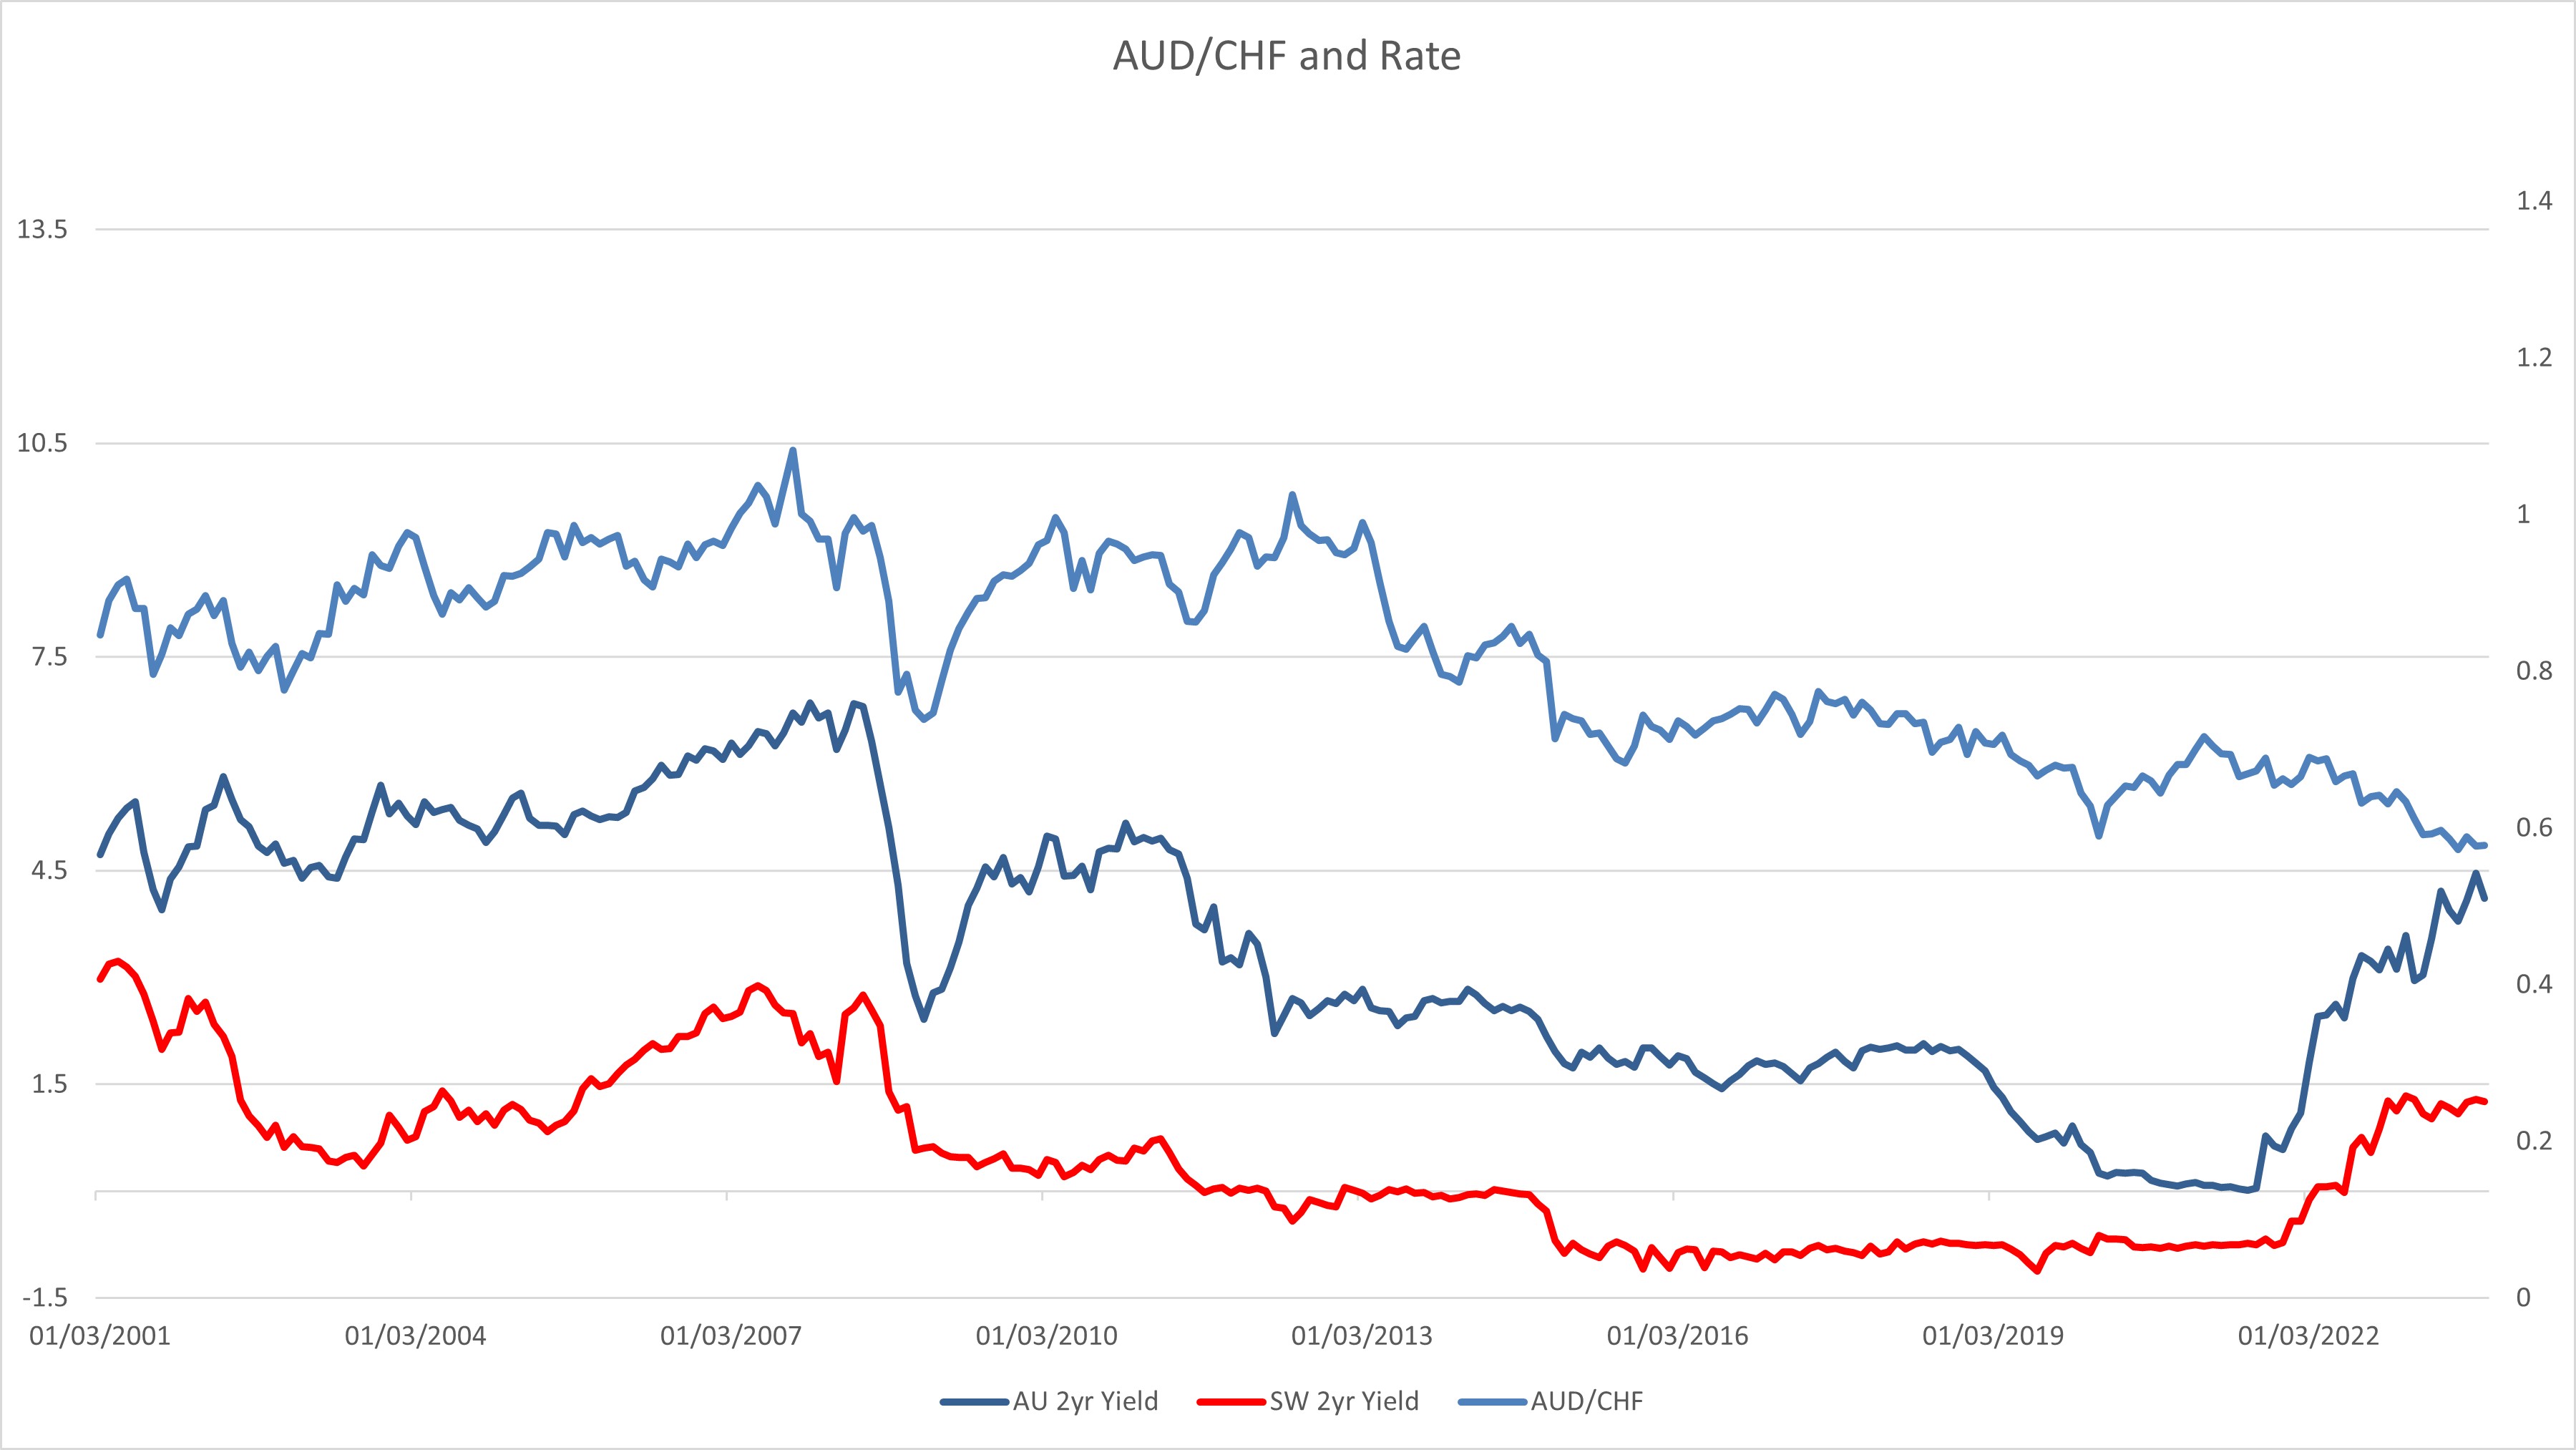
Figure 7.1 shows the AUD/CHF 's performance along with changes in 2yr AU and Swiss Government bond Yields.
The Australian yield always lead the Swiss yield for the past two decades. The yield differential is steady (AU 2-2.5% higher) from 2000 - 2008, narrowed sharply in 2009, back to average from 2010 - 2012 and has been narrowing from there to 2022, when the yield differential began to widen again. AUD/CHF tracks those yield movement from 2000 - 2022 but does not seem to be following the move after 2022 yet.
It shows that the correlation among Aussie's performance against major currencies and rates & yield do exist to a different extent. The performance of Australian Dollar against major seems to be generally tracking yield differential better than central bank rate changes except against JPY and CHF. From a medium term trend perspective, both the rate and yield differentials demonstrate clear correlation with AUD / Major Currency performance yet such correlation will weaken in sight of macroeconomic event (GFC). The relationship is the strongest between AUD/USD and its yield differential and seems to be the weakest with AUD/JPY. A more statistical approach will be illustrated in the final chapter.
In the next chapter, we will be looking into the correlation between the Aussie and commodities.
