German Data Preview (Oct 30): Inflation Stays Under Target?
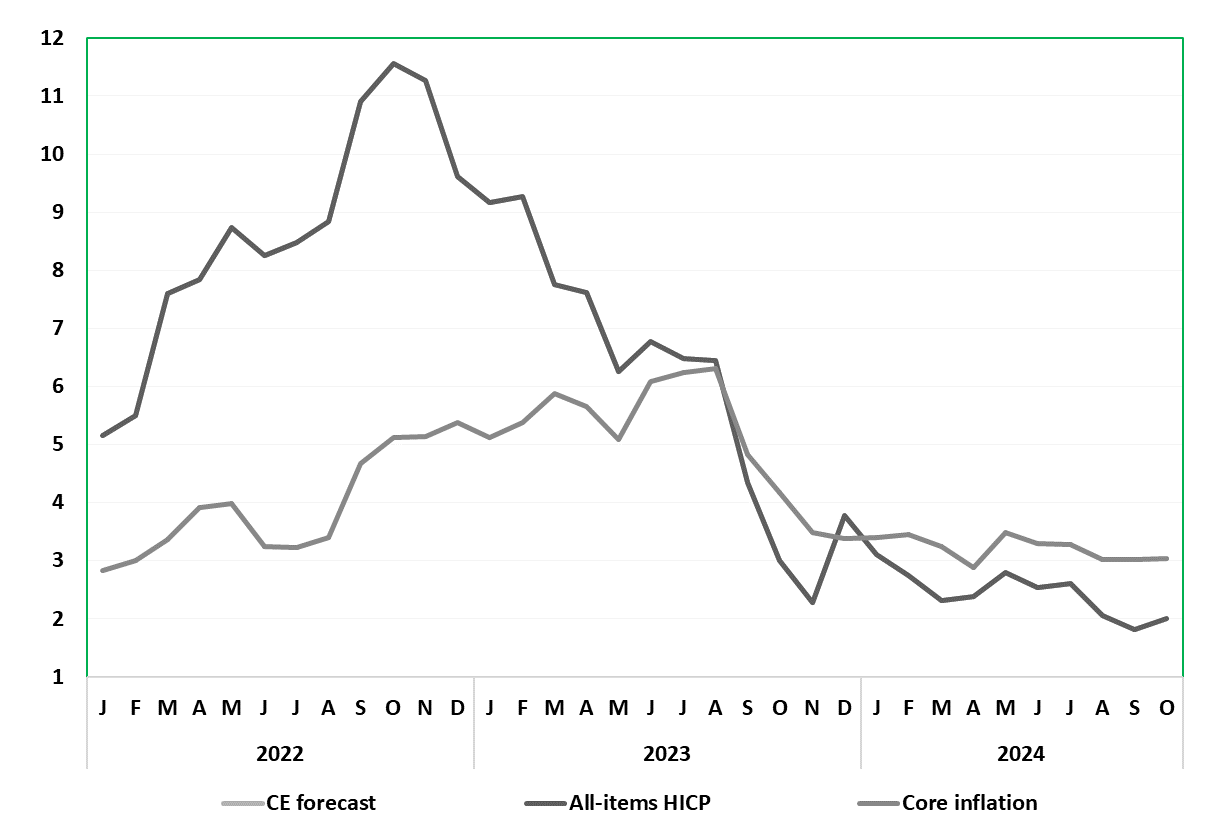
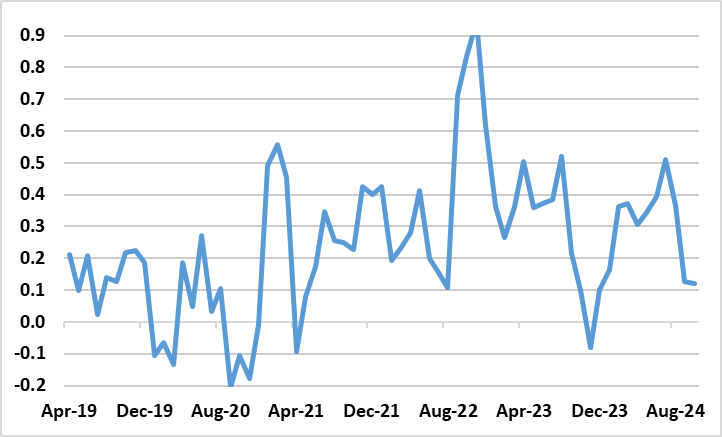
Germany’s disinflation process continues. After July saw the headline HICP rate rise and unexpected 0.1 ppt to 2.6%, unwinding a third of fall seen in June, it plummeted this month to a 41-month low of 2.0% in August, and then down to 1.8% last month, below the ECB target and well below expectations. This in spite of apparently stable or resilient services inflation. We see energy related base effects and possible fuel price rises taking the headline up a notch to 1.9% (Figure 1), but with a stable core but where a slowing in the latter has been increasing evident (Figure 2).
Figure 1: Inflation Under Target?

Source: German Federal Stats Office, CE, % chg y/y
While a further rise in the next few months beckons, again due to energy base effects, survey data are pointing not only to more real economy weakness but significant falls in cost and output price pressures.
September HICP details show stable services but with more negative energy and slightly higher food inflation all consistent with the core rate having stayed at 3.0%.
Figure 2: Adjusted Core Rate Falling Afresh?

Source: German Federal Stats Office, CE, % chg m/m adjusted and smoothed
Indeed, in terms of PMI messages, the September survey noted a considerable softening of cost pressures across the German private sector. Input price increases in the service sector slowed notably to the weakest in over three-and-a-half years and only just exceeded the long-run average seen before the pandemic. Manufacturing purchasing costs meanwhile fell at the quickest rate for six months, driven down by weaker demand for inputs and lower commodity prices, particularly steel. Similarly, a slower rise in service sector output prices – the weakest since April 2021 – was seen alongside a solid and accelerated reduction in factory gate charges. Measured across the two sectors combined, the rate of output price inflation was at a 44-month low and broadly in line with the pre-pandemic trend. Such signs echo the softer signs seen in adjusted HICP terms suggested the core is back around, if not below, circa-target strength (Figure 2).