The Aussie Chapter 3: Risk
In "The Aussie", we will look into the "well-known "correlation among the Aussie and well-known benchmark to give our readers a closer look towards factors that have been affecting the movement of the Australian Dollar. In Chapter 3, we will look into the performance of the Aussie against major equity indexes.
In this chapter, we will look into AUD/USD's performance against benchmark indexes in Australia, China, Hong Kong and U.S.. These indexes are picked by their market size, economic proximity or effect towards broad risk sentiment. We have picked MSCI Australia, S&P/ASX, SHCOMP, MSCI China, HSI, S&P 500, Dow Jones and NASDAQ.
Figure 1: AUD/USD and MSCI Australia
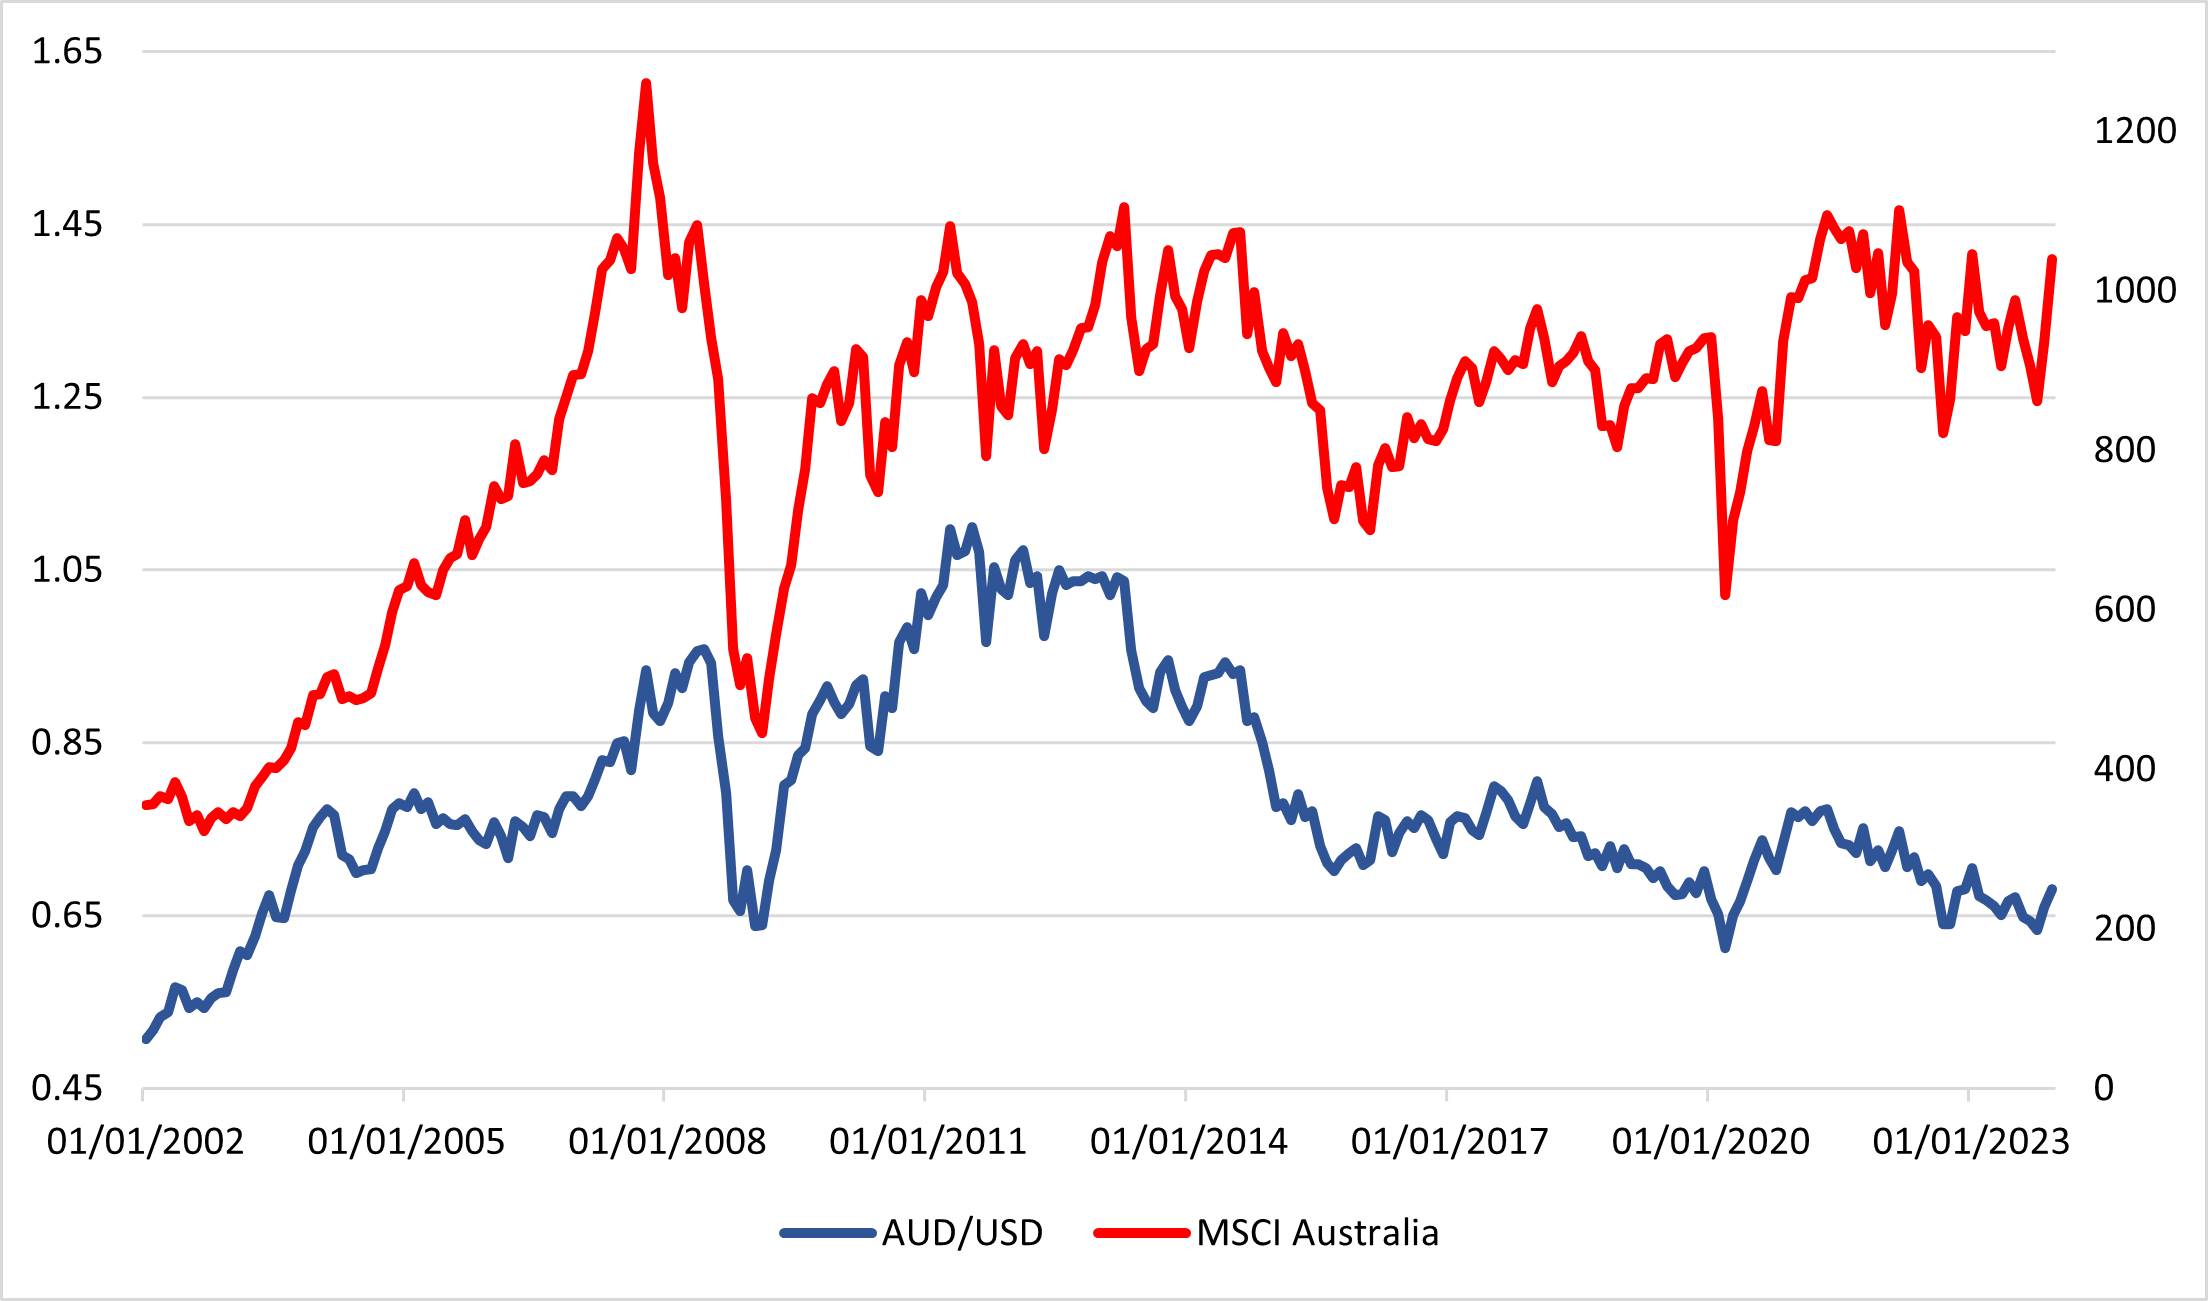
Figure 1 shows the performance of AUD/USD and MSCI Australia, a common benchmark index covering mid-large enterprise.
The performance of MSCI Australia and AUD/USD is mostly identical as we see not only the trends are similar, major dips and rally mirrors each another. It make sense as more interest in Australian equities means more demand for the currency to purchase. Aprt from the magnitude, one could see both asset are mirroring each other, expect for a short period of time in 2013 where we see MSCI Australia reached higher than the peak in 2011.
Figure 2: AUD/USD and S&P/ASX
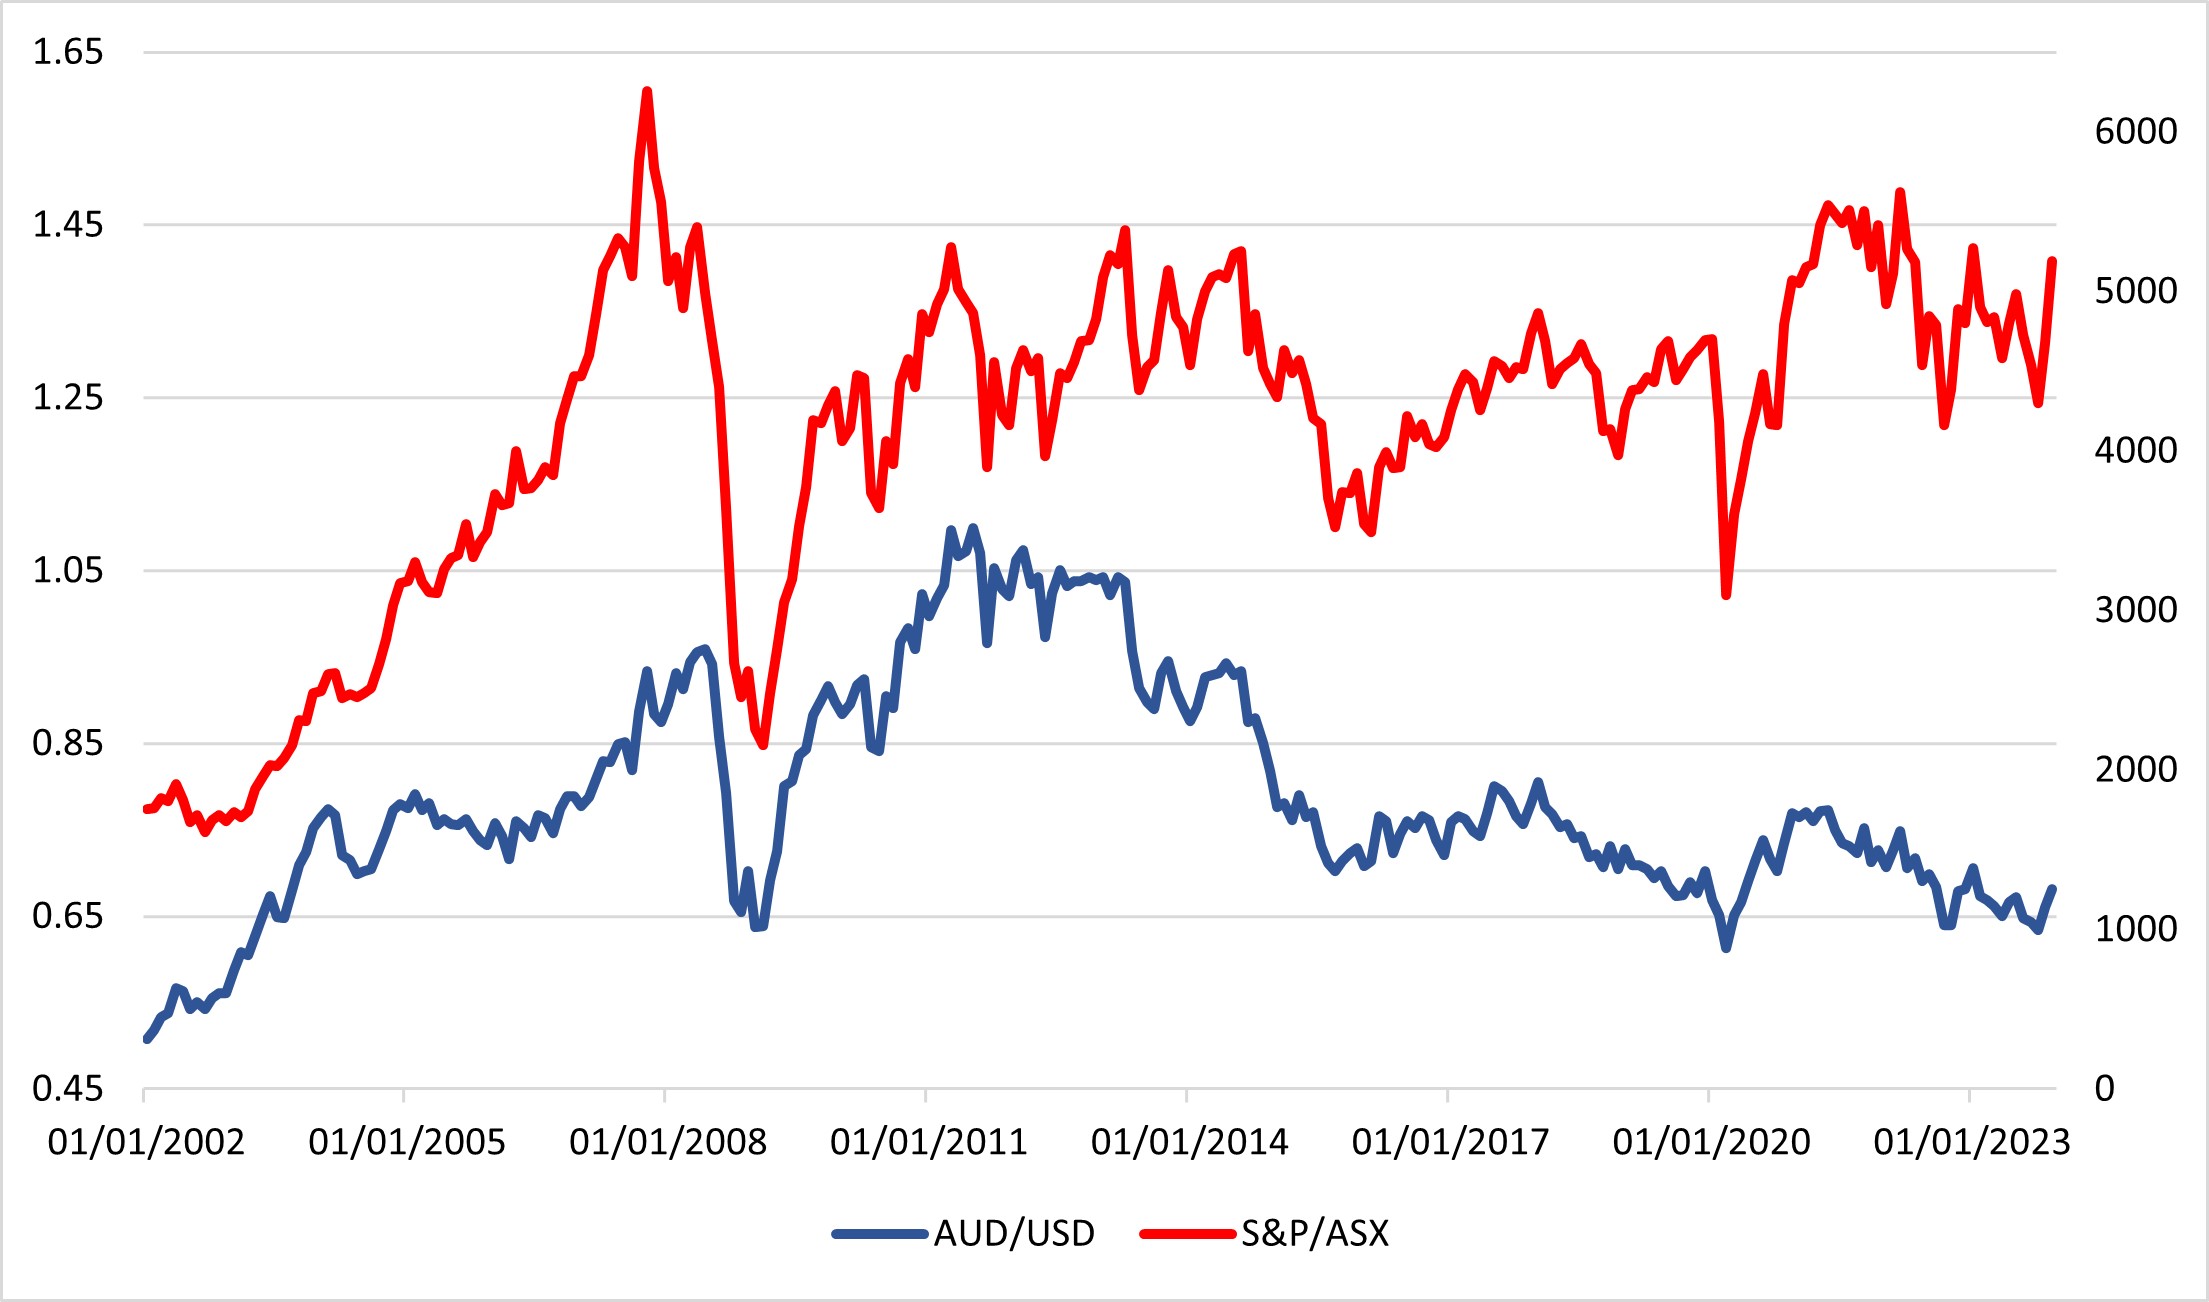
Figure 2 shows the performance of AUD/USD and S&P/ASX, a benchmark index composed of the 200 largest enterprise listed in Australia .
Once again, as the S&P/ASX is tracking Australian equities, we can see another identical similarity between the performance of AUD/USD and S&P/ASX expect for a short period of time in 2013 where we see S&P/ASX moved higher than the peak in 2011.
Figure 3: AUD/USD and Shcomp
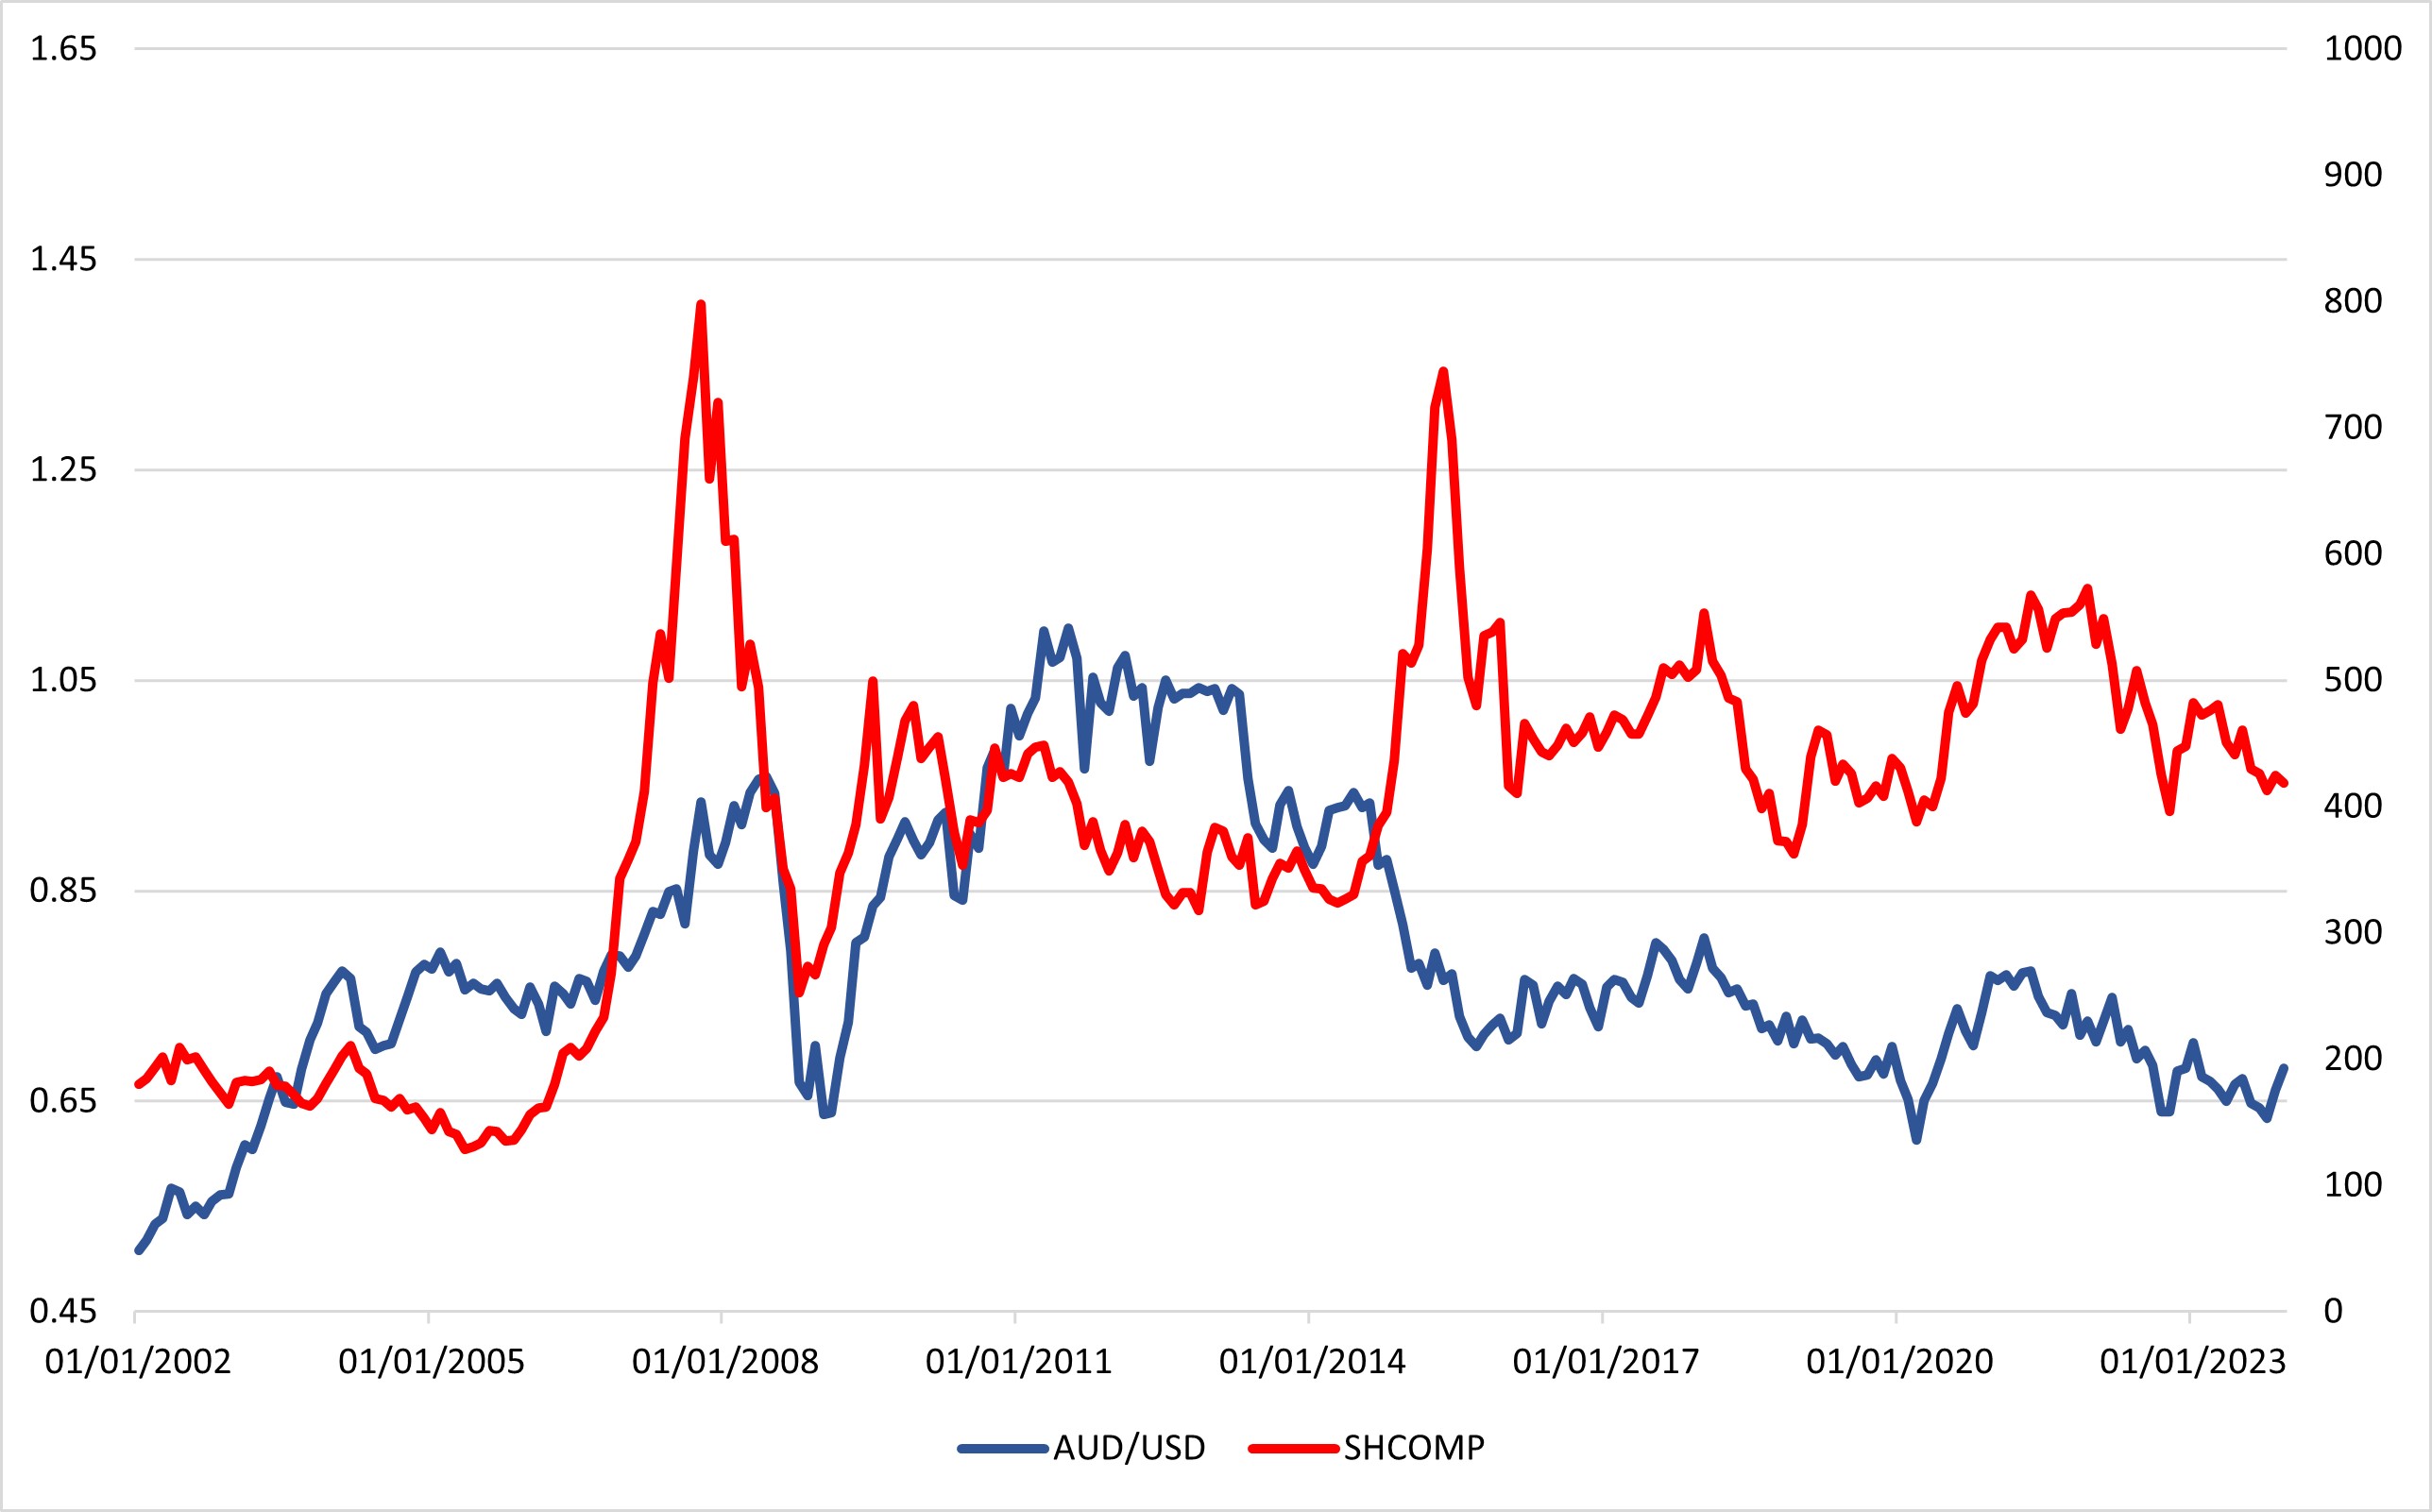
Figure 3 shows the performance of AUD/USD and SHCOMP.
The Shanghai Stock Exchange Composite Index includes 1177 stocks and indicates the overall sentiment of those traded in the Shanghai Stock Exchange. As one of the largest trading partner with Australia, the performance of Chinese equities should have a certain level of correlation to Australian economic activities.
The correlation between the performance of AUD/USD and SHCOMP is visibly weaker than with Australian equities. While we see the broader trend shows a level of correlation, there is clear evidence that the magnitude of which is a clear difference. The difference is especially visual in times of market crunch, for example in 2007 and 2015. The correlation is also weak with only decent correlation in 2011 - 2014 and after 2016.
Figure 4: AUD/USD and MSCI China
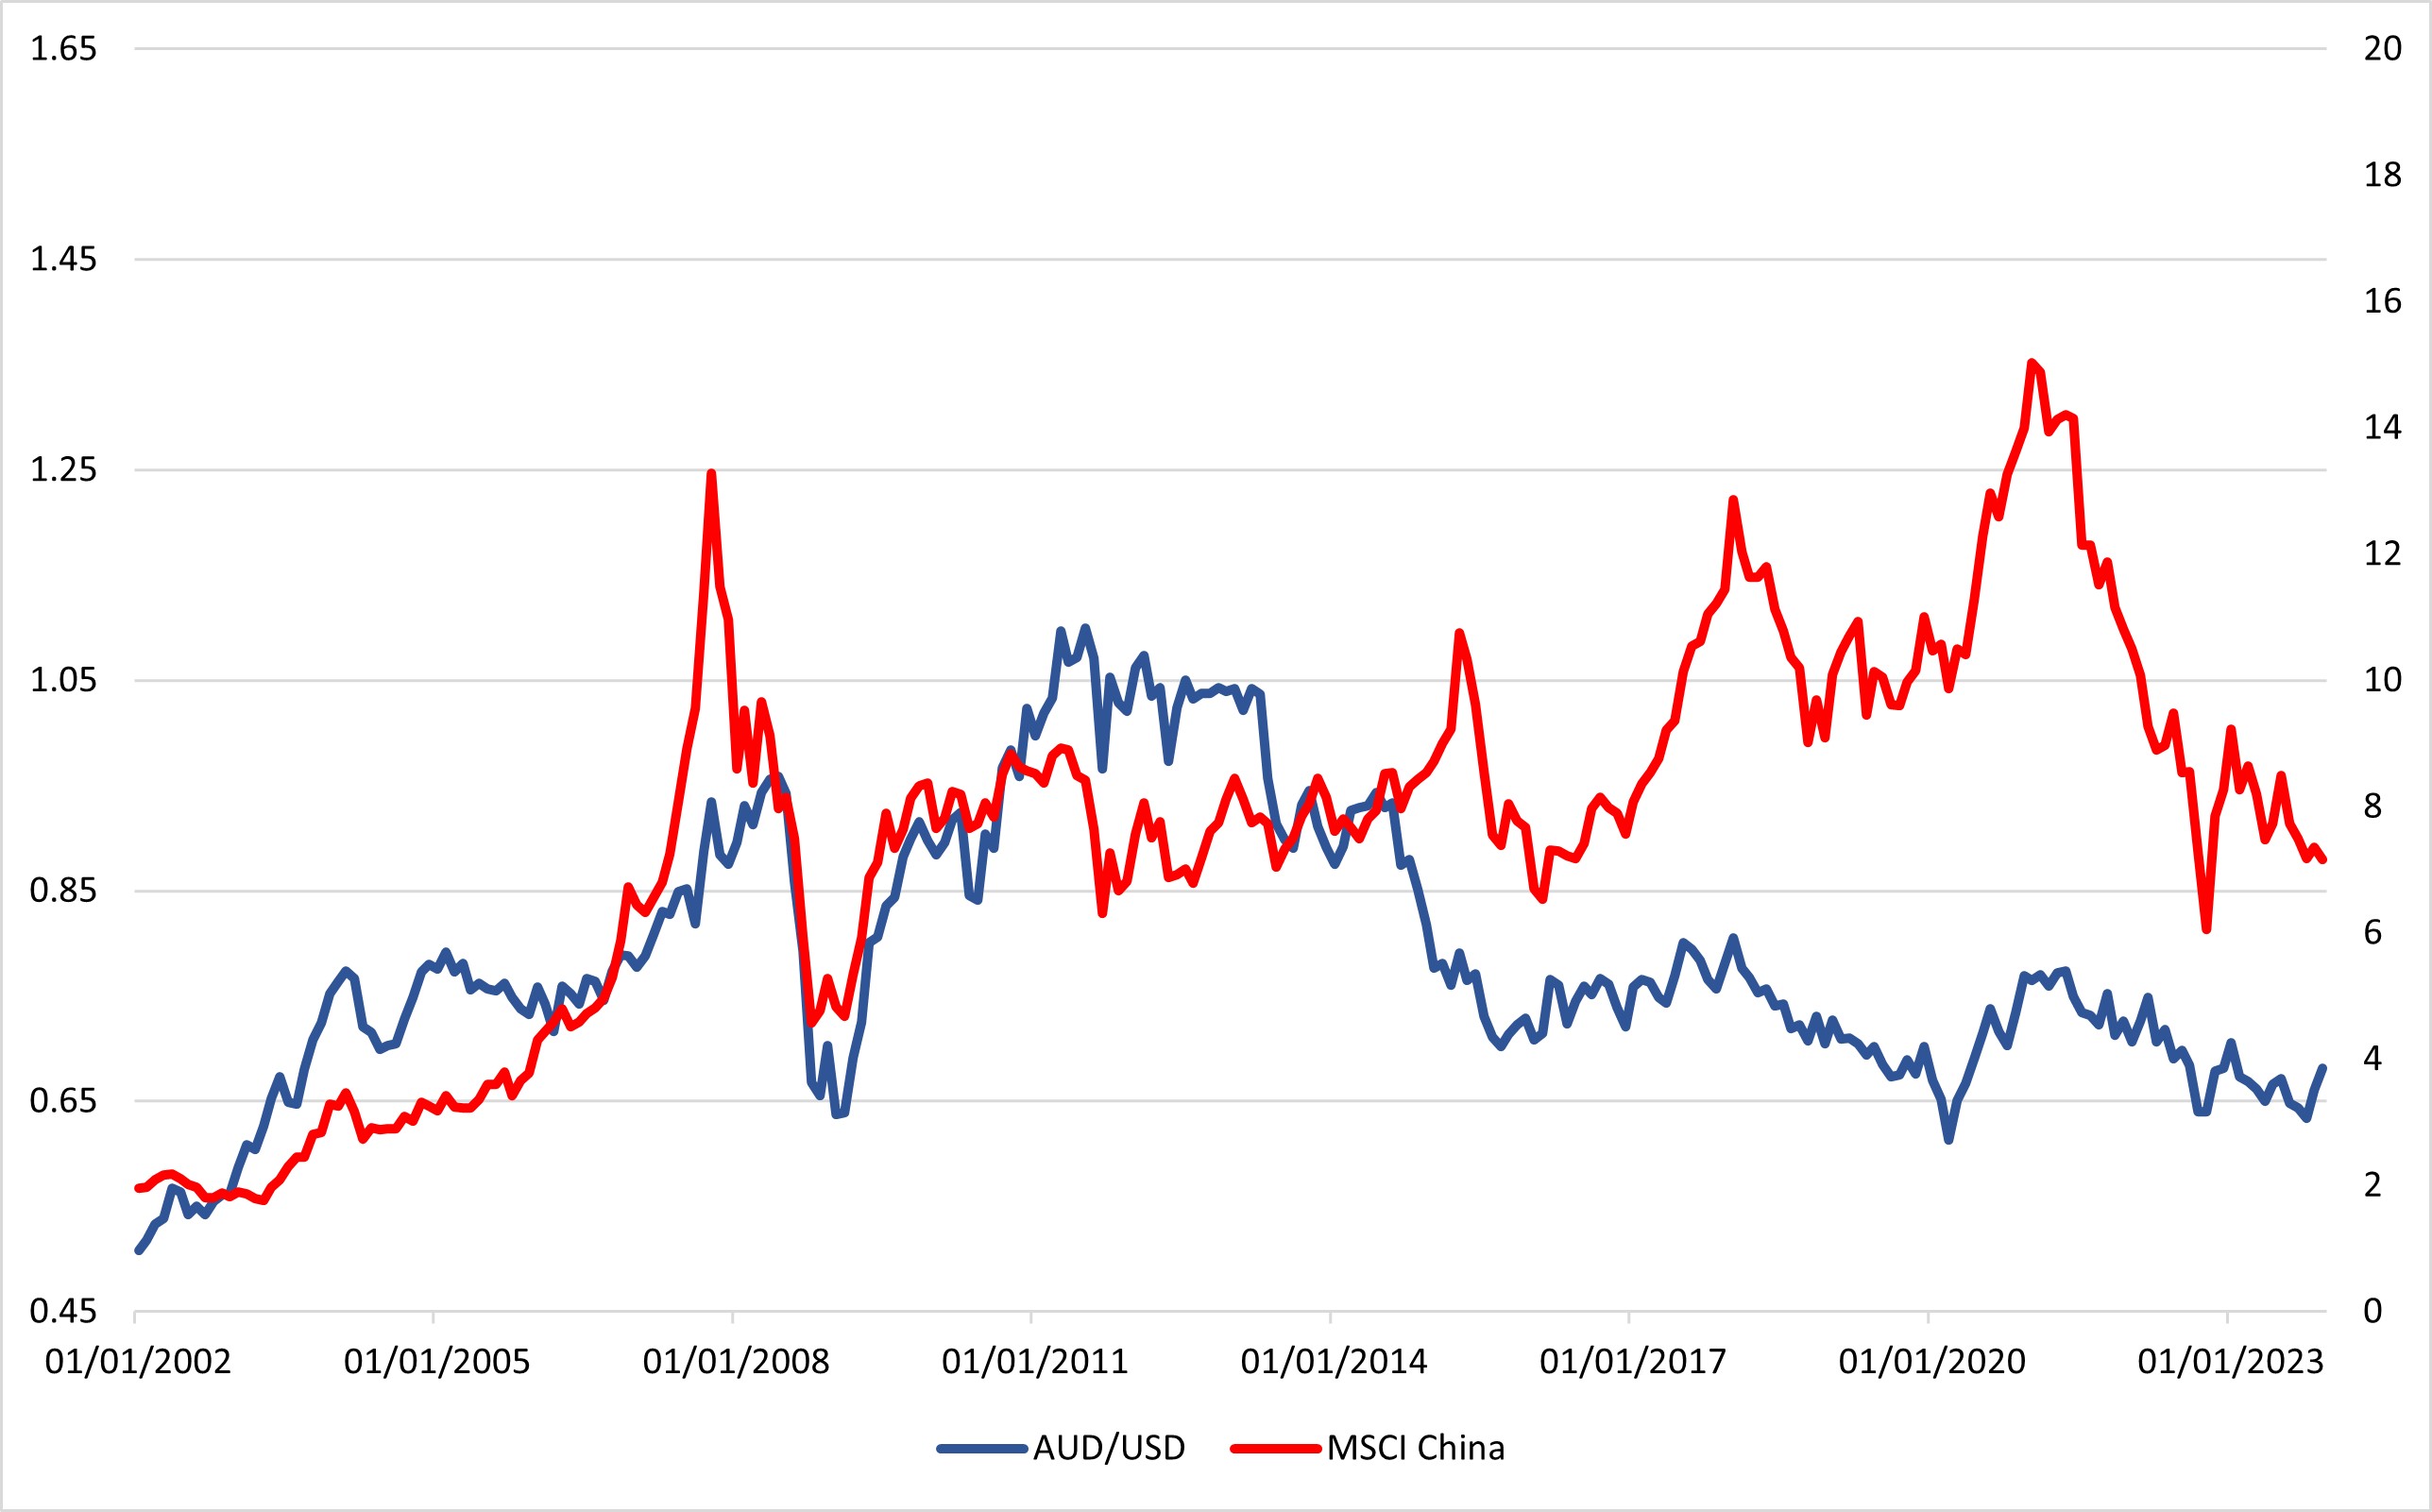
Figure 3 shows the performance of AUD/USD and MSCI China.
The MSCI China captures 703 large and mid cap representation across China A shares, H shares, B shares, Red chips, P chips and foreign listings. It provides a better coverage in terms of type of Chinese equities than SHCOMP.
The correlation between MSCI CHina is stronger than SHCOMP but weaker than Australian equities. The correlation is fairly decent pre-2014 and post 2016, with occasional spike in market boom or bane.
Figure 4: AUD/USD and HSI
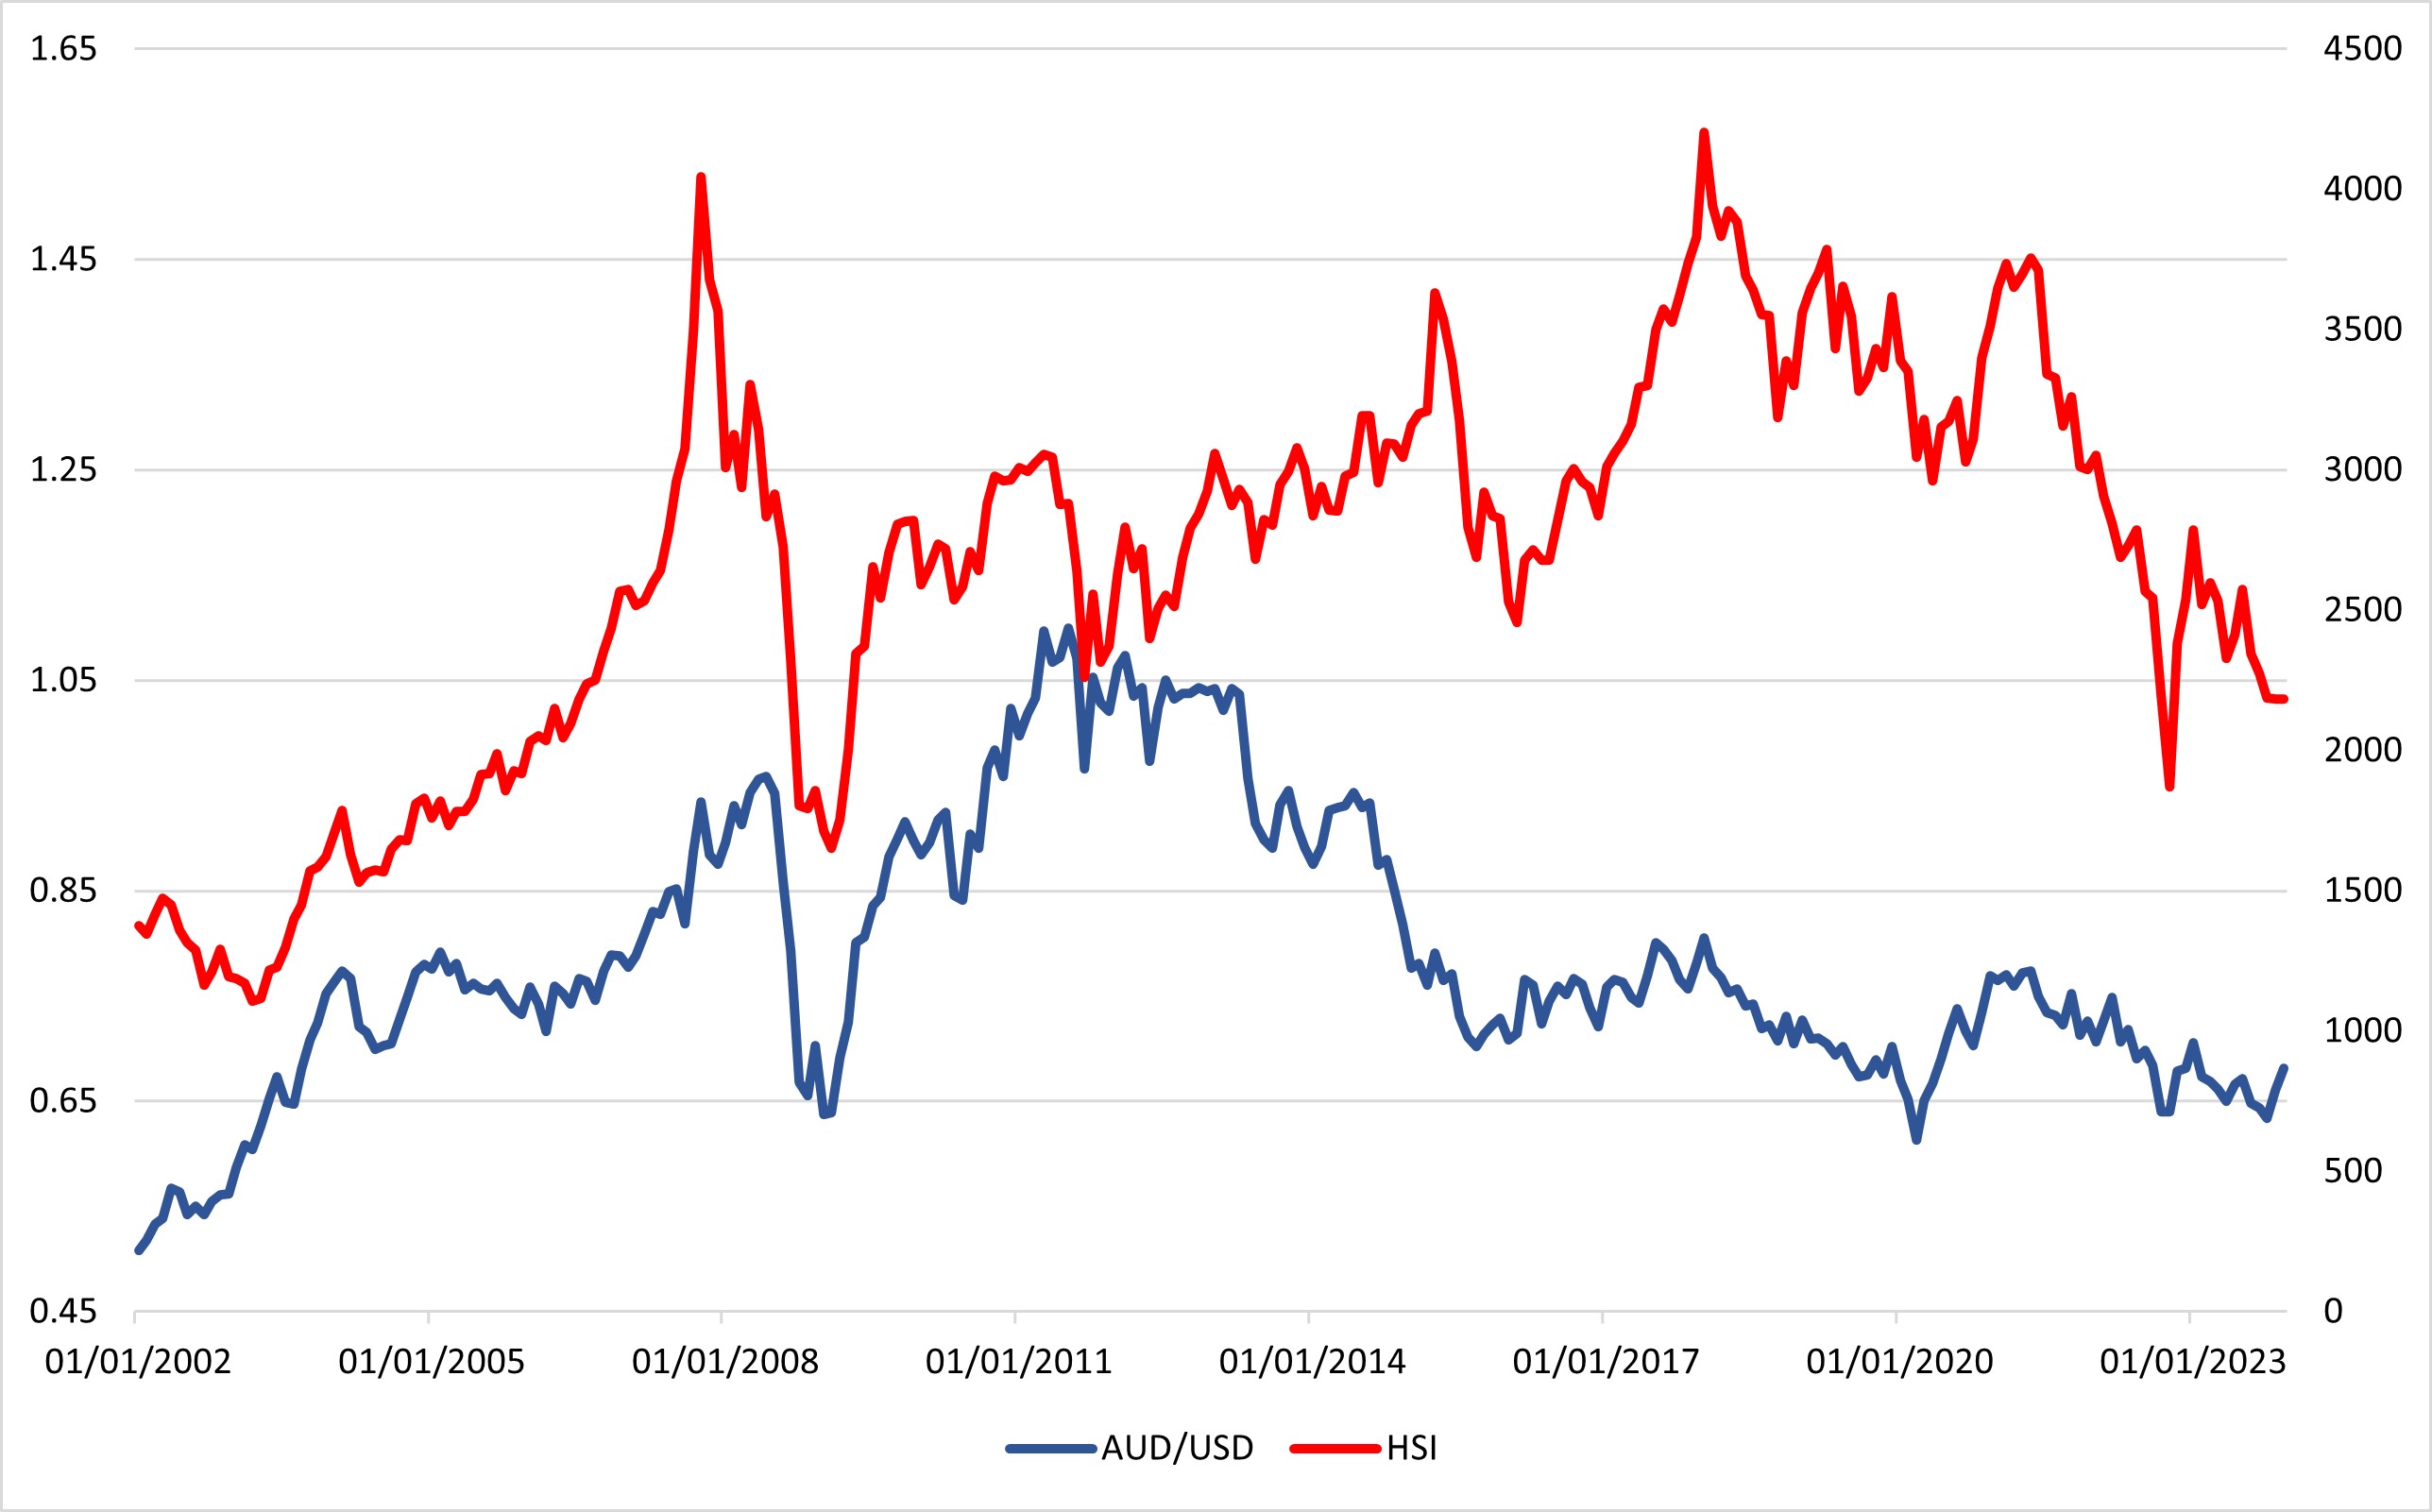
Figure 4 shows the performance of AUD/USD and HSI.
The Hang Seng Index covers 82 Hong Kong equities but has been migrating towards Chinese enterprise listed in Hong Kong in the past decade, thus should also have a level of correlation with AUD/USD.
Interestingly, the HSI is showing a stronger correlation with the performance of AUD/USD than SHCOMP. The correlation is still weaker than MSCI CHina and Australian equities but the broader trend is similar to AUD/USD except from 2015-2018.
Figure 5: AUD/USD and S&P 500
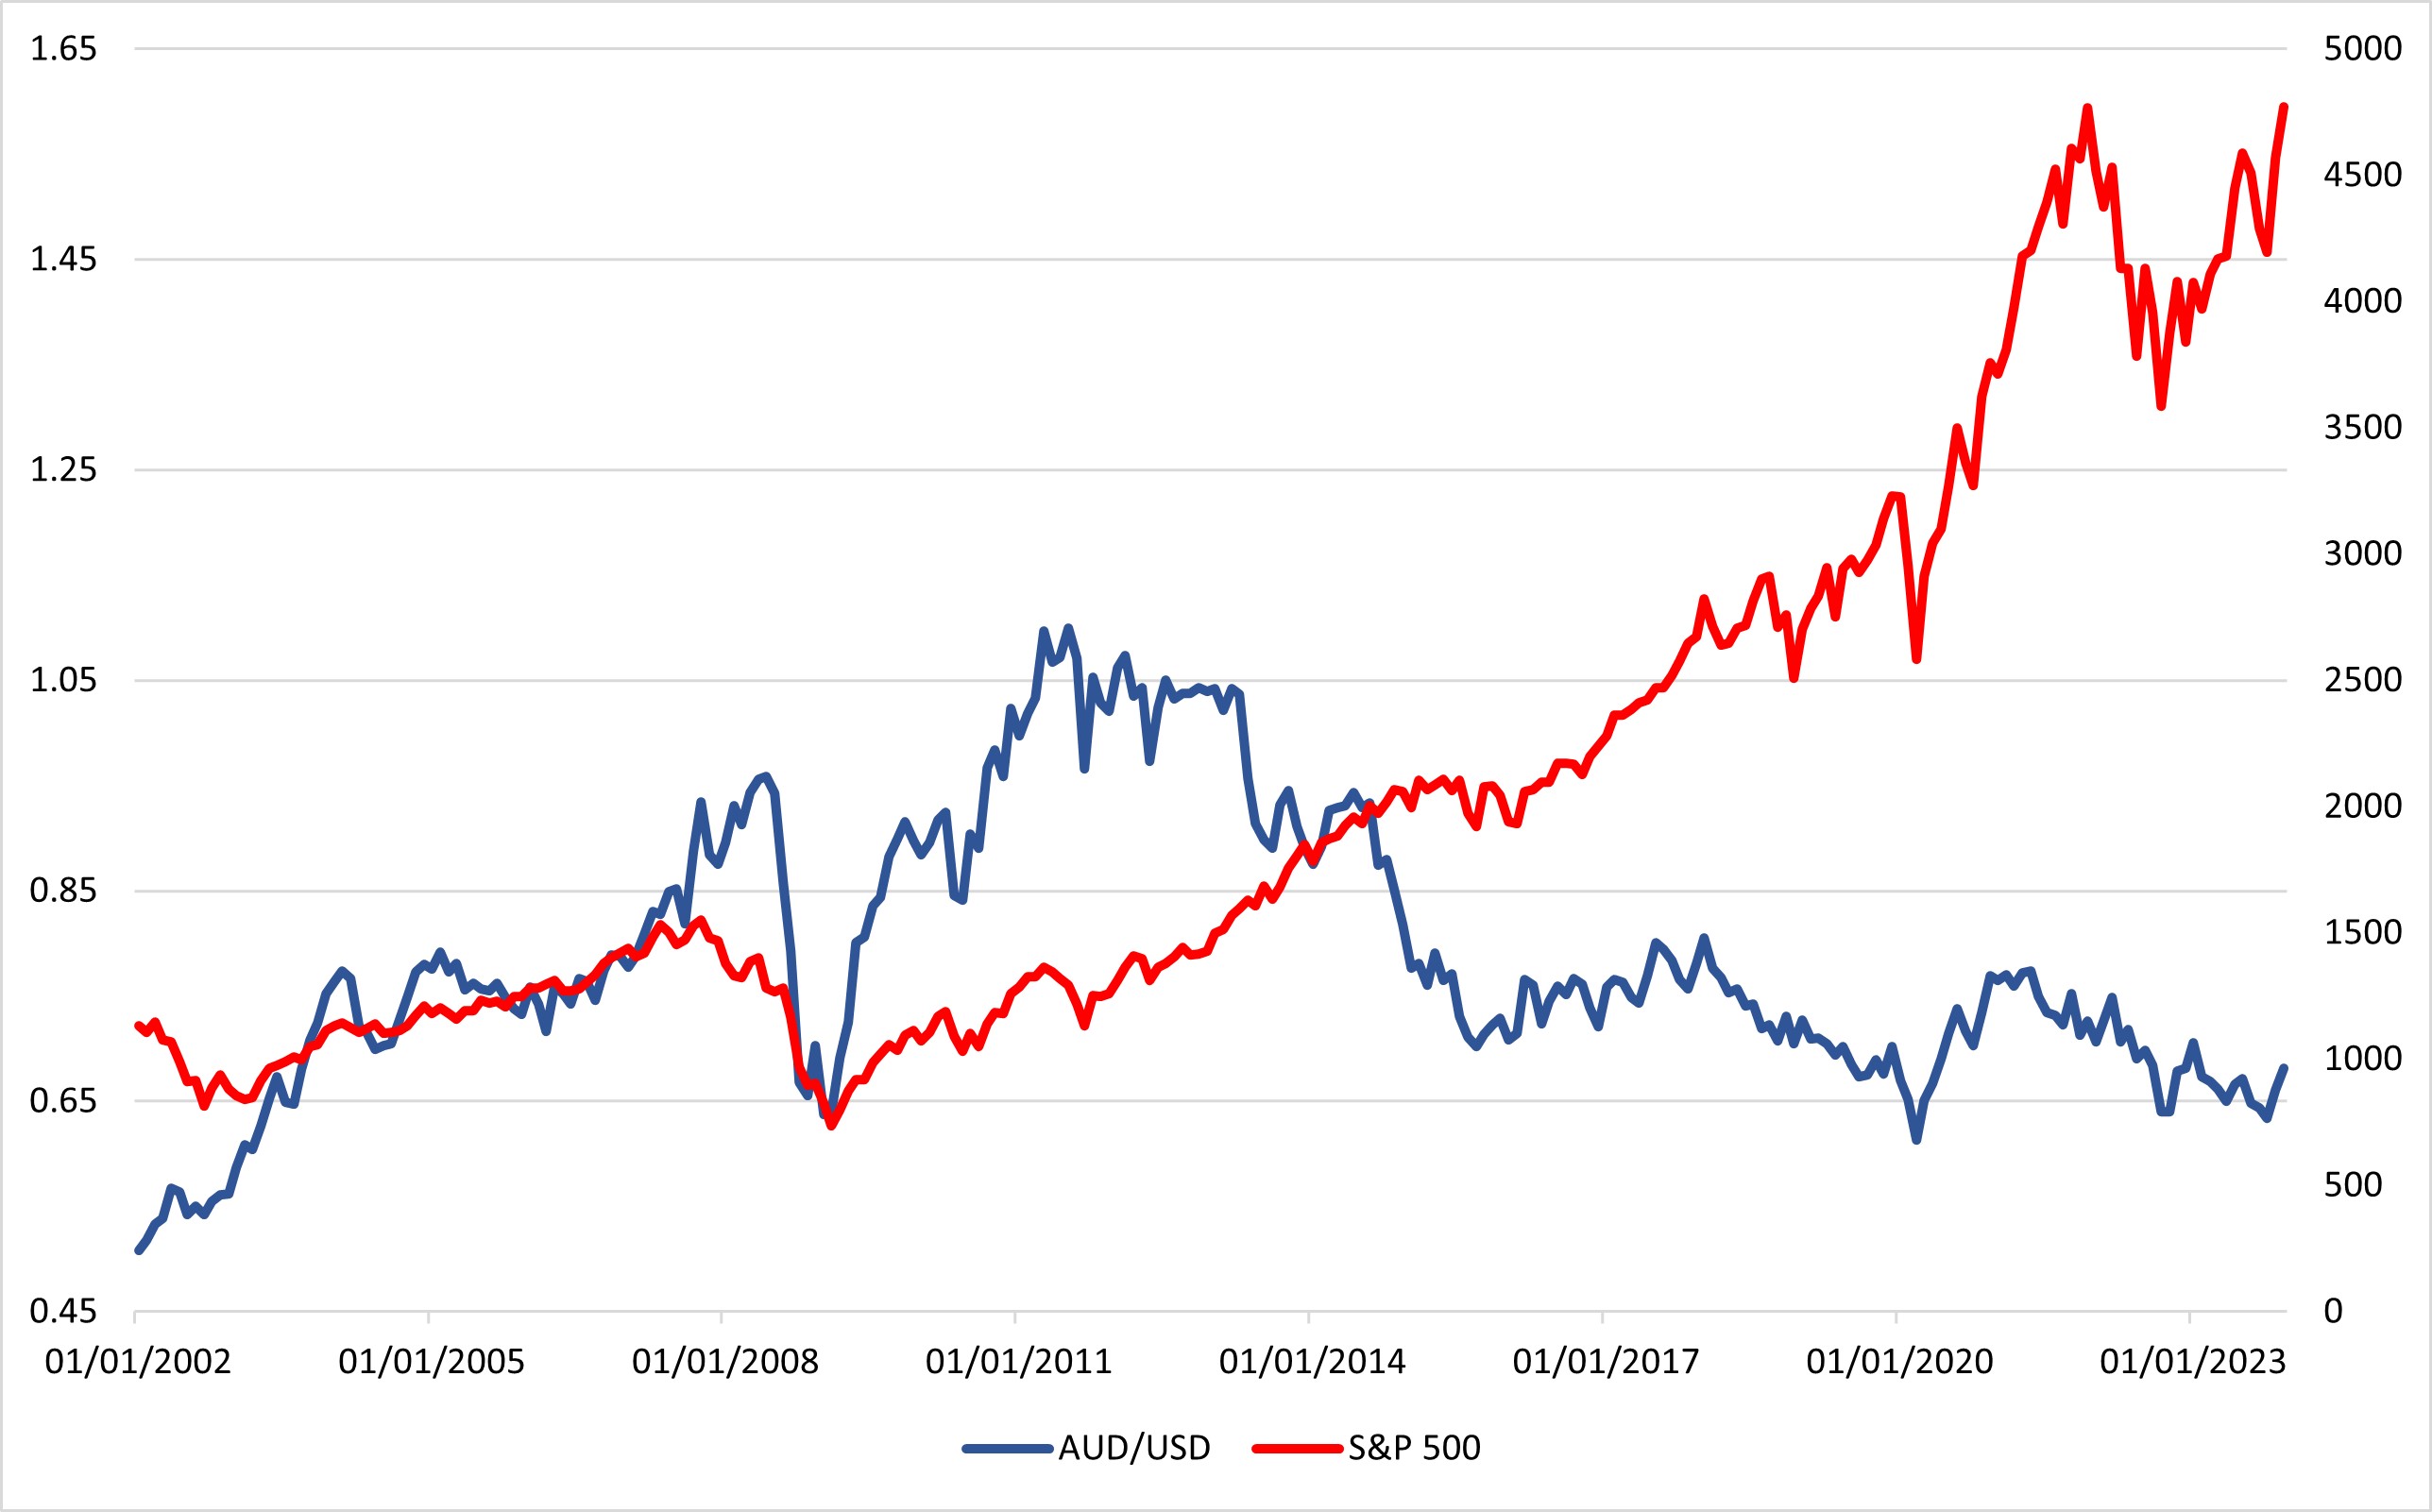
Figure 5 shows the performance of AUD/USD and S&P.
S&P is one of the three largest equity index in the U.S. and is the leading barometer in market sentiment.
While we see certain similarity between the performance of AUD/USD and S&P before 2015, it could hardly be conclude as correlation. The S&P has been steadily in an uptrend for the past two decade while AUD/USD is overall choppy. Moreover, apart from GFR time, we do not see a correlation between the volatility in AUD/USD and S&P.
Figure 6: AUD/USD and NDX
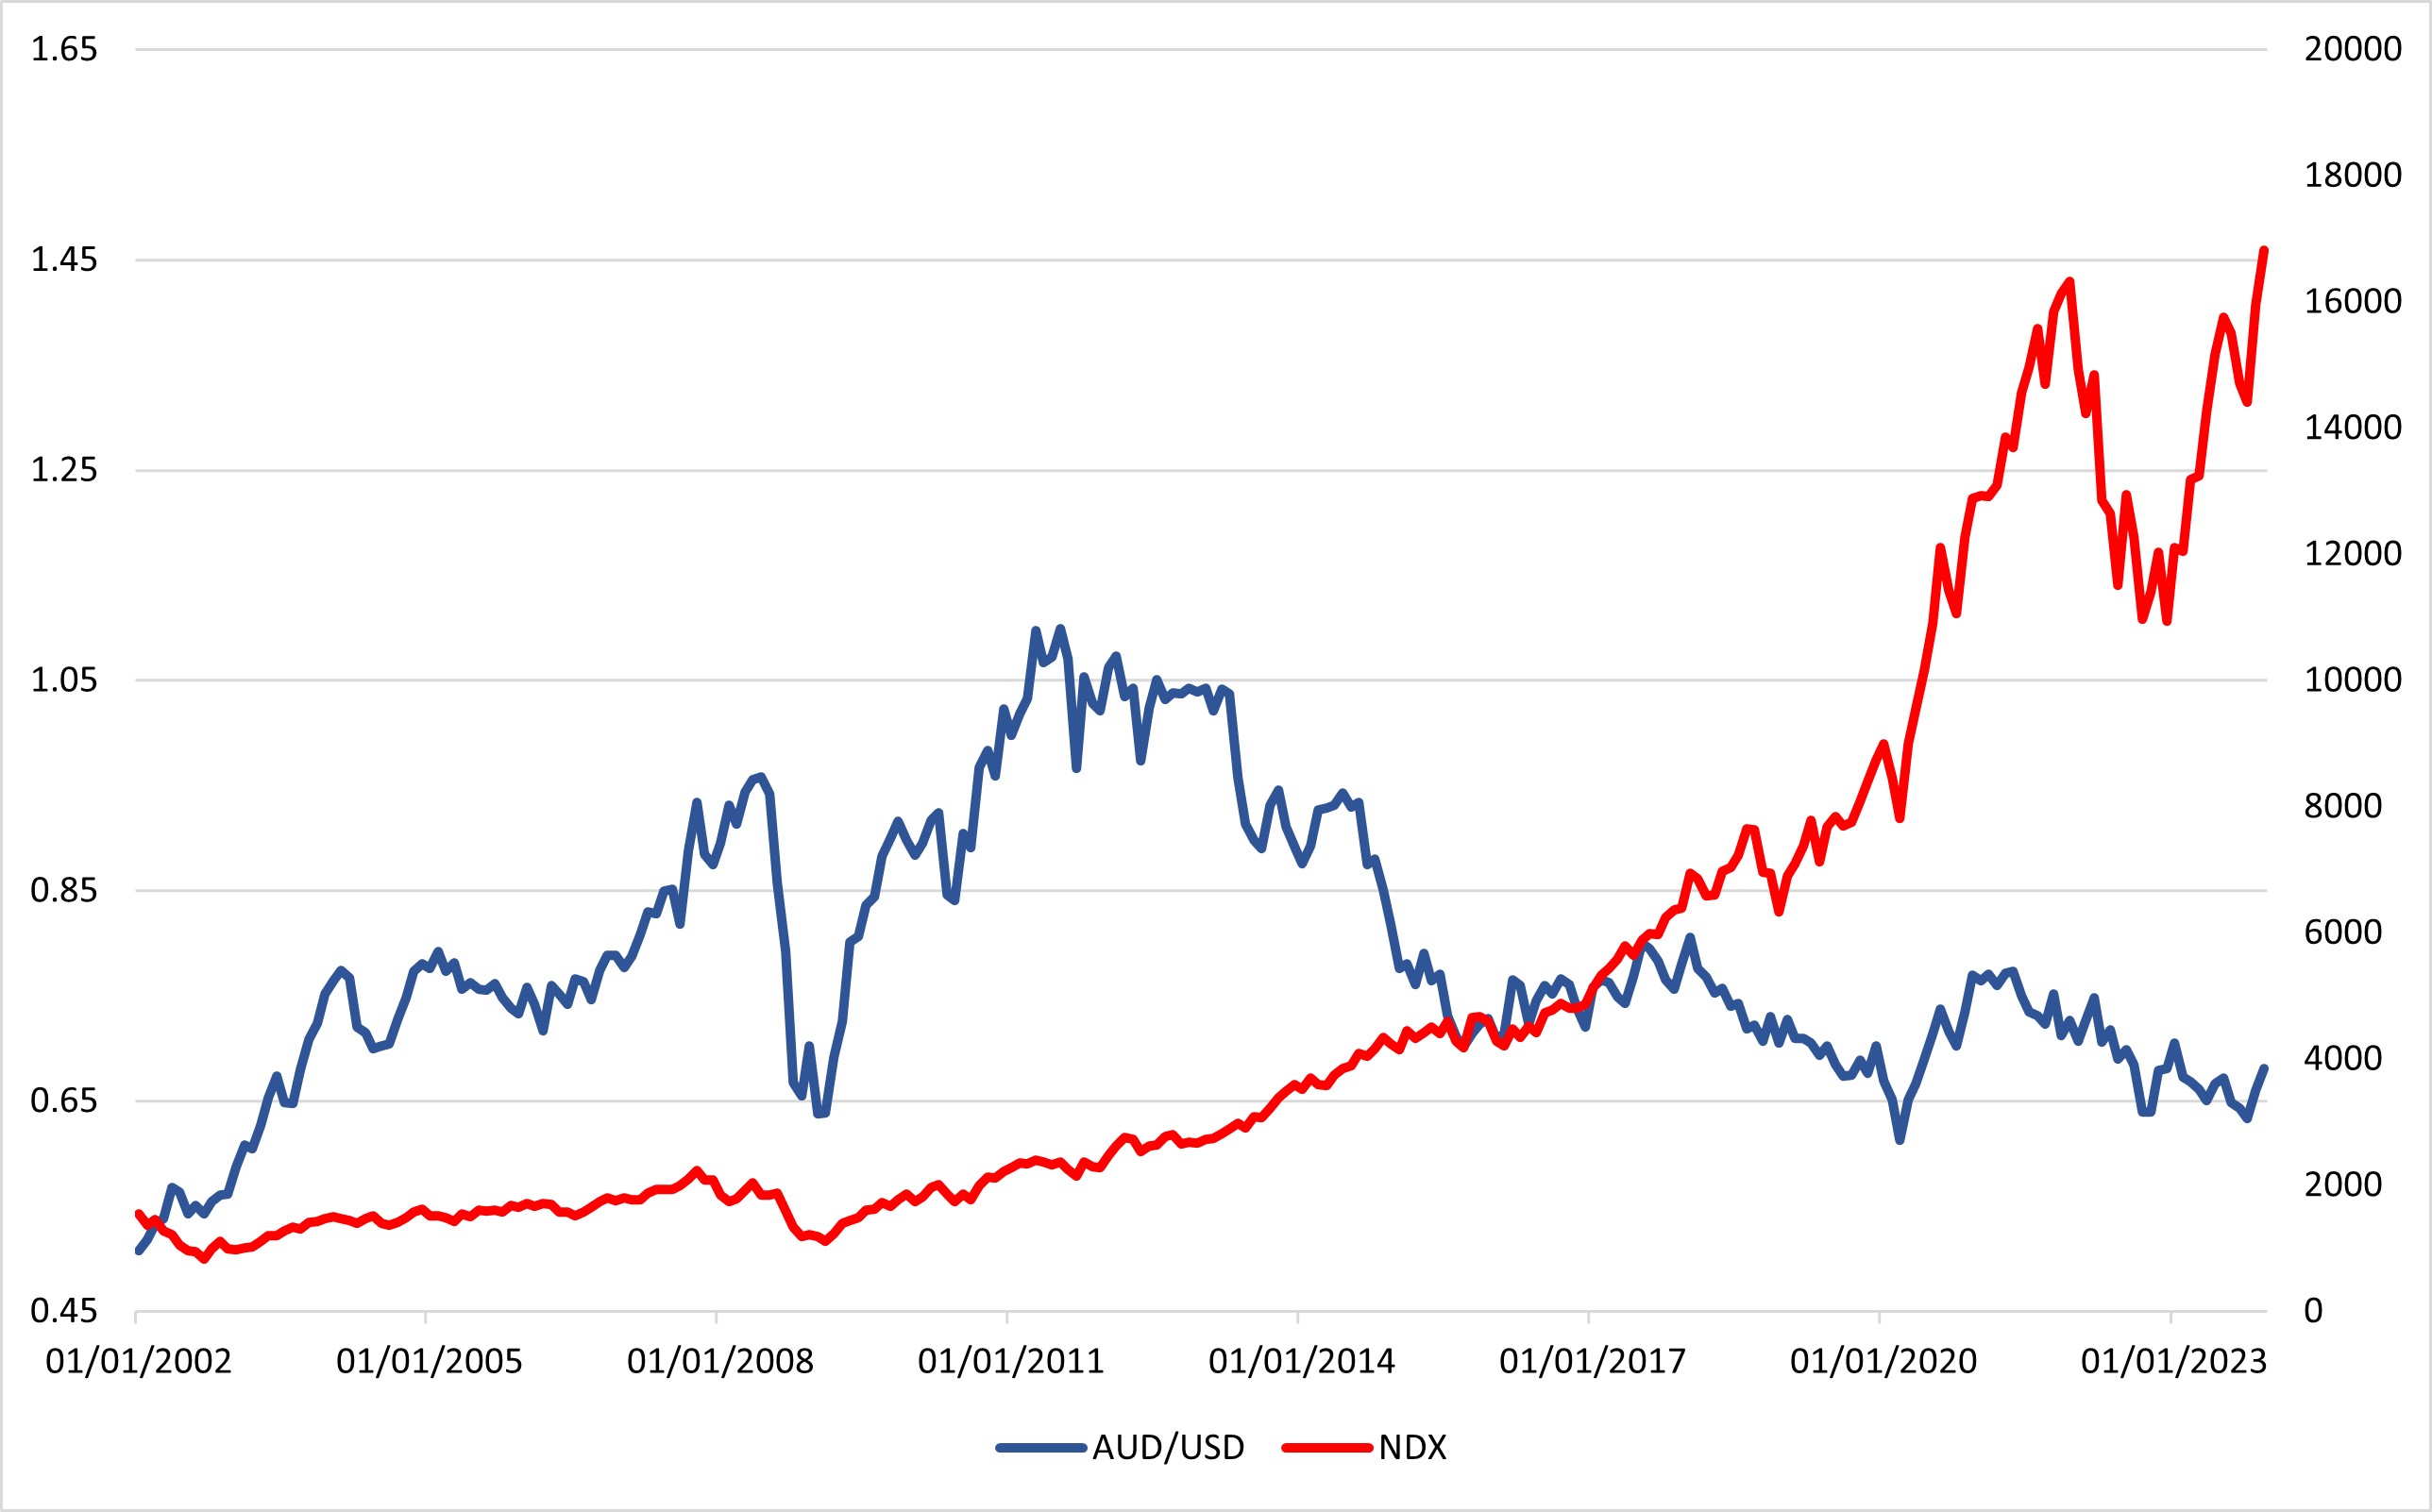
Figure 6 shows the performance of AUD/USD and NASDAQ.
NASDAQ is another large equity index in the U.S.. And similar to the S&P, NASDAQ has been in a sloid uptrend for the past two decades. Given the magnitude of NASDAQ's rally, the correlation, if exist, is minimal. Apart from a dip in GFC, there is almost no sign of correlation between the two.
Figure 7: AUD/USD and Dow Jones
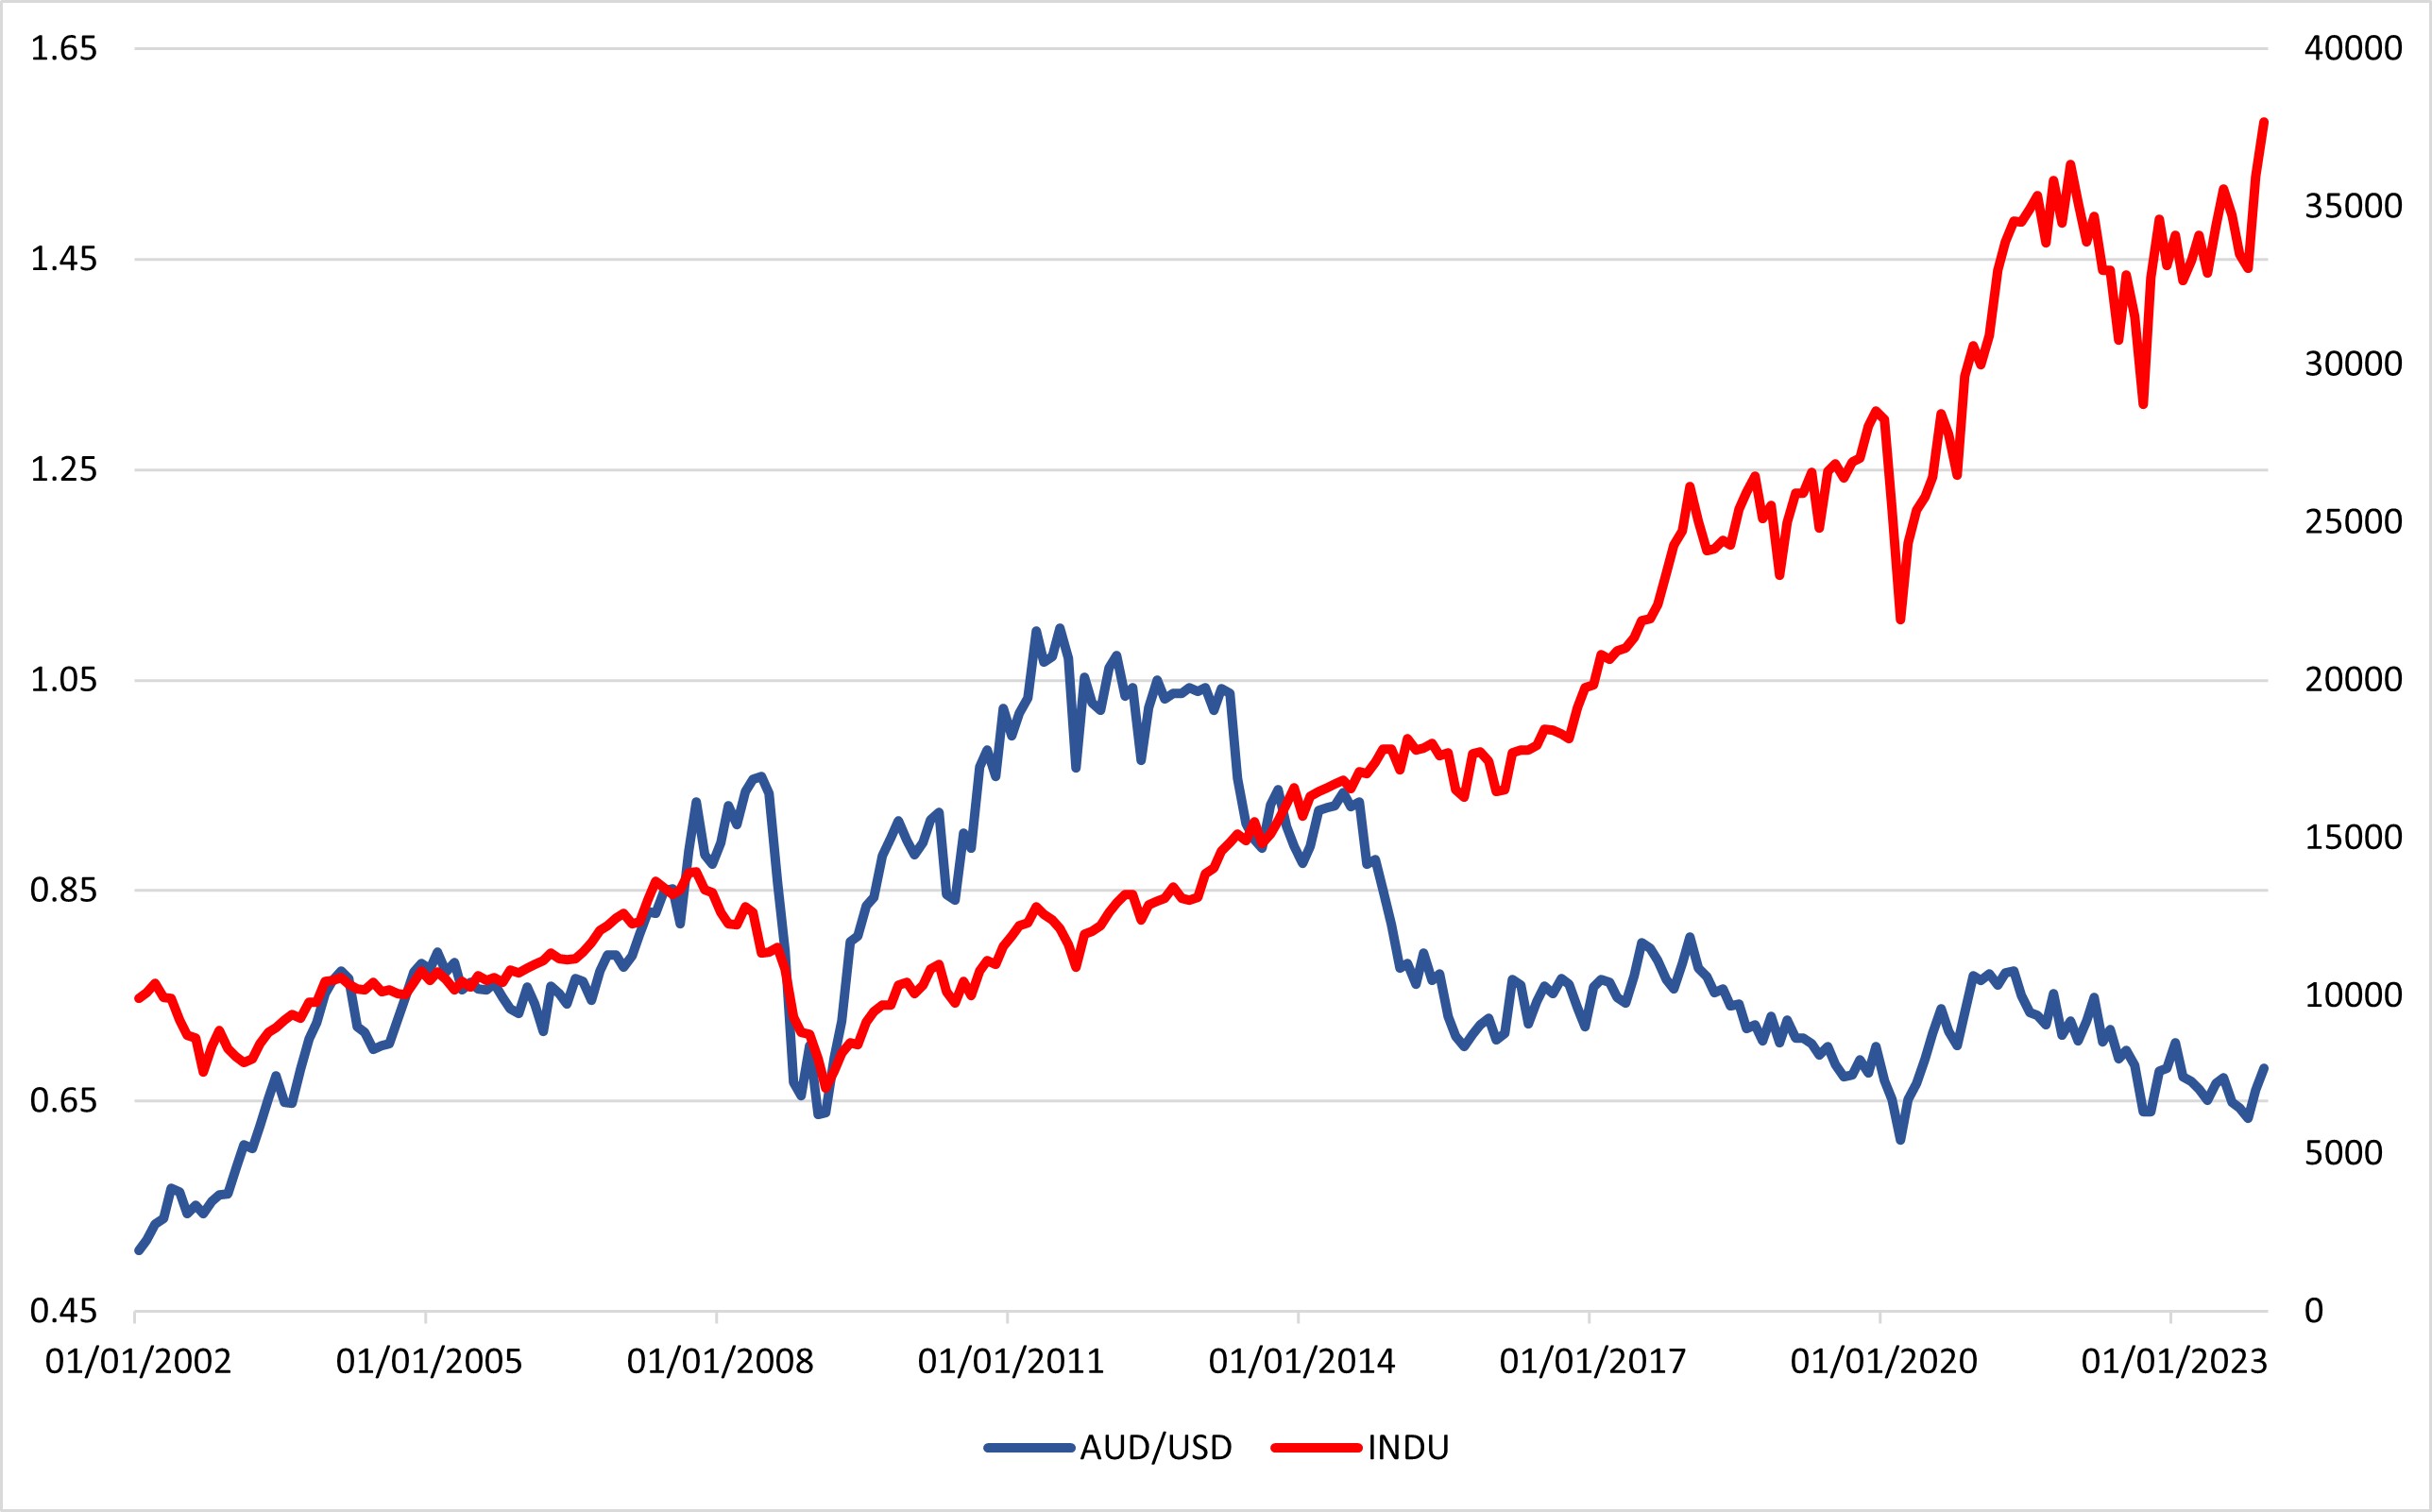
Figure 7 shows the performance of AUD/USD and Dow Jones.
Coming to the last largest U.S. equity index, the situation is similar to the other two. The correlation is weak. Any correlation is rather linked to market sell off due to GFC or market euphoria from global easing.
In short, it is inaccurate to call the AUD/USD a risk currency. While there is certain correlation between the performance of AUD/USD and other equity benchmarks, the correlation is only strong with local benchmark, seconded by Chinese equities and almost none with U.S. equities, which is traditionally dominating market sentiment. Further data analytics will be illustrated in the last chapter but one can be safe to assume if "risk" is the only factor you are using to gauge AUD/USD performance, the odds of getting wrong footed is high.