U.S. August Personal Income and Spending - Core PCE Prices maintaining trend, still above target
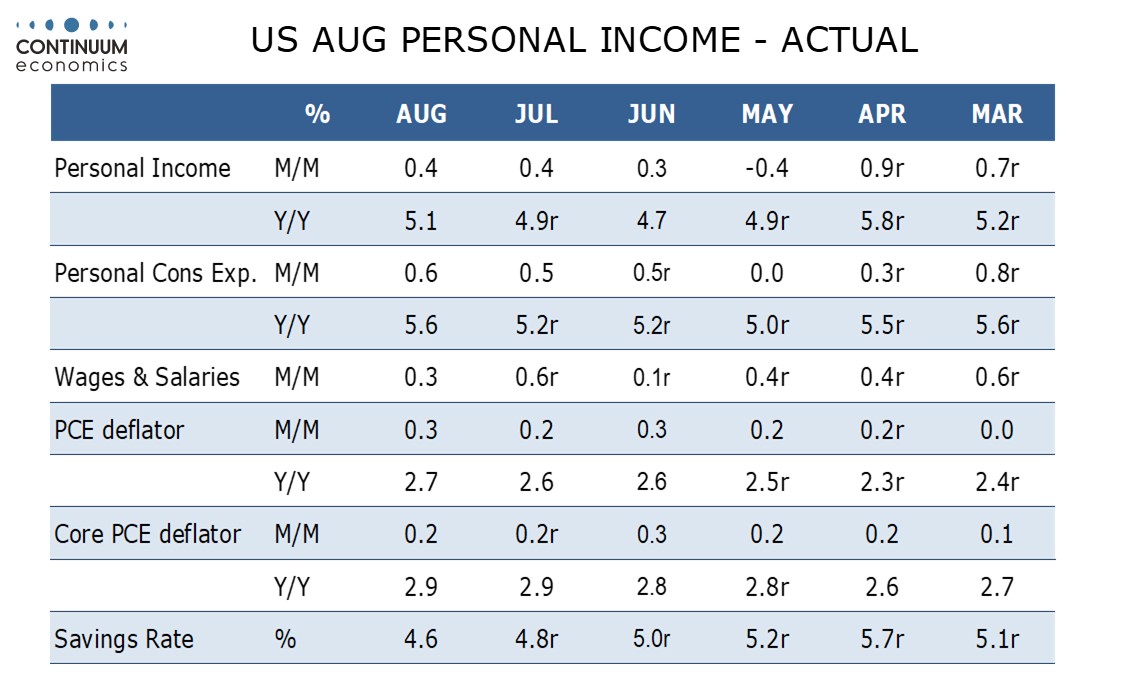
August personal income at 0.4% and spending at 0.6% are both a little stronger than expected while price indices are in line, 0.3% for overall PCE and 0.2% for the core rate, with the latter 0.227% before rounding. Each price index underperformed the August CPI counterpart by 0.1% (August PPI was soft).
Yr/yr core PCE prices are stable at 2.9% as was predicted by Fed’s Powell after the recent FOMC meeting, but the overall pace edged up to 2.7% from 2.6%. Historic revisions released with the GDP data show little change to recent yr/yr core PCE prices but 2024 data has been revised marginally higher by around 0.1-0.2%.
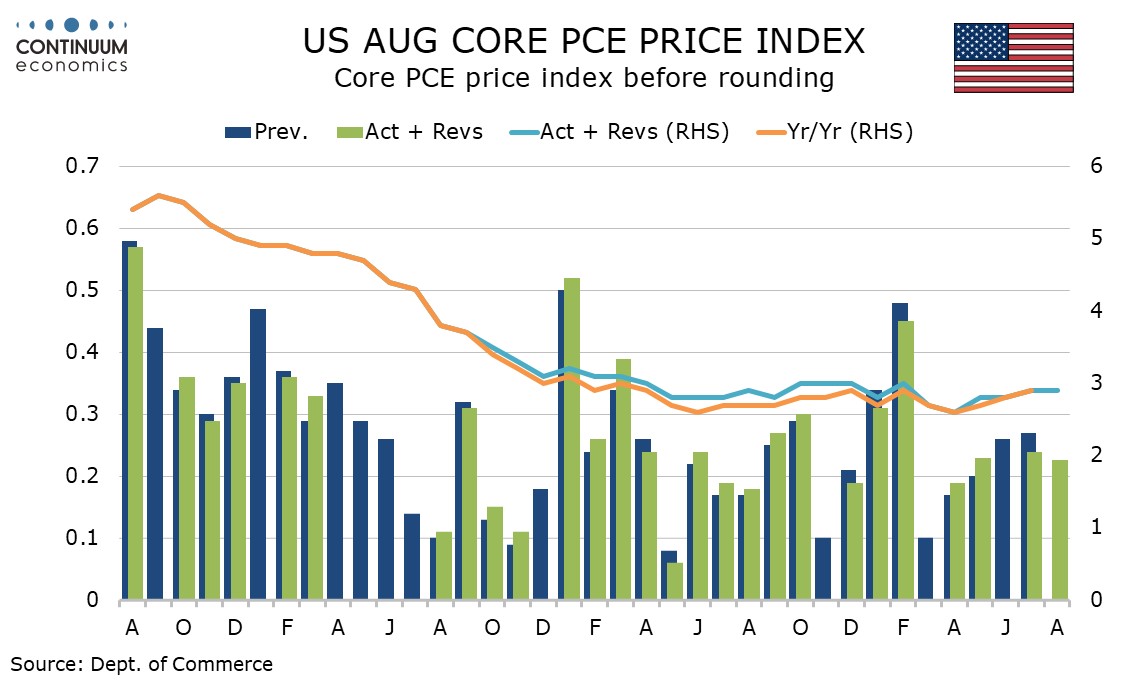
July core PCE prices were revised to 0.2% from 0.3%, and are now 0.235% before rounding. The last four core PCE price gains have been between 0.23% and 0.26% before rounding, which is consistent with the yr/yr pace of 2.9%, showing a continued above target inflationary pace.
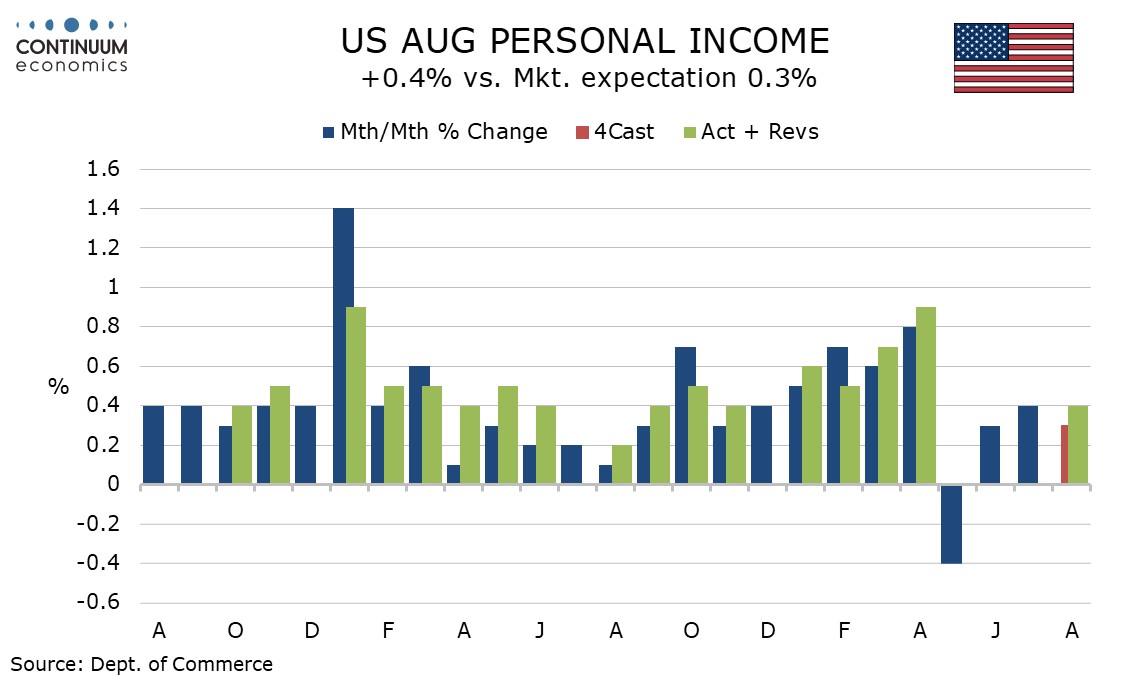
Wages and salaries rose by a subdued 0.3% consistent with a subdued August non-farm payroll breakdown. Overall personal income was lifted to 0.4% by farm income and a legal settlement from a domestic health insurance provider.
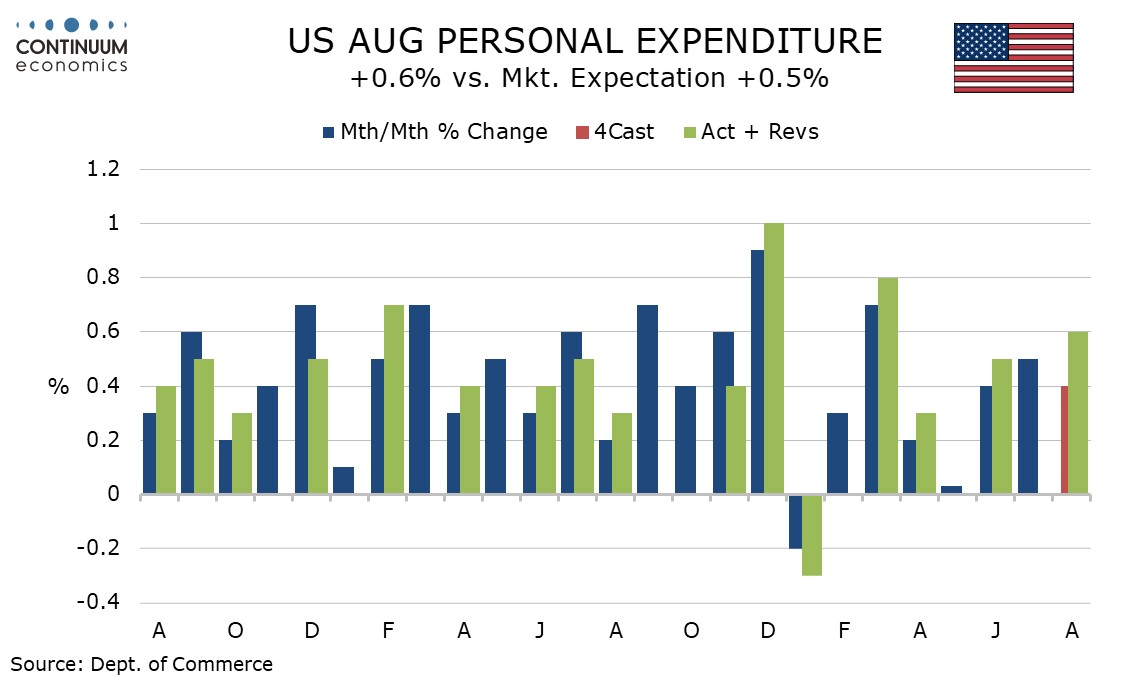
Personal spending detail shows goods up by 0.8%, slightly stronger than a 0.6% increase in retail sales, and services up by 0.5%, matching an upwardly revised July (from 0.4%) and gains of 0.4% in May and June.
Historic revisions to income and spending were positive, though the upward income revisions were most felt in 2023, while the spending revisions were more recent, and particularly strong in Q2 of 2025.
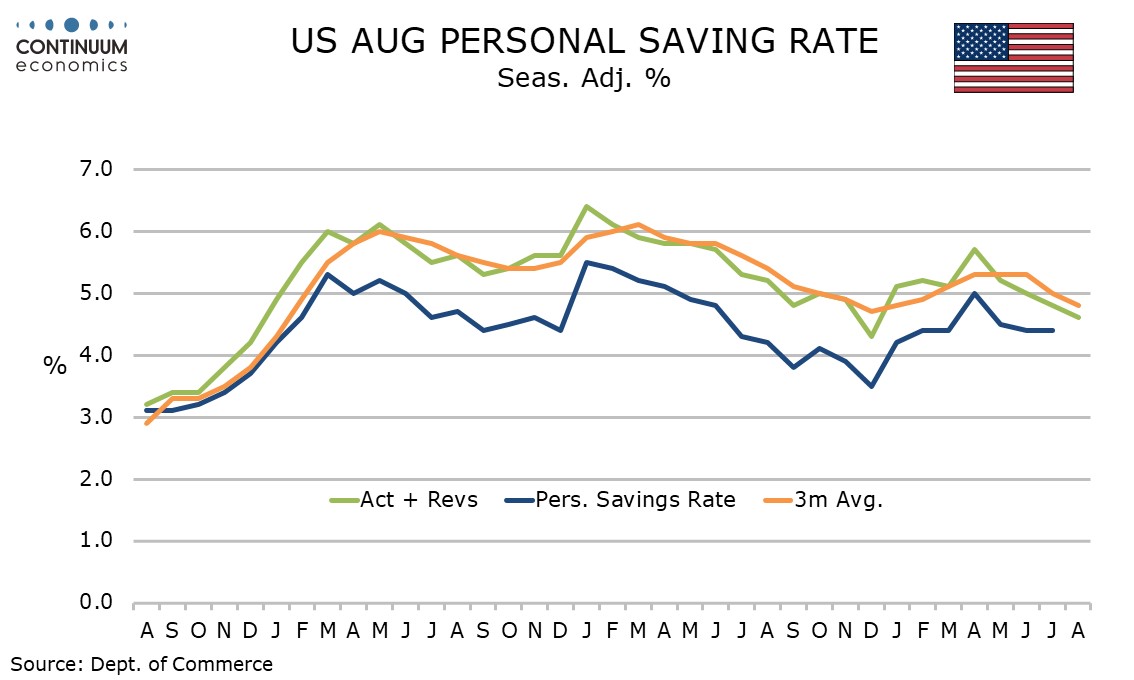
Savings have been revised up for 2023, 2024 and 2025 to date as income revisions exceeded those for spending, mostly by a little less than 1.0% but with recent revisions to spending being the stronger recent revisions to savings have been more modest, July to 4.8% from 4.4%. August’s savings rate slipped to 4.6%, now the weakest since December 2024.
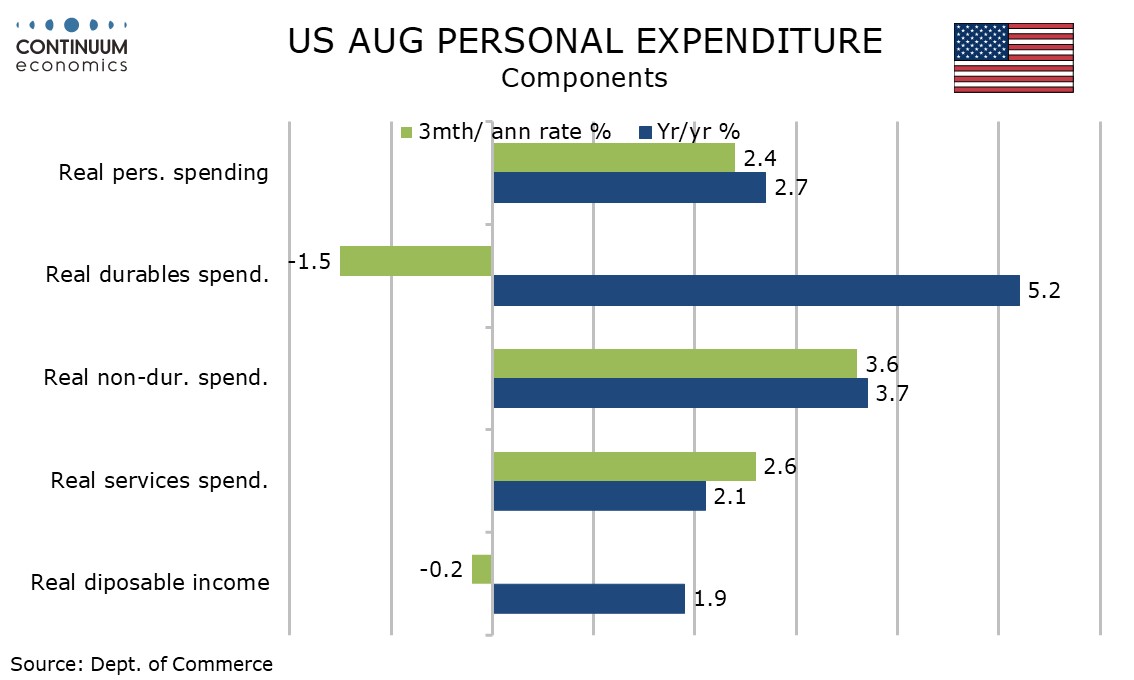
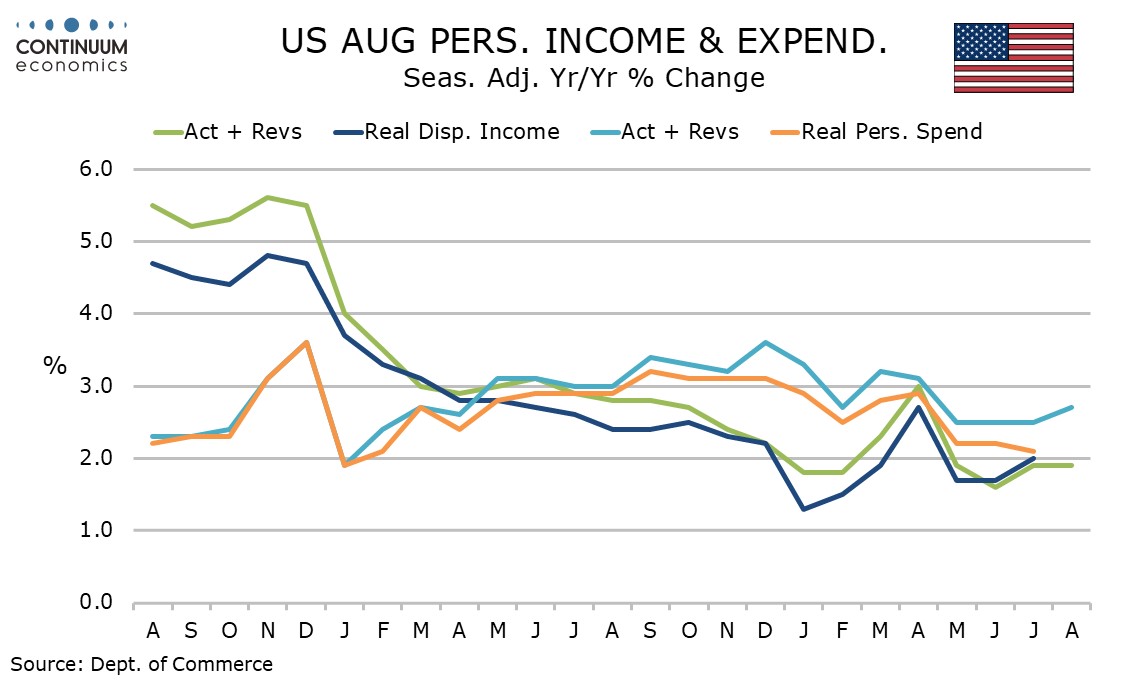
On a 3m/3m basis real disposable income is down by 0.2% annualized, which could be a warning sign for future spending, but the current real pace for spending is healthy at 2.4% (3 months annualized). The 3 month annualized pace for core PCE prices matches the yr/yr rate at 2.9%. Without tariffs, some slowing would probably have been seen.