FX Daily Strategy: Asia, April 2nd
Market Spotlight Remain on Middle East
Volatility continuing for U.S. February Trade Balance
USD/JPY Inch Distance From Intervention
Figure: Major Middle East and Other Invasions
| Troop Numbers | War Length | Comments | |
| Gulf War 1991 | 689k U.S. | 42 days | 42 country coalition with 6 month build-up and 42 day desert storm. Ground invasion by Saudi Arabia. Iraqi sea mines severely damaged two U.S. Navy vessels, the USS Princeton and USS Tripoli. 2 year mine clearance after the war. |
| Iraq Invasion 2003 | 466k U.S. | 26 days | Six country coalition with 6 month build-up and invasion by land through Kuwait. |
| Iran-Iraq 1980 | 210k Iraqi | 8 years | Iraq invades Iran September 1980, with former Iraq leader Saddam Hussain starting peace negotiations June 1982 but a UN ceasefire only reached August 1988. |
| Ukraine War 2022 | 190k Russian at border | 4 years | Land based invasion from Russia and via Belarus. 5 month build-up at the border. The war is ongoing with Russia holding around 20% of Ukraine’s land. |
| Falklands 1982 | 25.9k UK | 42 days | UK did not have air superiority. UK Lost seven ships—four warships and three auxiliary/merchant vessels—along with one landing craft. |
Source: Continuum Economics
Any ground-based invasion would likely result in a long war and Iran would likely counter with attacks on energy or other key facilities around the Gulf. Sea and air based invasions are also difficult, while any victory would likely be followed by occupation. WTI oil prices would spiral higher to USD120-150 on fears that the Strait of Hormuz could be closed for months (here). This would cause major risk-off in global markets. This financial market risks could mean that the Trump administration stops short of ground invasion and could threaten to blockade Iran oil/bomb power plants, but still trying to reach a ceasefire deal – our baseline remains for a 4-to-8-week war.
The U.S. build-up before the 1991 gulf war and 2003 Iraqi was around 6 months (Figure) and the U.S. military would likely strongly advise the Trump administration that build-up cannot be rushed. If the objective is Kharg Island (90% of Iran’s oil exports), then the build-upcould be shortened– though Iran is reported to have reinforced Kharg Island defense in anticipation of a U.S. invasion. The Iran mainland around the Straits of Hormuz would be more difficult, while islands in the Straits of Hormuz would be symbolic but would not free up the Straits of Hormuz and guarantee the reopening of the shipping lanes. This could mean that the current phase of the war has to be continued prior to an invasion happening in April/May.
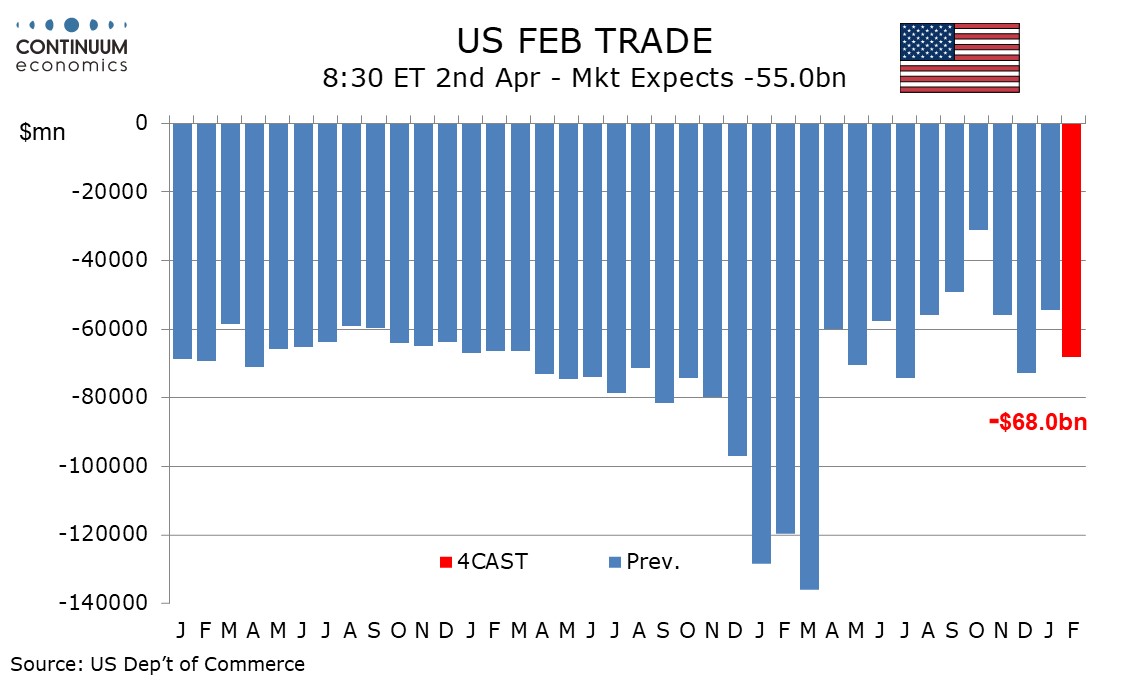
We expect the US trade balance to continue to show volatility in February, with a deficit of $68.0bn, up from $54.5bn in January but below December’s $72.9bn. The deficit would remain slightly below where trend was running in 2024, around $75.0bn per month, before a pre-tariff surge and a post-tariff plunge.
The volatility in recent trade data has been most pronounced in a small number of components. Exports bounced sharply in January led by precious metals and non-monetary gold, both of which look unsustainably high though an immediate return to trend is far from assured. Also strong in January were exports of aircraft, which Boeing data suggests will be less so in February, and computers, where trend is strong but January strength will be difficult to sustain. Pharmaceutical preparations may however pick up from January weakness. Overall we expect goods export volumes to fall by 4.0% after a 7.4% January increase but price gains will restrict the nominal decline in goods exports to 2.5%.
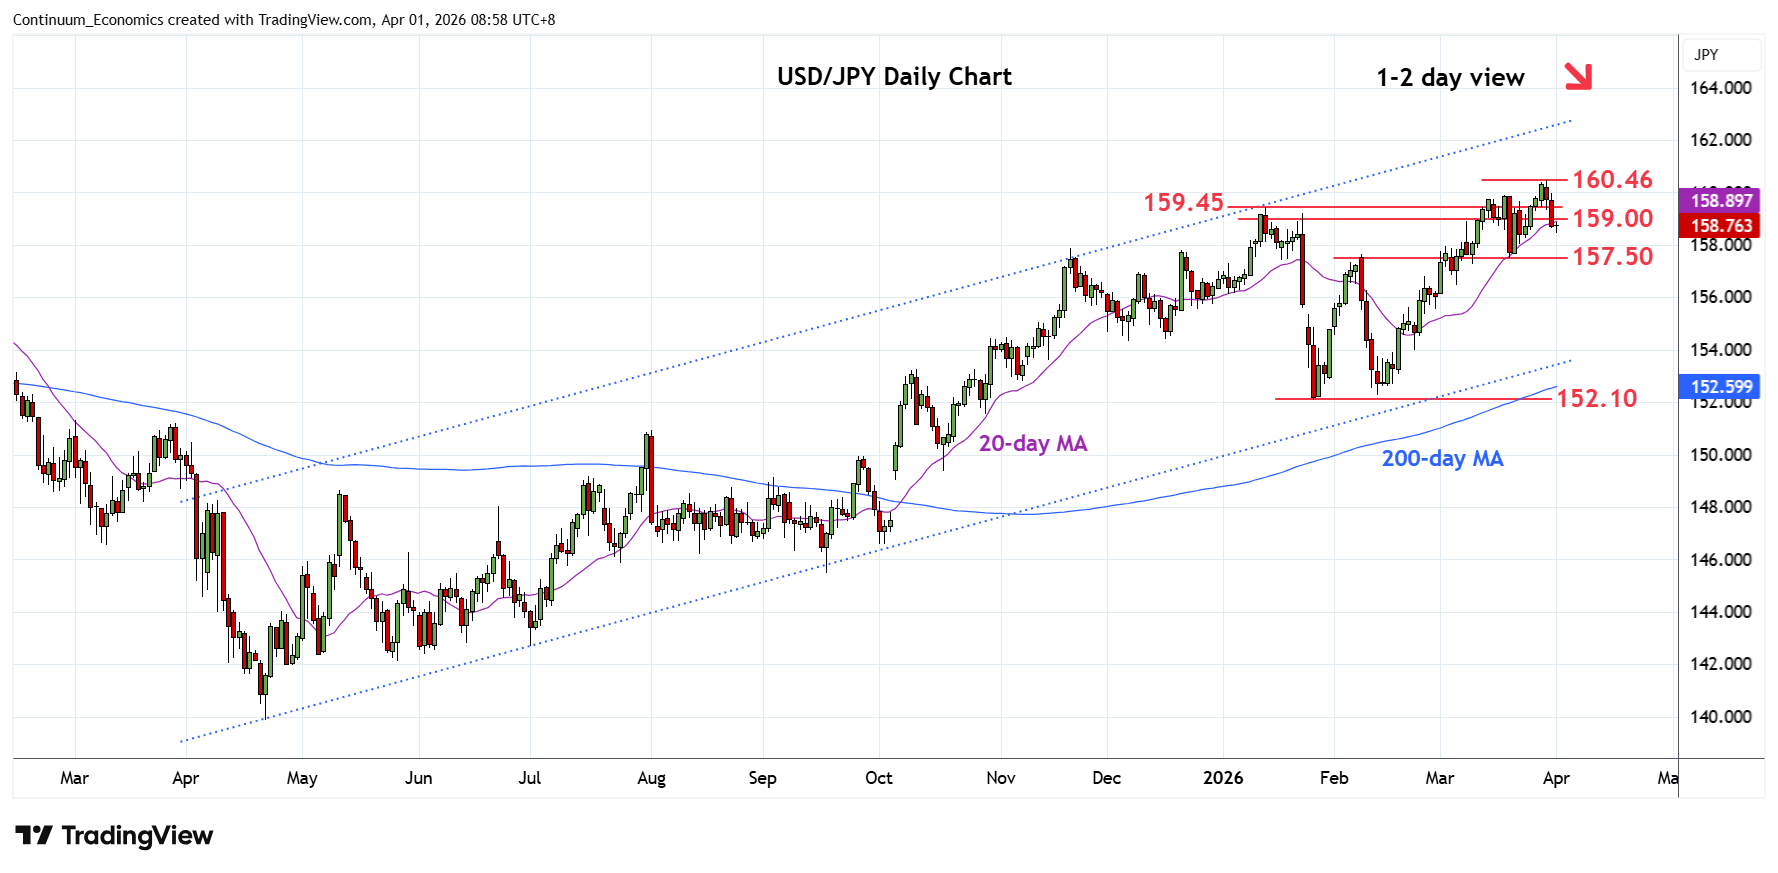
The USD/JPY remain inch distance from potential intervention. The softer USD on improving risk mood have temporarily kept the blade off market participant's head but without structural change, for example BoJ's rate change or geopolitical picture clearing, the direction may remain unchanged.
On the chart, the consolidation below the 160.46 fresh year high has given way to selling pressure through support at the 159.45/159.00 area. Daily studies have turned down to unwind overbought readings and see room for pullback to strong support at the 158.00/157.50 area. Weekly studies are stretched as well and suggest scope for break here to open up room for deeper pullback to retrace gains from the January/February lows. Meanwhile, resistance is lowered to the 159.45 January high which is expected to cap and sustain losses from the 160.46 high.