UK CPI Review: Clearly More Reassuring Inflation Signals
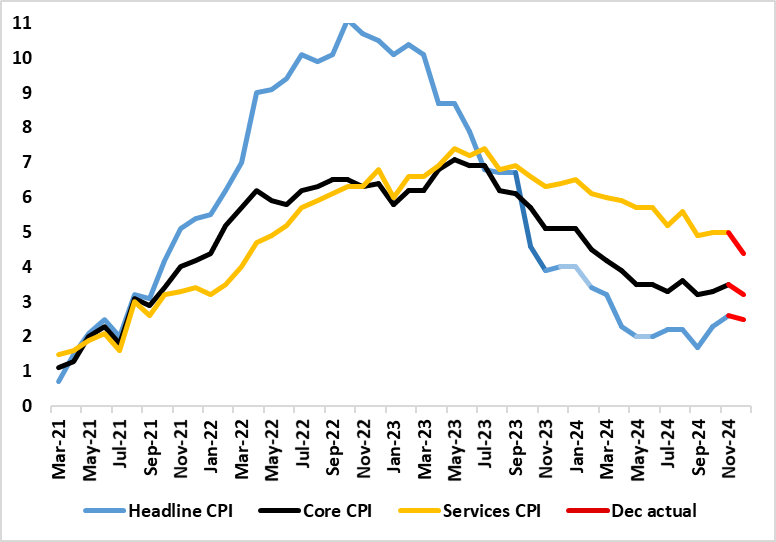
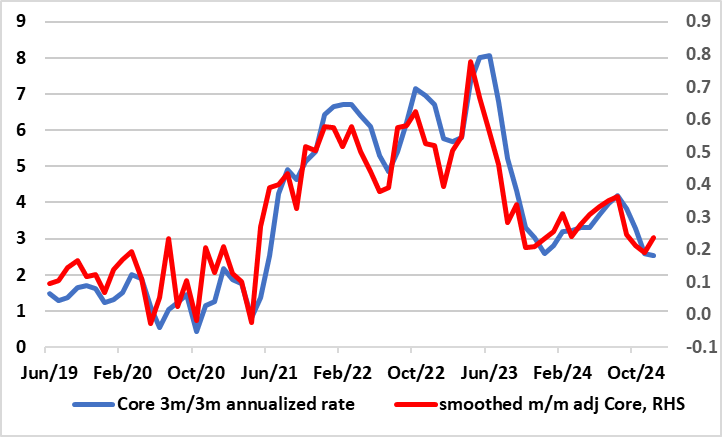
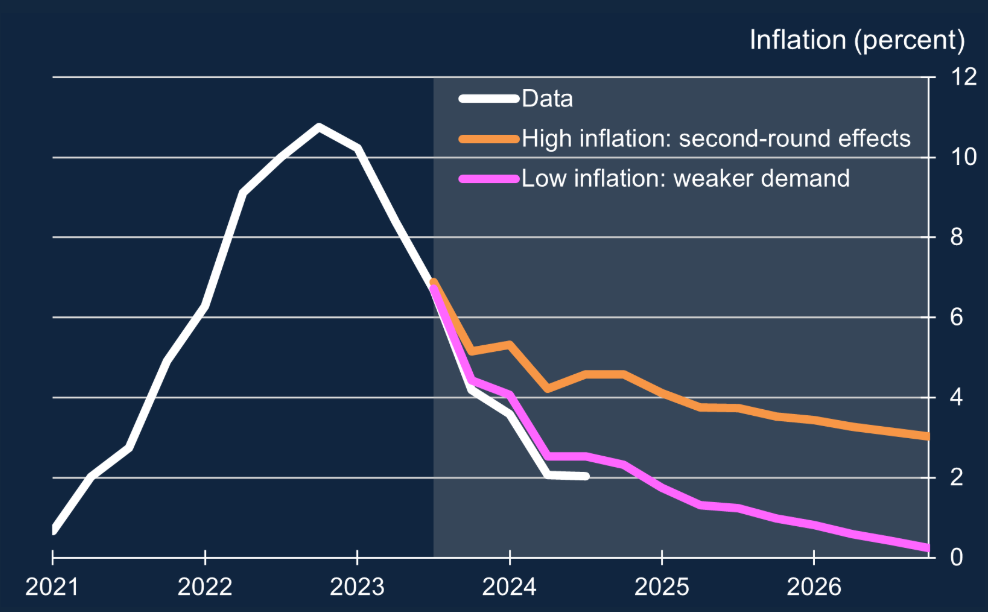
Amid current bond market ructions, which some are suggesting reflects stagflation worries, we think that looming December UK CPI data may help dispel some of the inflation aspect of those concerns. Indeed, with markets are looking for the headline rate to stay at November’s 2.6% outcome, the actual outcome instead dropped a notch and down to BoE thinking of a 2.5% figure, and very similar to EZ headline inflation. This December figure was driven by higher petrol costs while the headline masked a drop in both the core and services inflation of 0.3 ppt and 0.6% respectively (Figure 1), the almost three–year low of 4.4% in services thereby providing a much more reassuring message than the November data, especially as it reflected a drop in restaurant inflation, often considered to be a key indicator of inflation persistence. Moreover, looking at the CPI details, adjusted data also painted a much softer picture than base-effected y/y numbers (Figure 2), adding to downside surprises that the BoE have admitted to (Figure 3).
Figure 1: Broadly Softer Inflation Picture?

Source: ONS, Continuum Economics
Those November CPI data came after more cost pressure worries were fanned by earnings data in the latest labor market numbers. But those numbers also showed clear(er) signs of falling employment and those payroll figures also questioned whether wage growth has indeed picked up. As a result, the figures do sit more easily with the ‘stag’ part of a stagflation picture as do the most recent business survey numbers. Indeed, it is clear is that the economy is stagnating, and that this predates the Budget, very much asking to what degree it is BoE policy that is hindering activity principally.
The Recent Inflation Picture – More Benign in the Details?
As for recent inflation, coming in a notch lower than expected but in line with BoE thinking, CPI inflation fell to 2.5%, the 0.1 ppt drop reflected a clear downward contribution from restaurants and hotels, this offsetting a large upward contribution from transport, mainly fuels. Nevertheless, the CPI data backdrop is still consistent with underlying inflation having fallen, especially when assessed in shorter-term dynamics (Figure 2) something that was repeated even in those November data and even more so again in the December numbers.
Figure 2: Clear Adjusted Core Inflation Drop Continues?

Source: ONS, Continuum Economics
Gradualism Still the MPC Watchword
In what was something of a more hawkish assessment and outlook, the BoE nevertheless delivered the expected further 25 bp Bank Rate cut to 4.75% last month with only one (expected) dissent against. But we think more cuts will arrive starting with a move in February as the MPC reacts to repeated downside surprises in inflation (Figure 3) and also on the demand side of the economy – not least with a possible Q4 GDP drop on the cards. The question is what constitutes the gradualism posture the MPC majority is pointing to – we think this will result in up to five 25 bp cuts this year!
Figure 3: BoE Scenarios for the UK economy produced in December 2023

Source: BoE; Chart shows high and low inflation scenarios envisaged in the November 2023 forecast for CPI inflation, the white line shows the latest data available up to the November 2024 MPR