Equities Outlook: AI Optimism, But Caution Elsewhere in DM economies
· In terms of the S&P500, we remain less concerned about high valuations in the tech sector provided AI labs growth remains fast. 12mth fwd information technology are mid-range in the 2020-26 experience rather than at the highs. Even so, heavy equity issuance by tech companies and a shift of leadership from semiconductors to hyperscalers/AI labs can make tech and the S&P500 more volatile from H2 2026 onwards. The main problem is more non tech in terms a cyclical slowdown in consumption due to lower real income growth. The S&P500 could run up to 7700 in 2026 helped by the U.S./Iran interim agreement, but note the vulnerability in the non tech sector. It now appears more certain that AI labs explosive revenue growth will continue in 2027, but that household vulnerability will be greater. We thus look for a modest rally to 8200 for the S&P500 driven by tech.
· Non U.S. DM equities have less stretched valuations, but less AI exposure and optimism. EZ equities will likely match the U.S. or see small underperformance. Economic momentum is modest and risks corporate earnings growth. Spring 2027 will also see nerves around the May French presidential elections. Japan can see slight outperformance versus the U.S. helped by corporate reform/NISA flows, but the sharp earnings -bond yield narrowing is a headwind. The UK FTSE 100 can be helped by the ongoing commodity story, but FTSE 250 will likely lag in the next 6 months on a weak economy/shift of the Labour government to the left.
· EM equities should remain well underpinned helped by earnings and better valuations than DM. China can match the U.S. helped by tech, but restrained by only modest domestic consumption. Brazil remains our favorite market though gains will be more noticeable in 2027 when cumulative BCB easing and post-election fiscal consolidation allows a fall in 10yr government bond yields and rise in the 12mth fwd P/E ratio. India underperformance should end with a reopening of the Straits of Hormuz, though we see the best gains being in 2027 after a likely multi day war between India and Pakistan over Kashmir claims in H2 2026/H1 2027.
· Risks to our views: The lagged effects of the higher energy prices March-June 2026 could cause a greater growth hit than expected in the U.S., which could hurt the not tech corporate earnings story and prompt a deeper correction in U.S. equities to 6500-6800. Other markets would be dragged along by the U.S., but would likely not see as large a selloff due to less stretched valuations and less core inflation pressures.
Figure 1: 12mth Fwd S&P500 P/E Ratio and 10yr Real U.S. Treasury Yield Inverted (Ratio and %)
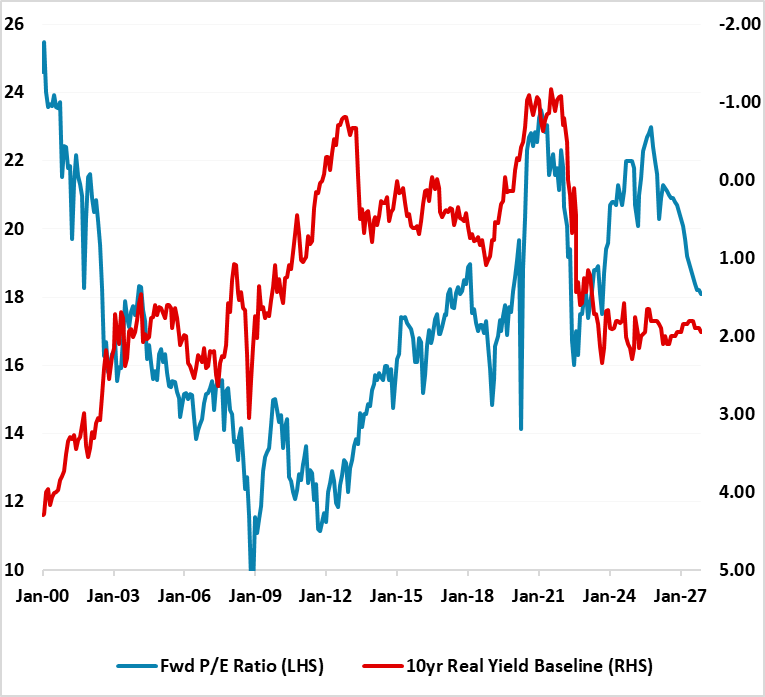
Source: Continuum Economics with forecasts to end 2027 for 10yr real bond yields and fwd P/E ratio.
The technology sector has led the U.S. equity market higher from the Iran war lows, both as tech valuations had moved towards the bottom of recent experience and corporate earnings remain buoyant. This has left the information technology sector back in the middle of the 2020-26 range, but off the 2025 highs and prompted the question of how the Open AI and Anthropic IPO’s will be received after Space X IPO. Revenue for AI labs such as Anthropic and Open AI are booming, with Anthropic run rate reported to be up 500% since the start of the year. This exponential revenue growth allows analysts to deploy growth models that look out to 2030 to produce revenue and EBITA figures that can back the valuations for the next two IPO’s. Additionally, all three will be big tech stocks and will attract index funds that could quickly absorb the equity being raised in the IPO’s.
The three are different however (here). Anthropic has the best story having leapfrogged Open AI and seen to be the leader in business enterprise AI. Open AI has supporters and critics. Leadership in the consumer sector/large secured AI datacentres capacity to make the next leap forward/2nd place in the enterprise market. However, after USD180bln of funding raising, Open AI still need more funding to pay for huge semiconductor orders and cloud computing commitments. Space X is also mainly an AI trade in terms of Total Addressable Market. The problem is that Space X’s xAI subsidiary is lagging other AI labs. Space X did get an initial great reception, but then could go flat waiting for the Open AI and Anthropic IPO’s.
In terms of the overall U.S. equity market, the outlook for the non tech sector is also important. Corporate earnings have been better than we thought in 2026, which can always sustain short-term optimism. However, hopes of Fed rate cuts will likely be difficult to be realised in 2026. Though Warsh argues that productivity is high currently due to AI and will lead to disinflation, many FOMC members argue that the AI buildout could first boost inflation. The key problem for the non tech sector is if corporate earnings growth slows, with the biggest risk remaining that the overstretched low and middle income households could slow consumption growth (here). The latest GDP breakdown shows that income growth has been revised down and means a still lower household savings ratio (here). The other issue for the U.S. non tech sector is whether structurally AI means net job losses that hurt income then consumption and GDP. The trend in information technology and finance sectors shows that monthly net jobs have turned negative (here). Our view at this juncture is that the pace is somewhat quicker than the internet revolution that should bring some net jobs losses but not a jobs apocalypse, though with a risk of an AI voter backlash.
For the S&P500, we remain less concerned about high valuation in the tech sector provided AI labs growth remains fast. 12mth fwd information technology P/E’s are mid-range in the 2020-26 experience rather than at the highs. The one drag on U.S. equities from the AI story is the shrinking free cash flow for big tech and Alphabet/Meta raising equity funds alongside the three mega IPO’s. This lessens the technical net buybacks dynamics that has lifted the market. Heavy equity issuance by tech companies and a shift of leadership from semiconductors to hyperscalers/AI labs can make tech and the S&P500 more volatile from H2 2026 onwards. Capacity bottlenecks from chips to hard drives may slow the ability to scale revenue, and margins, which could also increase volatility of the tech story.
The main problem is more non tech in terms a cyclical slowdown in consumption due to lower real income growth. The S&P500 could run up to 7800-8000 in 2026, with small intermittent corrections and we have lifted our end year target from 7200 to 7700, but note the vulnerability in the non tech sector. It now appears more certain that AI labs explosive revenue growth will continue in 2027, but that household vulnerability will be greater. Congress will be split and unable to deliver new fiscal easing, which all leaves the non tech side of the economy with risks of a slowdown in corporate earnings. We thus look for a modest rally to 8200 for the S&P500 driven by tech by end 2027.
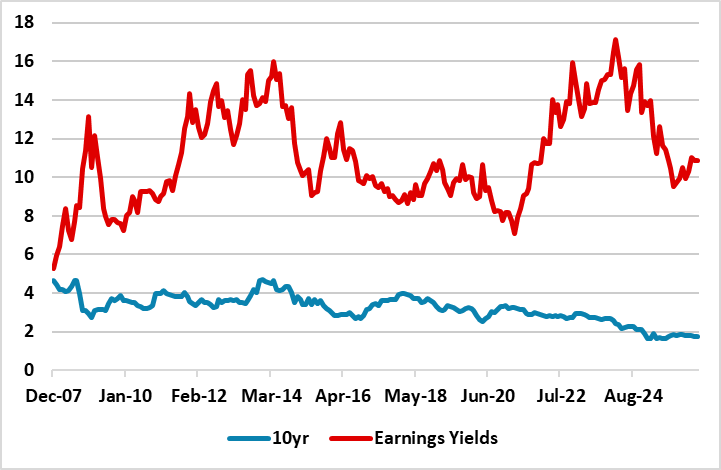
Figure 2: Germany/UK 12mth Earnings Yield minus 10yr Real Government Bond Yield (using 10yr breakeven inflation)
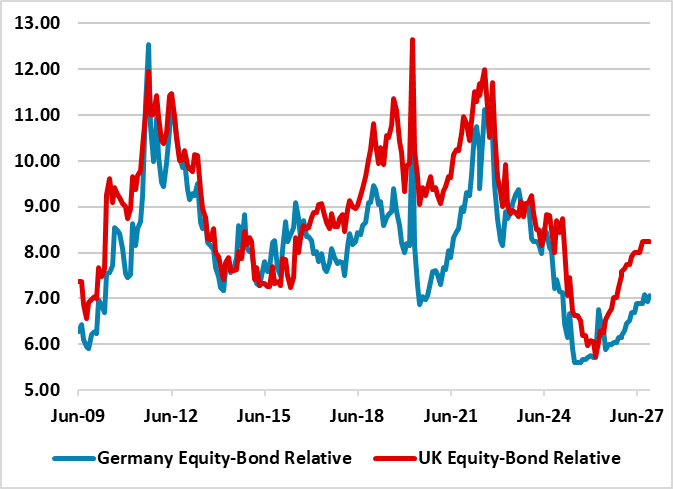
Source: Continuum Economics. Continuum Economics projections until end-2027 using 10yr breakeven inflation and Bund/Gilt yield forecasts.
EZ equities have rebounded from Iran war lows helped by the strong 2026 earnings momentum, despite the ECB hiking rates. The ECB are in a mini cycle and we actually feel they will cut twice in 2027, as they are overestimating growth and inflation risks. EZ gas prices will come down further after the interim agreement between the U.S. and Iran. However, 2027 corporate earnings prospects are softer than 2026, with no sign of the economy leaping to above trend growth. German defense and infrastructure spending is helpful, but counterbalanced by fiscal consolidation elsewhere. The market can push higher alongside the U.S., but this will either match the U.S. or lag the U.S. modestly. Equity only valuations are slightly above average and equity-bond valuations no longer cheap (Figure 2). A new positive catalyst would help, but a Ukraine peace deal remains unlikely in the next 12 months. EZ equities also have to deal with the May French presidential election in 2027. The odds remain that a non National Rally candidate wins, but with a lack of fiscal consolidation – a National Assembly election is unlikely before 2029, unless a National Rally candidate becomes president. The event risk surrounding the French presidential election however can prompt consolidation in spring 2027, given the importance for the EZ and EU.
Figure 3: Projection Until End 2027 (%)
Source: Continuum Economics
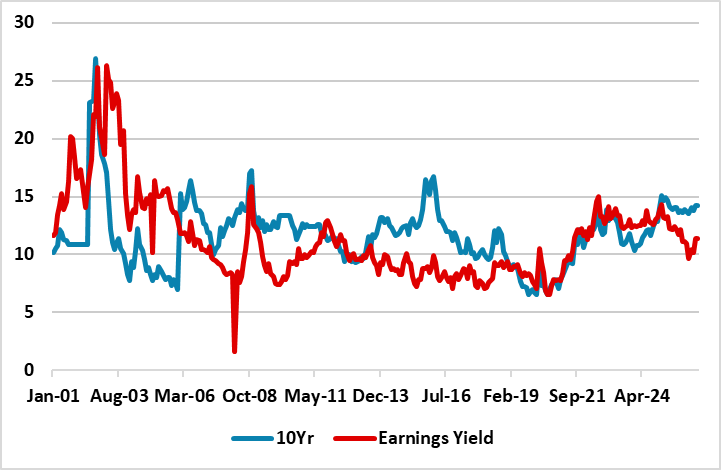
Japan has seen a sharp rebound from the Iran war lows, helped by a refocus on ongoing corporate reform and the domestic retail wave from the success of the NISA program. Continued growth combined with the end of deflation and return to modest inflation adds to the sense that Japanese equities can still run further. However, in equity only terms the market is now slightly overvalued on a 12mth fwd P/E ratio, while the earnings yield-bond yield differential has narrowed sharply (Figure 4) with the rally in equities and surge in JGB yields. We also worry that a major bounce in the JPY is likely in the next 6-18 months, given the scale of JPY undervaluation. Overall, we feel that Japanese equities will likely perform in line with the U.S. over the next 18 months.
Figure 4: Japan 12mth Earnings Yield minus 10yr Nominal Government Bond Yield (%)
Source: Datastream/Continuum Economics. UK real yield uses RPI instead of CPI.
Regarding UK equities, a contrast exists between the domestic and international stocks. The FTSE 100 can be buoyed by the new world reality that access to commodities is more important after the closure of the Straits of Hormuz for the past few months. Good dividend yields, plus an undemanding 12mth fwd P/E ratio means that FTSE100 will likely match the S&P500 in the next 18 months, despite the lack of tech exposure. The FTSE250 domestic forces are trickier. The UK economy is sluggish due to ongoing multi-year fiscal consolidation; a BOE readiness to hike if 2nd round inflation risks from the pick-up in energy prices occur and a prospective shift to the left for the government prime minister/chancellor (though likely with only a small easing of the fiscal rules). FTSE250 has lagged with these economic/fiscal and political concerns and is likely to still lag the FTSE100 in the next 6 months. However, 2027 could be better for the FTSE250 as we see UK disinflation allowing the BOE to deliver 50-75bps of easing.
Overall, other DM equity markets will likely not significantly outperform U.S. equities in 2026 and 2027, as less stretched valuations are offset by domestic economic and fiscal issues and underexposure to tech.
Emerging Markets
China’s AI applications are attracting a lot of attention and investment. Upstream AI companies progress is fueling optimism, while the big platforms downstream are getting good adoption but have questions over a road to profitability. Combined with the domestic semiconductor improvement, this can see Chinese equities pushing higher in the next 6-18 months helped by U.S. tech optimism. However, U.S. AI models will open a gap in the next 6-18 months with Nvidia Blackwell and Rubin chips that are not available in China. Green energy and advanced manufacturing are other bright sectors for China and the equity market. However, we remain cooler towards the equity market outside these sectors. As we highlighted in the China outlook, households are only showing modest consumption due to adverse wealth effects from the housing bust/slow job and wage growth and insufficient government safety nets. Though the negative drag from residential investment will be less in 2026/27, the housing market has not bottomed. Excess production against this soft domestic demand means that underlying competitive pricing remains and nominal GDP is in the 5-6% region. Corporate earnings estimate for 2026 have been coming down, but still look too high.
The positives for the non tech sector are that valuations are fair on a 12mth fwd basis and still cheap versus low yielding government bonds (Figure 5). Additionally, the risk of a trade war with the U.S. is low with Trump sensitive to China’s leverage of rare earth minerals and the trade truce extended. Though a comprehensive trade deal remains unlikely, the truce can hold through 2027 and help China competitive export sector. On Taiwan, an invasion or blockade by China would severely hurt equities, but this remains highly unlikely and we only attach a 5-10% probability in the next 18 months (here). Overall, we see the optimism over China AI, combined with valuations, helping to see China equites perform in line with the U.S. or a slight outperformance versus the U.S. over the next 6-18 months (Figure 4).
Figure 5: China 12mth Fwd Earnings Yield v 10yr Nominal Government Bond Yield (%)
Source: Continuum Economics. CAPE Earnings Yield-10yr Real government bond yield
India’s equities underperformance continues through 2026 on exposure to energy/fertilizer imports through the Straits of Hormuz and slowing corporate earnings. Additionally, EM funds are underweight India with China back in favor; favoring Latam on commodities and AI optimism for Taiwan and S Korea. Concerns are also growing that India’s IT services sector could be a net AI loser. However, market valuations are now less overstretched and India’s equity to bond yield spread is now slightly favorable again. Some further multiple compression can be seen, but 18 has normally been a bottom for the 12mth fwd P/E ratio since 2020. Corporate earnings growth can feedthrough into moving the market higher rather than feeding into P/E compression. The U.S./Iran deal to reopen the Straits of Hormuz will likely be a positive catalyst in the next 3 months. However, a multi-day war between India and Pakistan over Kashmir claims is likely in the next 3-12 months, but not a long war. This could cause another correction. Overall, we see India outperforming the U.S. over the next 6-18 months and especially 2027, when the 2025-26 woes will have receded. By end 2027, this will likely be a cumulative 10%.
Figure 6: Brazil 12mth Fwd Earnings Yield v10yr Nominal government Bond Yield (%)
Source: Datastream/Continuum Economics.
Brazil’s equity optimism has been tempered by improvement by Lula in the opinion polls against Flavio Bolsonaro (Banco Master scandal and Trump administration new tariff threats) and BCB slowing of easing with GDP growth/demand inflation remaining inconsistent with the 2027 inflation target being achieved. This will slow the rally through the summer. Additionally, the momentum over the last 12 months has pushed the earnings yield below the 10yr government bond yield (Figure 5) and this is also a headwind to rapid gains. However, the presidential race is still too close to call at this stage and a Flavio Bolsonaro victory would reignite optimism. Additionally, good corporate earnings growth in 2026 means that the fwd P/E ratio is still cheap versus history, while Brazil is seen to be a strategic commodity exporter that is away from geopolitical flashpoints and helping long-term optimism. Modest outperformance versus the U.S. can be seen in the remainder of 2026. 2027 could see greater outperformance versus the U.S., as we see inflation pressures easing and then leading to more cumulative BCB easing in 2027. Combined with some post-election fiscal consolidation, this can bring 10yr yields lower and help allow a decline in the earnings yields/rise in the fwd price/earnings ratio. By end 2027, Brazil can outperform the U.S. by 15-20%.