EZ HICP Preview (Jan 5): More Core Disinflation Signs Even As Headline HICP Jumps on Energy Base Effects?
There has been repeated positive EZ news in the form of plunging inflation. Coming in lower than envisaged for the third successive month, the November HICP inflation dropped 0.5 ppt to a 28-month low of 2.4% (Figure 1), all symptomatic of a plunge in inflation that is occurring faster and more broadly than had been ECB thinking, now encompassing falling core rates and softer persistent inflation signals, the latter a key consideration for the ECB (Figure 2). The path ahead may not be smooth as energy base effects in December could see the headline tick higher by 0.3-0.4 ppt, but only on a short-lived basis as the fall will resume into 2024. This trend is being helped by the fall in fuel prices (Figure 3). We see the December core steady at 3.5%, while the ECB implies a rise of around 0.25 ppt and a slightly higher headline outcome than our expectation!
Figure 1: Headline and Core Inflation Ease Further?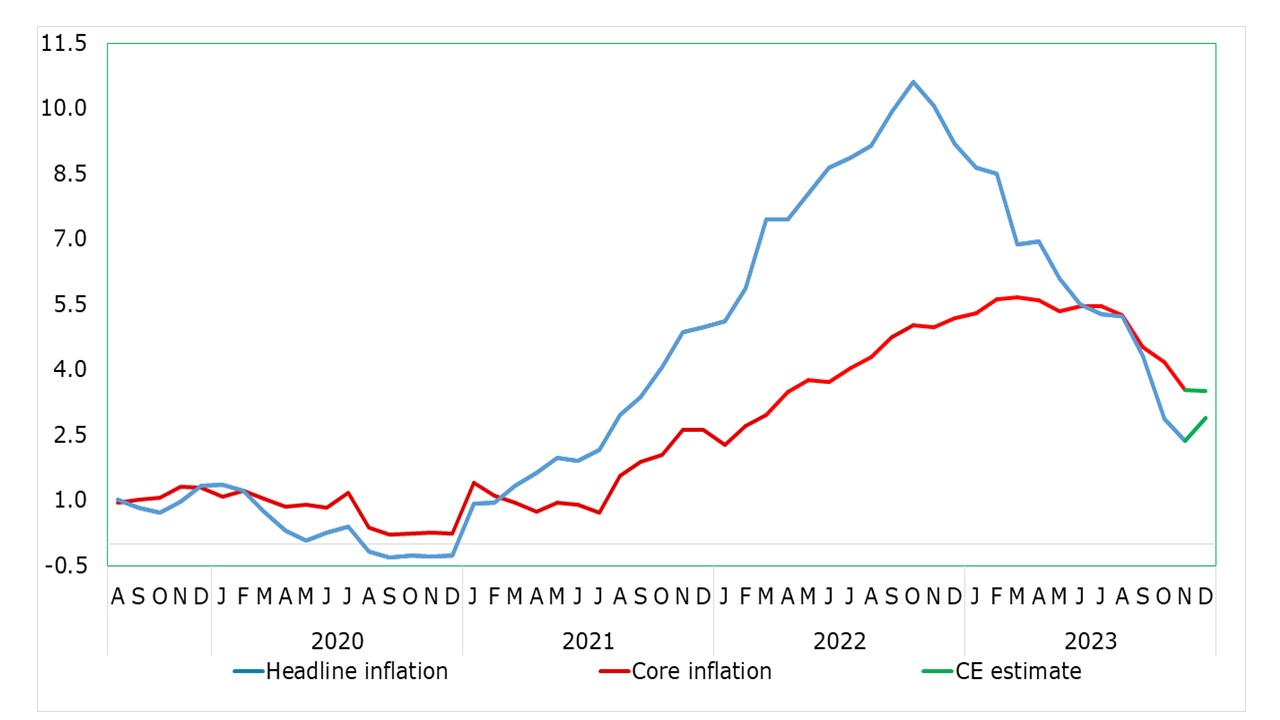
Source: Eurostat, Continuum Economics
ECB Take Note!
Indeed, we now envisage that the headline may now hit target by mid-2024, well over a year earlier than the ECB envisages, while the core should continue to fall in the interim regardless. There are ever-clearer signs of softer underlying inflation both in terms of persistent price pressures (Figure 2) which are now running below the 2% target, but also in current core measures where the adjusted m/m rate is also well below target. All corroborate a clear loss of pricing power which we suggest reflects both supply and demand issues.
Baseless Base Effects
Indeed, in these November HICP data, the core rate hit an 18-month low 0f 3.6%, down 0.6 ppt on the month and down two ppt in the last 3-4 months. But this disguises an even clearer fall in recent price dynamics, as seen in m/m seasonally adjusted data (Figure 2), and with the smoothed core rate now consistent with an undershoot of the 2% target, actually down to 0.1% in m/m terms. The ECB instead continues to (at least overtly) focus on y/y rates despite the ensuing limitations from spurious base effects. Highlighting this, President Lagarde used the recent Council press conference to underscore that ‘This month, inflation is likely to pick up on account of an upward base effect for the cost of energy. In 2024, we expect inflation to decline more slowly because of further upward base effects. In other words the ECB is letting its inflation analysis be affected as much (if not more) by developments that happened up to 12 months ago rather than in the last month or so.
It could be argued that using m/m adjusted data would place too much emphasis on what may be an aberrant monthly observation. But this related to y/y rates too as the base effects may just as much reflect aberrant observations. In addition using a smoothed (ie 3-mth mov avg) would give a clear idea of recent trends when using adjusted m/m data (as we have been using for some time). Notably the core rate on this basis has been running at less than 0.1% m/m for the last few months on average.
Figure 2: Persistent Price Pressures Ebbing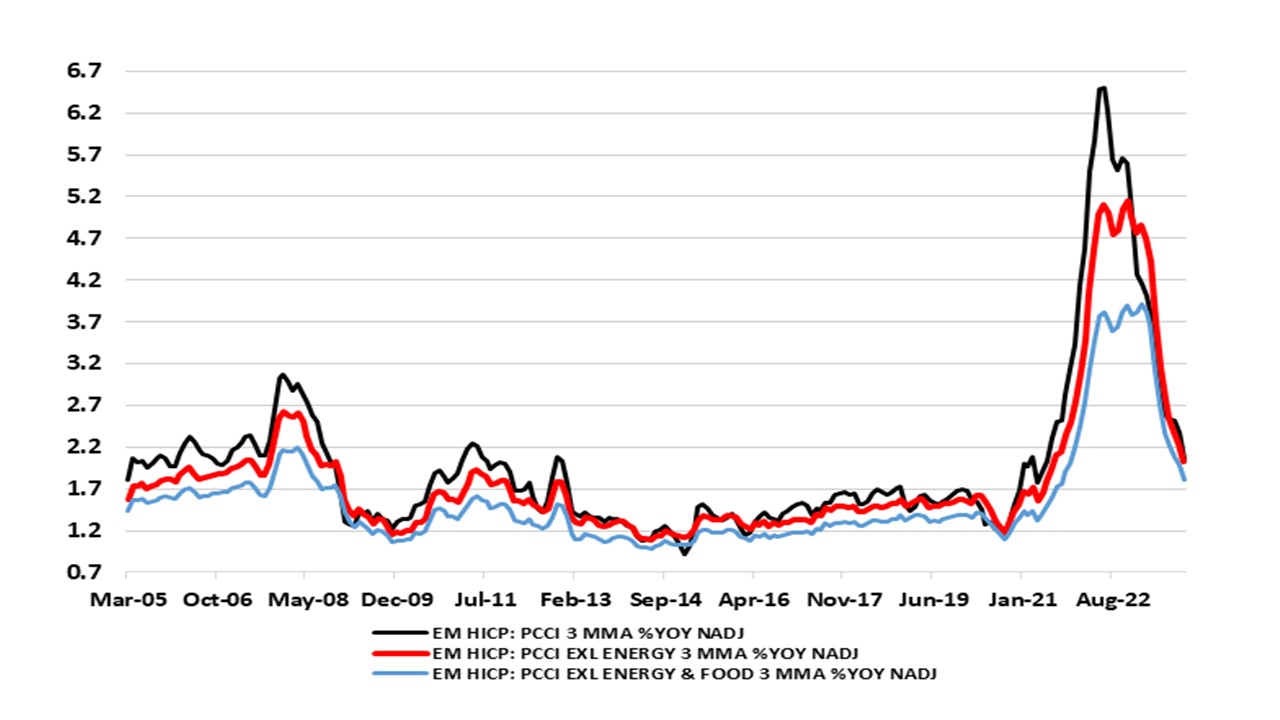
Source: ECB, Continuum Economics, PCCI is Persistent and Common Component of Inflation