DM FX Outlook: JPY weakness to reverse
· Bottom Line: Q1 has seen a generally seen a rangebound USD against riskier currencies, but JPY weakness has resumed in spite of a BoJ rate hike and narrowing yield spreads. This reflects continued positive risk sentiment in developed market equities, but we still expect JPY strength to come through in the rest of the year. The USD is also likely to soften gradually against the riskier currencies as the Fed eases.
· On EUR/USD, we expect a 90bp decline in U.S. 2 year yields by the end of 2024, compared to just 65 bps in German 2 year yields, and this should support some further gains in EUR/USD. We forecast 1.15 end 2024 and 1.20 for end 2025.
· Forecast changes: We have raised our USD/JPY forecast for 2024 year end to 135 from 125 to reflect the resilience of risk sentiment, but this of course still represents substantial JPY strength.
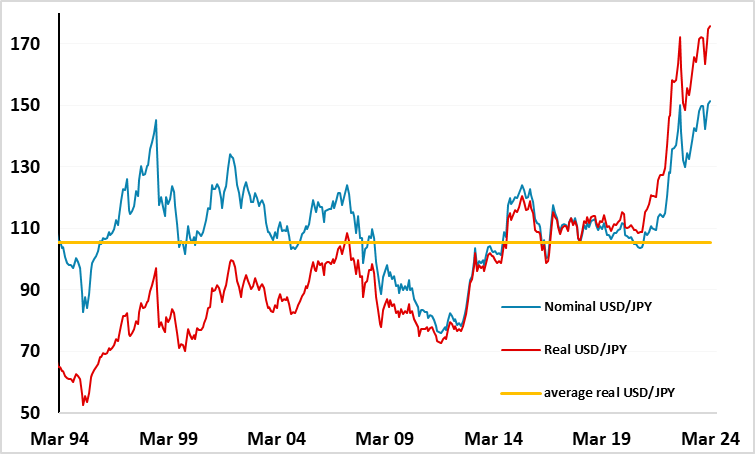
Figure 1: Real effective exchange rates

Source: BIS
JPY weakness has been dramatic
The JPY has fallen more than 30% in real effective terms against other major currencies in the last 3 years, as a result of the rise in inflation seen in the U.S. and Europe and the consequent rise in interest rates in the rest of the developed world. The rising nominal yield spreads in favour of other developed currencies have driven the JPY lower, but relatively low Japanese inflation has meant that the JPY has fallen even further in real terms than it has in nominal terms. USD/JPY has risen around 13% more in real terms than in nominal terms in the last 3 years.
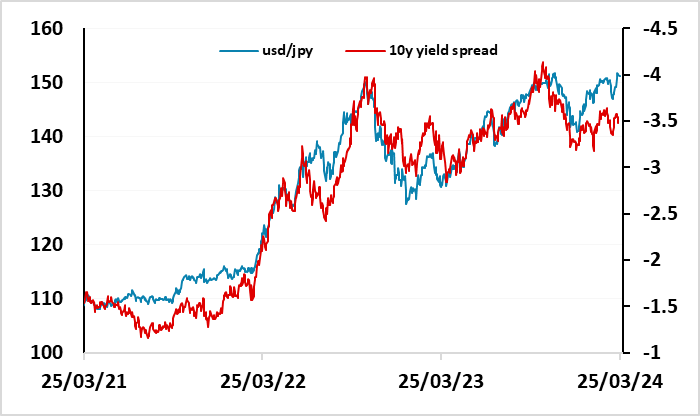
JPY weakness has resumed but is no longer supported by yield spreads
The JPY has fallen more than 30% in real effective terms against other major currencies in the last 4 years, as a result of the rise in inflation seen in the U.S. and Europe and the consequent rise in interest rates in the rest of the developed world. The rising nominal yield spreads in favour of other developed currencies have driven the JPY lower, but relatively low Japanese inflation has meant that the JPY has fallen even further in real terms than it has in nominal terms. USD/JPY has risen around 13% more in real terms than in nominal terms in the last 3 years.
Figure 2: Real and nominal USD/JPY

Source: Continuum Economics/Datastream
However, at the beginning of 2024 the JPY has fallen even further than suggested by the moves in yield spreads. US/Japan spreads have widened only very modestly, but USD/JPY is testing the highs above 150. Germany or Eurozone/Japan spreads are little changed since the beginning of the year, but EUR/JPY has hit 16 year highs. Some of this may simply represent a reluctance of those committed to the short JPY trade that has been so successful in recent years to give up on the trend. However, the JPY weakness also seems to be related to the continued resilience of equity markets, declining equity risk premia and the attractiveness of carry trades in a risk positive environment.
Figure 3: USD/JPY outperforming yield spreads

Source: Continuum Economics/Datastream
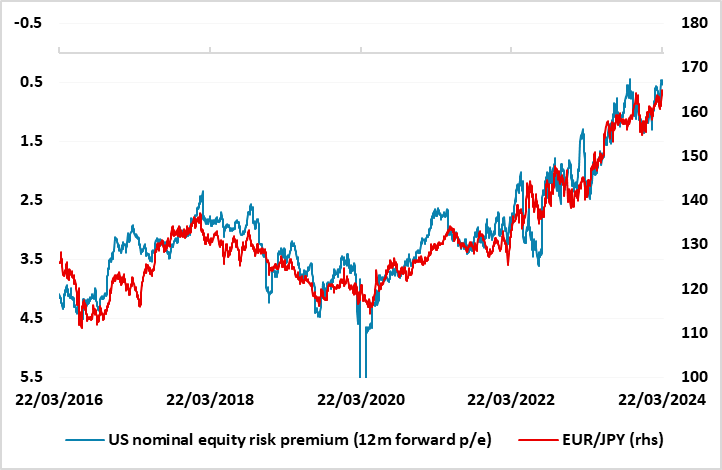
Figure 4 illustrates how EUR/JPY has moved in line with the decline in US equity risk premia over the last 8 years. The risk premium has continued to decline this year as US yieldshave edged back up but US equities have continued to show strength helped by solid US growth numbers and strength in tech sector earnings, and helped by optimism about the impact of AI. Such a persistent correlation is hard to oppose, but we would emphasise that this isn’t really based on fundamentals. The correlation was far less clear before 2016, and there is no fundamental reason why the JPY should suffer relative to the EUR in a more risk positive market. We would expect the relationship to break as Japanese yields rise with further BoJ tightening this year and the ECB start to ease. Yield spreads already suggest EUR/JPY has risen far too much, and there is scope for a substantial move lower. Even so, we do expect resilience in equity markets to continue, and this may limit the enthusiasm for lower yielders and safe havens in general, limiting the JPY upside, which is why we have reduced our expectations for JPY gains this year, although a move to 135 in USD/JPY is still a substantial JPY rise.
Figure 4: EUR/JPY rising as US equity risk premia decline

Source: Continuum Economics/Datastream
USD to see modest decline elsewhere
EURUSD has held a 1.07-1.10 range through Q1, with fluctuations in yields being broadly similar both sides of the Atlantic. However, we still slightly favour the EUR upside going forward as we expect US yields to fall a little more than EUR yields through the year (2yr EUR yields are discounting a lot of ECB easing here). EUR/USD also remains somewhat undervalued from a longer term perspective, and the EUR terms of trade have improved somewhat with the decline in gas prices in the last year, with the Eurozone current account consequently back in substantial surplus. However, there are a lot of geopolitical uncertainties related to the Ukraine war and the US election. If Trump were to win the US election, the EUR could suffer from concerns about the impact on NATO and the region’s security, with a Trump victory also likely to be a negative for Ukraine. However, this remains uncertain, with the election still looking like a 50-50 call, so our central view focuses on the likely yield spread contraction and the improvement in terms of trade as the drivers.
Figure 5: EUR/USD to rise as 2 year yield spreads fall

Source: Continuum Economics/Datastream
CHF softer after SNB rate cut, bit downside limited except against the JPY
The SNB has been the first of the major central banks to cut rates this year, triggering a sharp CHF decline. However, the downside form here looks more limited, as the Swiss rate cut is likely to be followed by rate cuts in the US and elsewhere in Europe through the rest of the year. Indeed, the rate cuts elsewhere are ultimately likely to be larger than the Swiss cuts, so it’s hard to make a strong case for a weaker CHF due to rate differentials, especially since the CHF generally has shown minimal correlation with interest rate differentials in recent years. Also, while the CHF has seen significant nominal gains in the last few years, this has essentially reflected the relatively low Swiss inflation rate and the CHF has not appreciated significantly in real terms either against the EUR or on a trade-weighted basis. So the initial CHF weakness after the March rate cut may not see much extension. But there is plenty of scope for the CHF to weaken against the JPY, as the CHF has appreciated substantially against the JPY in both real and nominal terms (see Figure 1).
GBP starting to show some signs of weakness
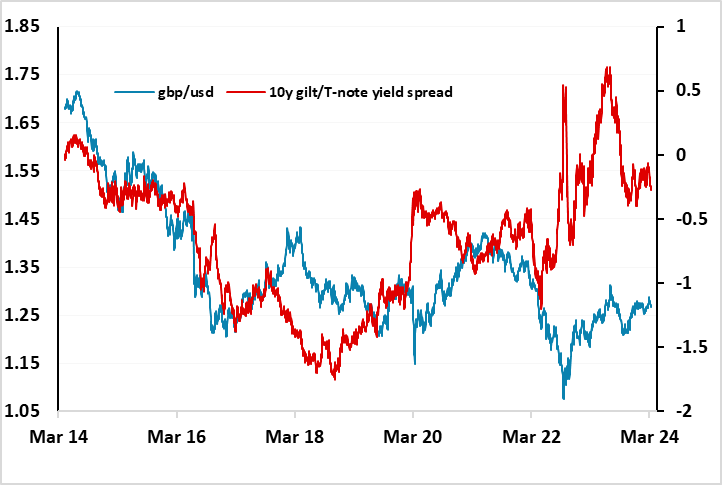
GBP started to slip a little lower after the March MPC meeting, and we do see some scope for further declines as the market starts to price in a more similar rate cutting cycle on the UK to that seen in the US and Eurozone. EUR/GBP continues to look a little low relative to current and prospective short term yield spreads, while net long GBP positioning also looks extended in the CFTC data. However, from a bigger picture perspective there may be some support for GBP from the approach of the UK election, which has to be called by January 2025 but we suspect will be in October this year. This is likely to produce a Labour government, and could be seen as a positive inasmuch as it increases the chances of the UK forming a closer relationship with the EU and reducing any damage from Brexit. There has also been a break in the usual correlation between the UK/US yield spread and GBP/USD in the last couple of years, which suggests some risk premium inherent in GBP (see Figure 6). This was most pronounced during the brief Truss administration, but has persisted through the last couple of years. The rationale behind this is unclear, but a change of government might provide a reason for the risk premium to decline. Nevertheless, our central view is that GBP will weaken against the EUR, and from a longer term valuation perspective GBP is if anything overvalued against the EUR, so if GBP/USD close the gap it is likely to be on the back of a stronger EUR/USD.
Figure 6: Some risk premium in GBP/USD?

Source: Continuum Economics/Datastream