U.S. Q1 GDP shows solid underlying momentum and continued inflationary pressure
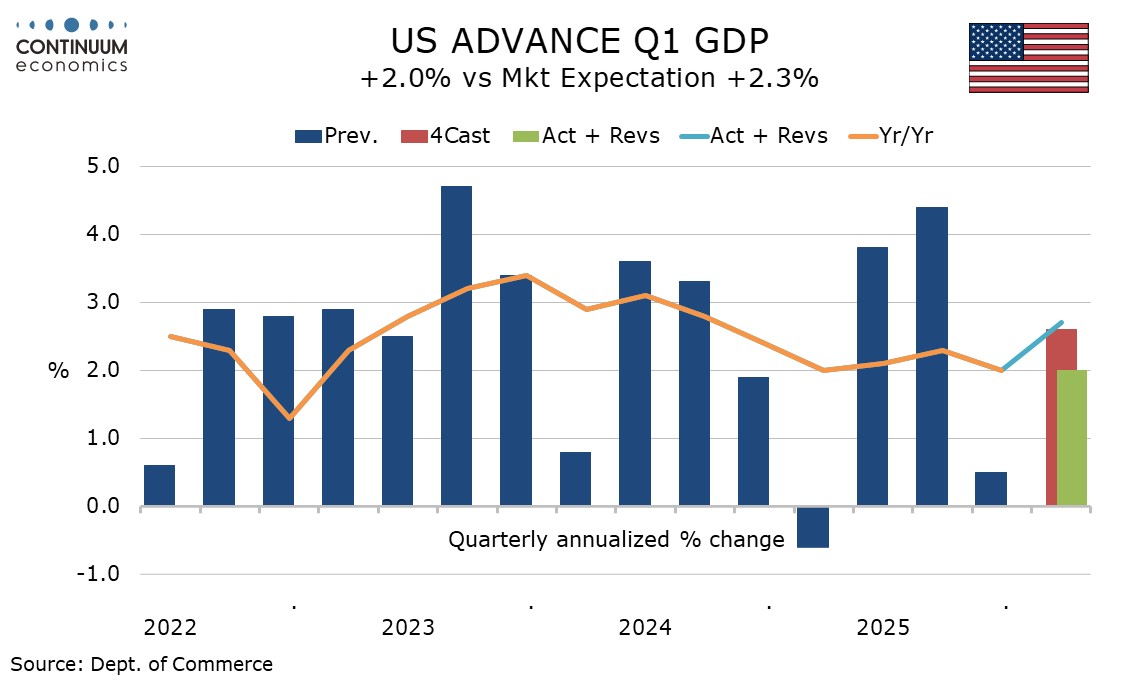
The advance estimate of Q1 GDP at 2.0% annualized is slightly weaker than expected and not an impressive bounce from Q4’s 0.5% which was restrained by a government shutdown. However the detail suggests respectable growth, as do stronger than expected March personal income and spending, and most importantly, sharp falls in weekly initial and continued claims. Q1 PCE prices and employment cost data meanwhile show continued inflationary pressures.
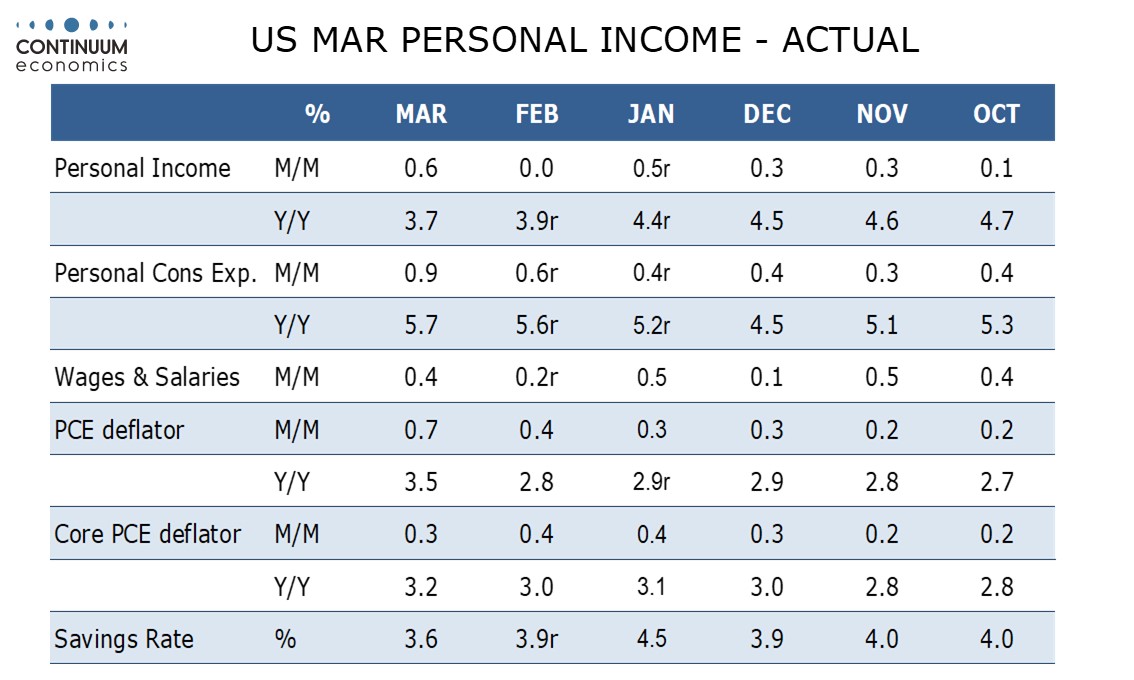
Q1’s increase in consumer spending at 1.6% was unimpressive but stronger than we expected. March personal spending was in line with our expectations with a 0.9% nominal, 0,.2% real increase, but with upward revisions to January and February. March personal income was stronger than expected at 0.6% nominal, -0.1% real. Wages and salaries rose by 0.4% with the overall gain assisted by a large bounce in farm income, which looks like compensation for tariff damage. Real disposable income, also assisted by upward revisions, rose by 1.5% in Q1, almost matching spending.
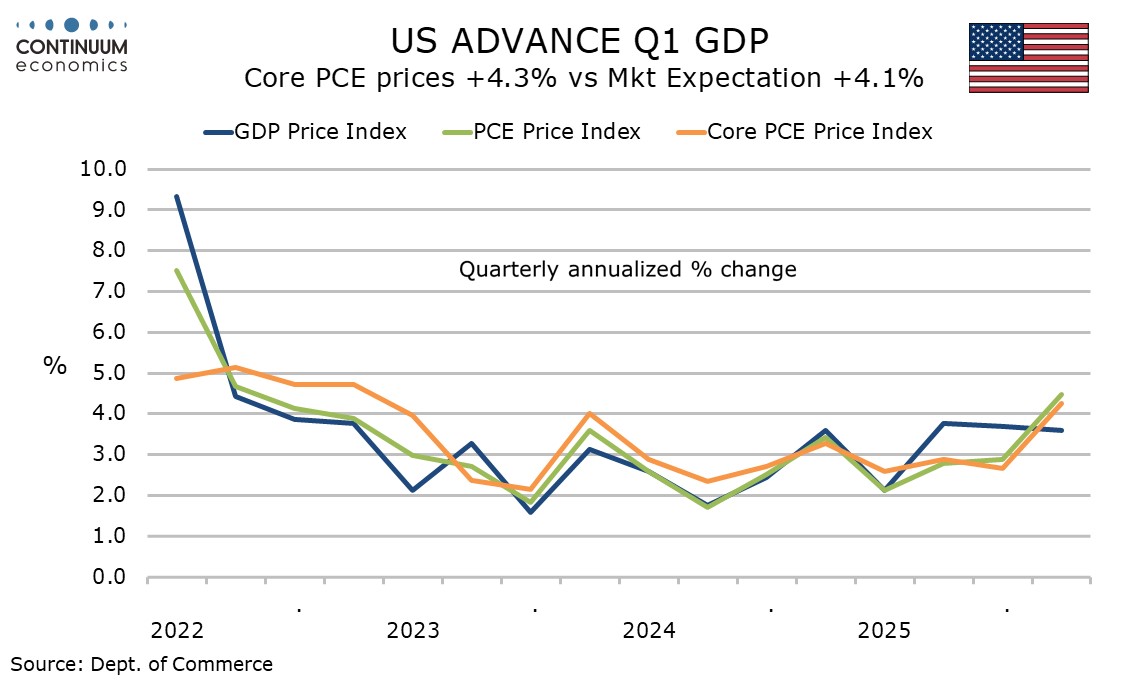
Core PCE prices rose by an as expected 0.3% in March, 0.29% before rounding, after two straight gains of 0.4%, but Q1 at 4.3% was slightly stronger than expected with January data revised a little higher before rounding. Overall PCE prices rose by 0.7% as expected in March with Q1 at 4.5% annualized. March yr/yr data shows overall PCE prices at 3.5% and the core at 3.2%, both well above the 2.0% target. The GDP price index at 3.6% annualized was less strong in Q1 than PCE prices, with prices for investment and government losing momentum, the latter after a strong Q4.
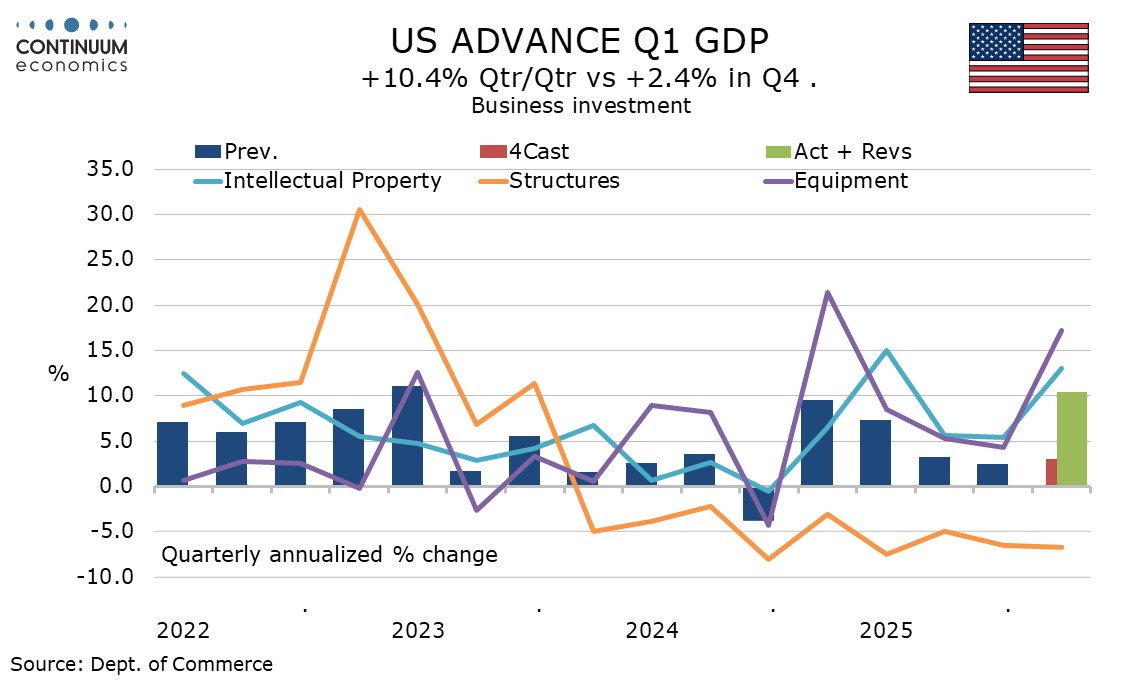
Business investment was significantly stronger than expected with a rise of 10.4%, equipment surging by 17.2% and intellectual property by 13.0%, outweighing a ninth straight negative of -6.7% from structures. Housing investment however, with a fall of 8.0%, a fifth straight decline, was significantly weaker than we expected.
Government with a 4.4% increase did not fully erase a 5.6% shutdown-induced decline in Q4, with defense surprisingly up only 2.3% after a 10.7% Q4 decline. Defense is likely to see a strong bounce in Q2. Final sales to domestic purchases (GDP less inventories and net exports) rose by 2.8% in Q1 after a 0.6% increase in Q4 while private sales to private domestic purchasers rise by 2.5%, also up from Q4’s 1.8%.
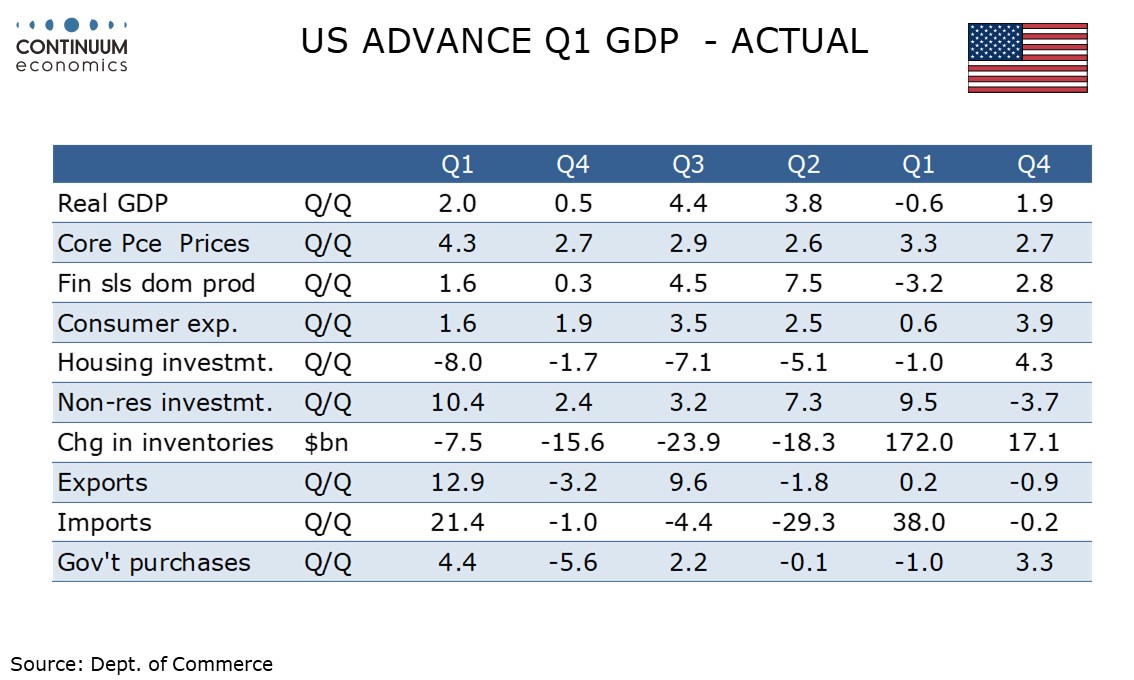
Final sales (GDP less inventories) rose by 1.6% meaning a modest positive from inventories. Inventories are still slipping after surging ahead of the tariffs, but at a slower pace, meaning a positive contribution to GDP. Net exports were a steeper negative than we had expected, and the main source of the downside GDP surprise, though both exports at 12.9% and imports at 21.4% showed strong increases.
Improved data for final sales to private domestic purchasers suggests the economy still has significant momentum in Q1. The energy price shock poses risks to Q2, but there is no sign of that in the latest initial claims data, with a sharp fall to 189k from 215k which has no easy explanation.
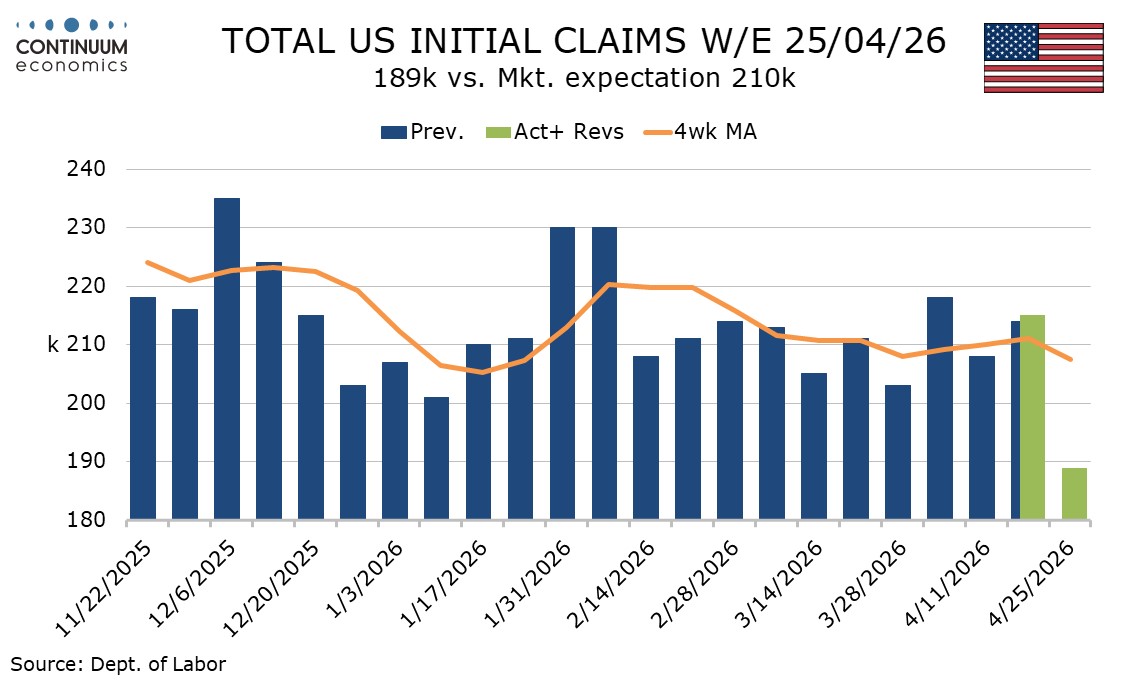
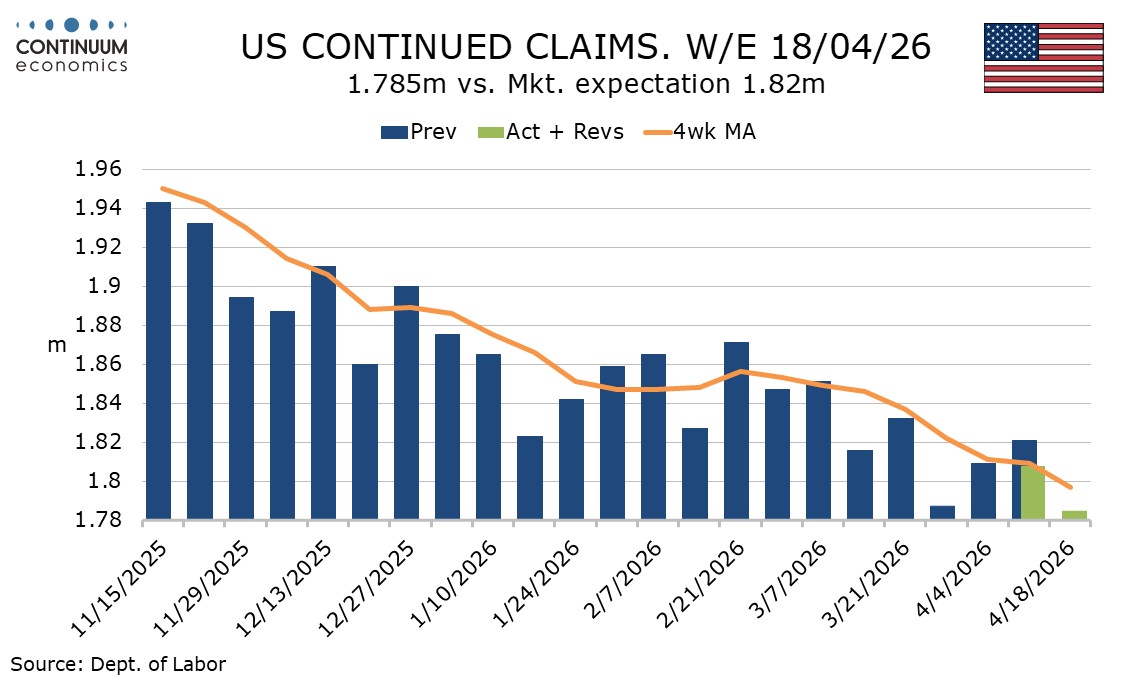
The initial claims data covers the week after April’s non-farm payroll survey, which saw the four week average almost unchanged from that in March’s survey week. However the latest continued claims data, down by 23k to 1.785m does cover the payroll survey week and extends a recent renewal of a downtrend that briefly paused in February.
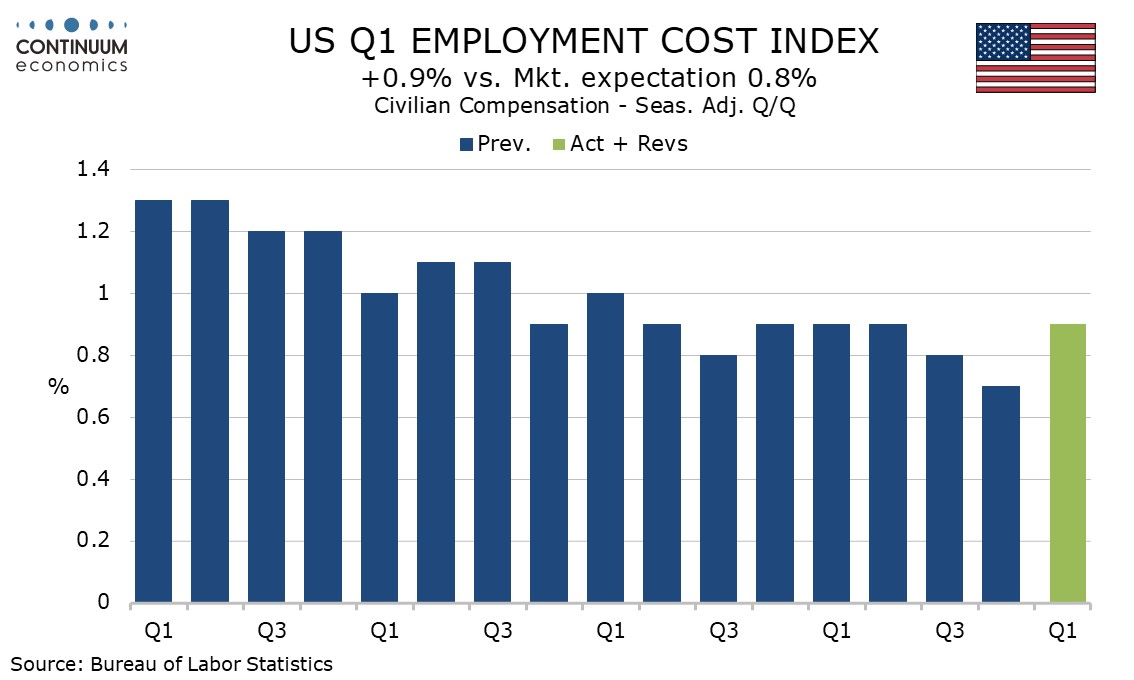
Adding to inflationary concerns in the Q1 PCE prices data is a slightly stronger than expected 0.9% rise in the Q1 Employment Cost Index, up from 0.7% in Q4. Wages and salaries rose by 0.8% but benefit costs saw an above trend gain of 1.2%. Q1 is the quarter in which health insurance premiums are updated.