DM Yield Curves and 2yr to Policy Rate Spreads
· The scale of the September yield rise was driven mainly policy rate tightening ideas and an extra real yield premium. However, the rise in bond volatility, plus the role of speculative funds appears to have amplified the move. Moderate or major bond positive news could see a partial correction in the yield rise, though 10yr JGB yields could be the exception given the excessive supply from huge BOJ QT. While we also see 2027 tightening fears as overdone, this is unlikely to be rethought until the key December Fed/ECB and BOJ meetings.
We have previously highlighted some of the forces driving up government bond yields (here), but could this have gone too far in recent weeks?
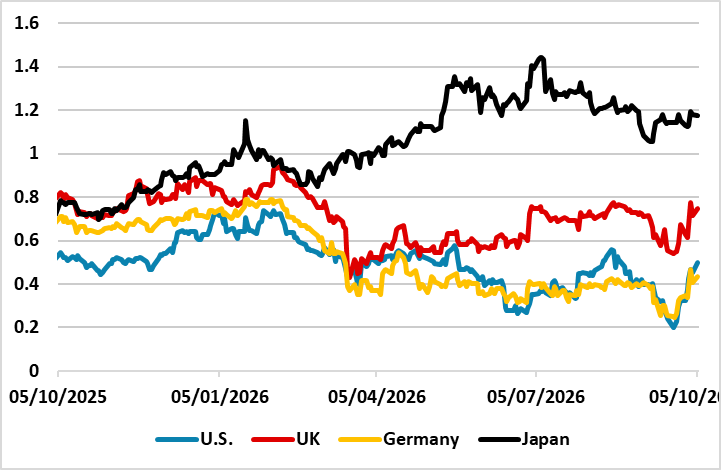
Figure 1: Big DM 10-2yr Yield Curve – Last 12 Months (%)
Source: Datastream/Continuum Economics
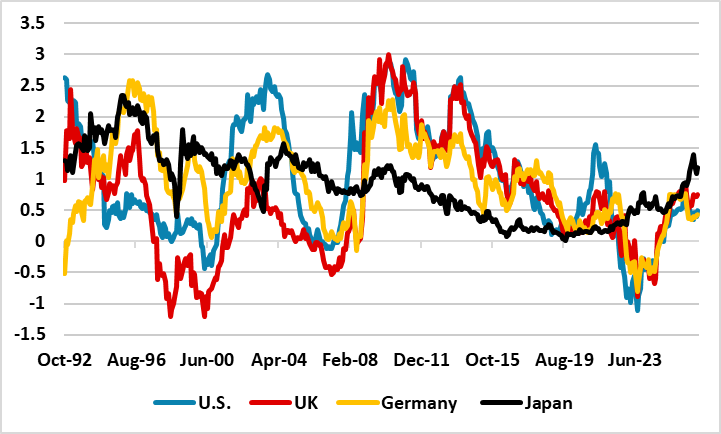
In the September DM Rates outlook (here), we argued that the main forces driving government bond yields higher had been a rethink on prospective policy rates and some extra real yield premium at the long-end of the curve. Looking at 10-2yr Big DM yield curves (Figure 1) over the past 12 months shows no major yield curve steepening except for Japan. Taking a long-term perspective (Figure 2), 10-2yr yield curves in the 1993-2007 period were steeper than currently – the 2008-2021 period occasionally had steep yield curves but with abnormally low 2yr and policy rates.
Figure 2: Big DM 10-2yr Yield Curve – The Long Term (%)
Source: Datastream/Continuum Economics
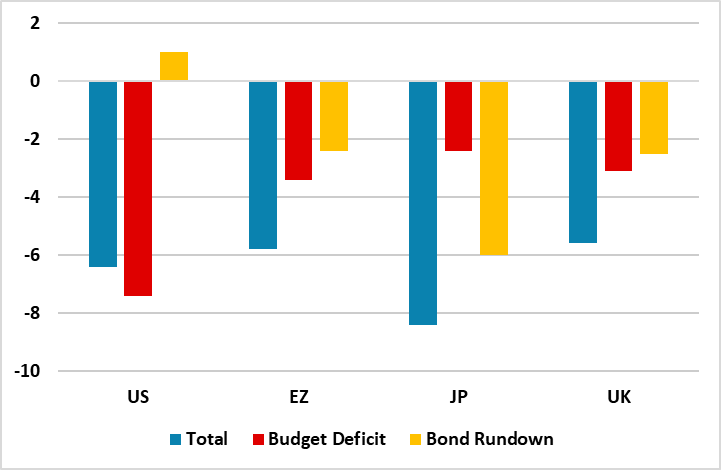
Japan 10-2yr yield curve is however is relatively steep, despite money market discounting 75bps of BOJ hikes in by end 2027. We continue to point out that BOJ QT is excessive at 6% of GDP (Figure 3) and is causing excess supply pressures compare to other major DM government bond markets (here). It is also worth remembering that though the U.S. budget deficit is excessive and unlikely to be corrected after the mid-term elections, the Fed is growing bond holdings in line with currency in circulation and nominal GDP in contrast to other DM central banks.
Figure 3: Big DM Budget Deficits and QT (% of GDP)
Source: Continuum Economics
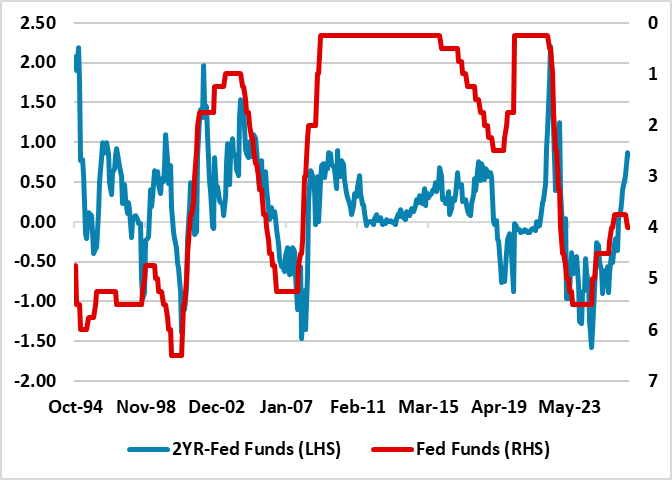
Meanwhile, looking at 2yr-policy rate spread shows that the front-end could have discounted too much tightening from the Fed, ECB and BOE. In the U.S., money markets are discounting 25bps hikes in December, March and June 2027. If the Fed hike in December, but dampen 2027 rate hike ideas it could cause a decline in 2yr U.S. Treasuries (Figure 4 shows that the end of mini tightening cycles normally see a narrowing of 2yr-policy rate). Near-term if the September core CPI is controlled, then it could reinforce the idea that the Fed will hold in October and may not hike after December. For 2 and 10yr yields, it also worth noting that crude oil flows through the Straits of Hormuz are improving (as Iran effectiveness is lower) and this is helping temper crude oil prices. Finally, the scale of the selloff in U.S. Treasuries has been amplified by the spike in volatility and also the reduced quality of long-term U.S. holders as hedge funds hold more Treasuries. If an economic catalyst is seen, this can produce a partial reverse of the September yield rise – partial as the market needs to see the Fed dots in December to decide on 2027 policy prospects.
Figure 4: 2yr U.S. Treasury to Fed Funds Policy Spread Versus Inverted Fed Funds Rate (%)
Source: Datastream/Continuum Economics
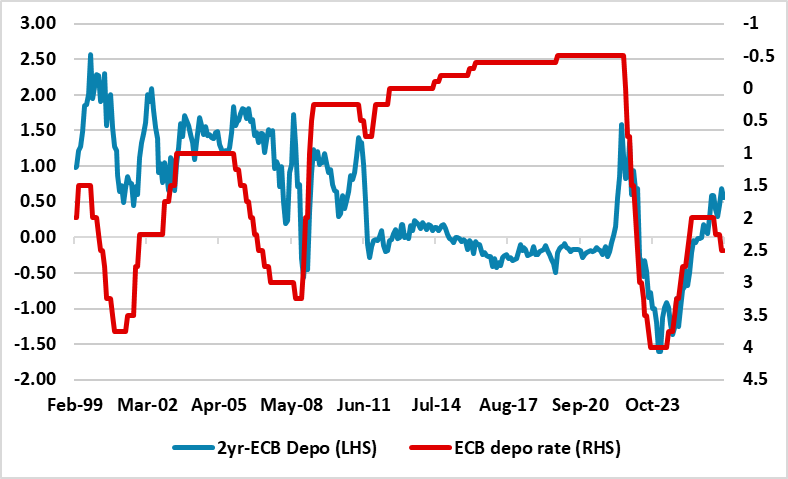
In the EZ, 25bps hikes are only fully discounted in Feb 4 and April 29 2027 ECB meetings, as the French fiscal tensions have tightened financial conditions in some countries. Though more hopes exist of the 2027 French budget passing than 2025 or 2026 (here), French fiscal and political uncertainty will remain into 2027. Additionally, EZ wage inflation is consistent with the 2% target, while 2nd round effects from the Iran war remain unlikely. This could mean that the 2yr policy spread to ECB depo rate is too high and the market reduces the scale of tightening discounted. In turn this could ripple across the curve to reduce the scale of tension at the long-end. This is more likely at the December 17 rather than the October 29 ECB meeting. However, 10yr real Bund yields are lower than the U.S./UK and this is likely to be a modest correction lower in yields.
Figure 5: 2yr Bund to ECB Depo Rate Spread Versus Inverted ECB Policy Rate (%)
Source: Datastream/Continuum Economics
Finally, JGB’s are discounting 25bps BOJ rate hikes in December, April and October 2027. However, the BOJ have not given any signs that they will accelerate the slow pace of policy rate normalisation and we see the next 25bps hike coming at the March or April 2027 BOJ meeting (here). This could mean 2yr JGB yields come down in Q1 2027 though not sooner. Meanwhile, we fear that BOJ QT (Figure 2) is so large that it could cause a further spike higher in 10yr JGB yields to 3.25-3.50%, which could spill over via yield competition to some DM 10yr yields.