Back at 5%: Unpacking the US Treasury selloff
* USTs revisit the big psychological level after big selloff
* Sep move has been mainly policy led, with the curve responding
* Longer term trend has been a real risk premium story – with real rates backup led by additional risk/compensation/reduced scarcity effects. Breakeven inflation expectations less so.
* Outlook depends on a clash of forces and timescales. Oversold move could be responsive to either positive Iran surprise or a risk setback; longer term, pressures on neutral real rate and premium may need a new “unexpected financial shock” to halt multi-decade trend turn.
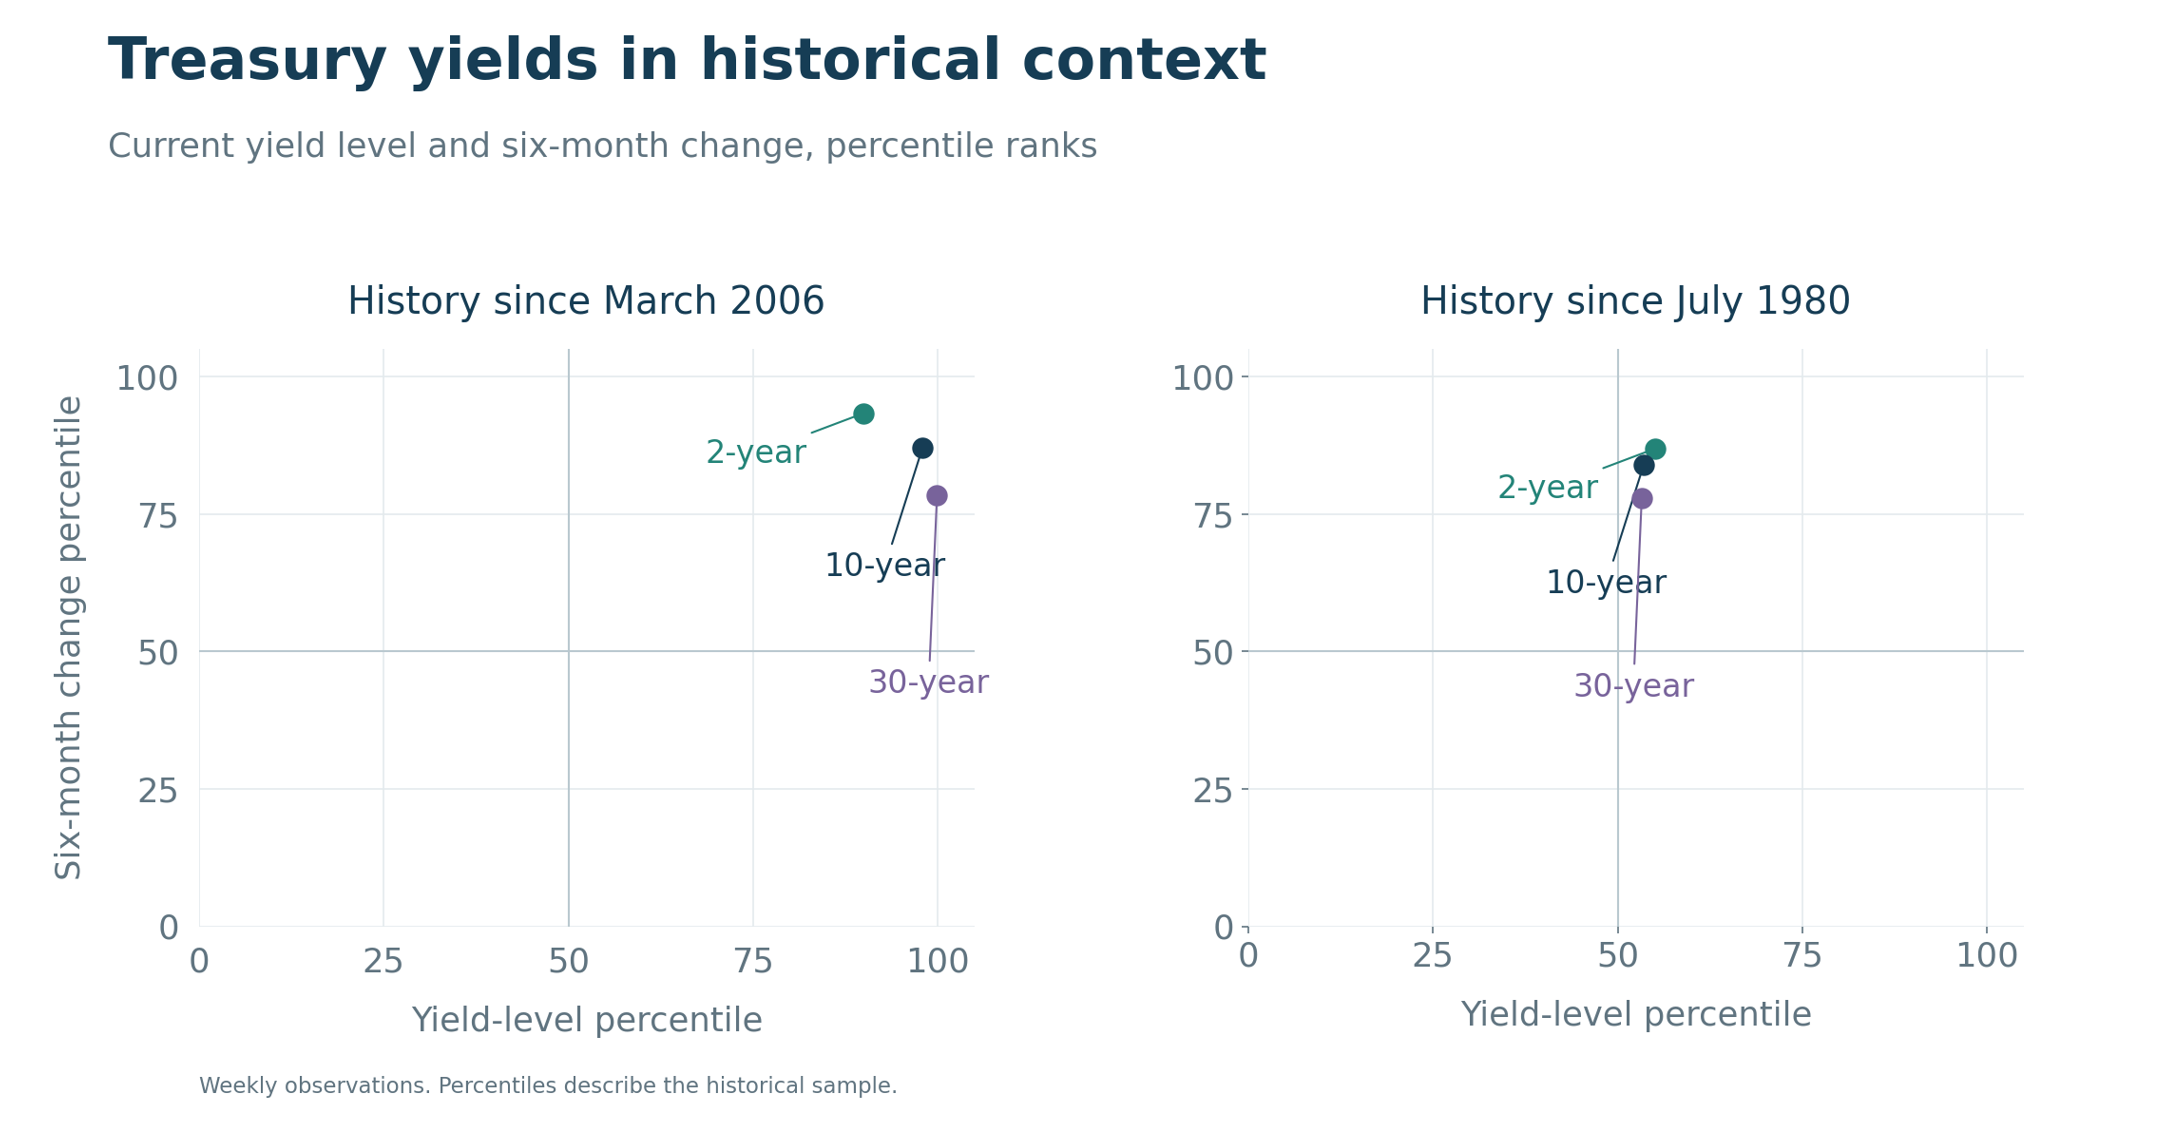
US Treasury yields are back at the psychological big 5% level. In level terms, from one perspective this may be viewed as simply completing the ‘normalisation’ of bonds back towards the middle of their post 1980s distribution. But the pace of re-pricing has been anything but average, with a yield jump towards the upper percentiles of the nearly half a century of action.
Figure 1: Shifts in US 10yr Treasury yield
Source: Datastream; CE; for similar analysis, see also Bruegel, ‘What’s driving the global rise in long-term interest rates’
Looking back at historical moves may seem like pointless ‘rear-view mirror’ analysis, but understanding what drove the action can help distinguish between factors that may persist or even extend, and those that may prove temporary, or at least choppy, in different scenarios. Looking at September to date, the past six months and the adjustment since 2024 reveals several overlapping stories across the different time frames and yield breakdowns.
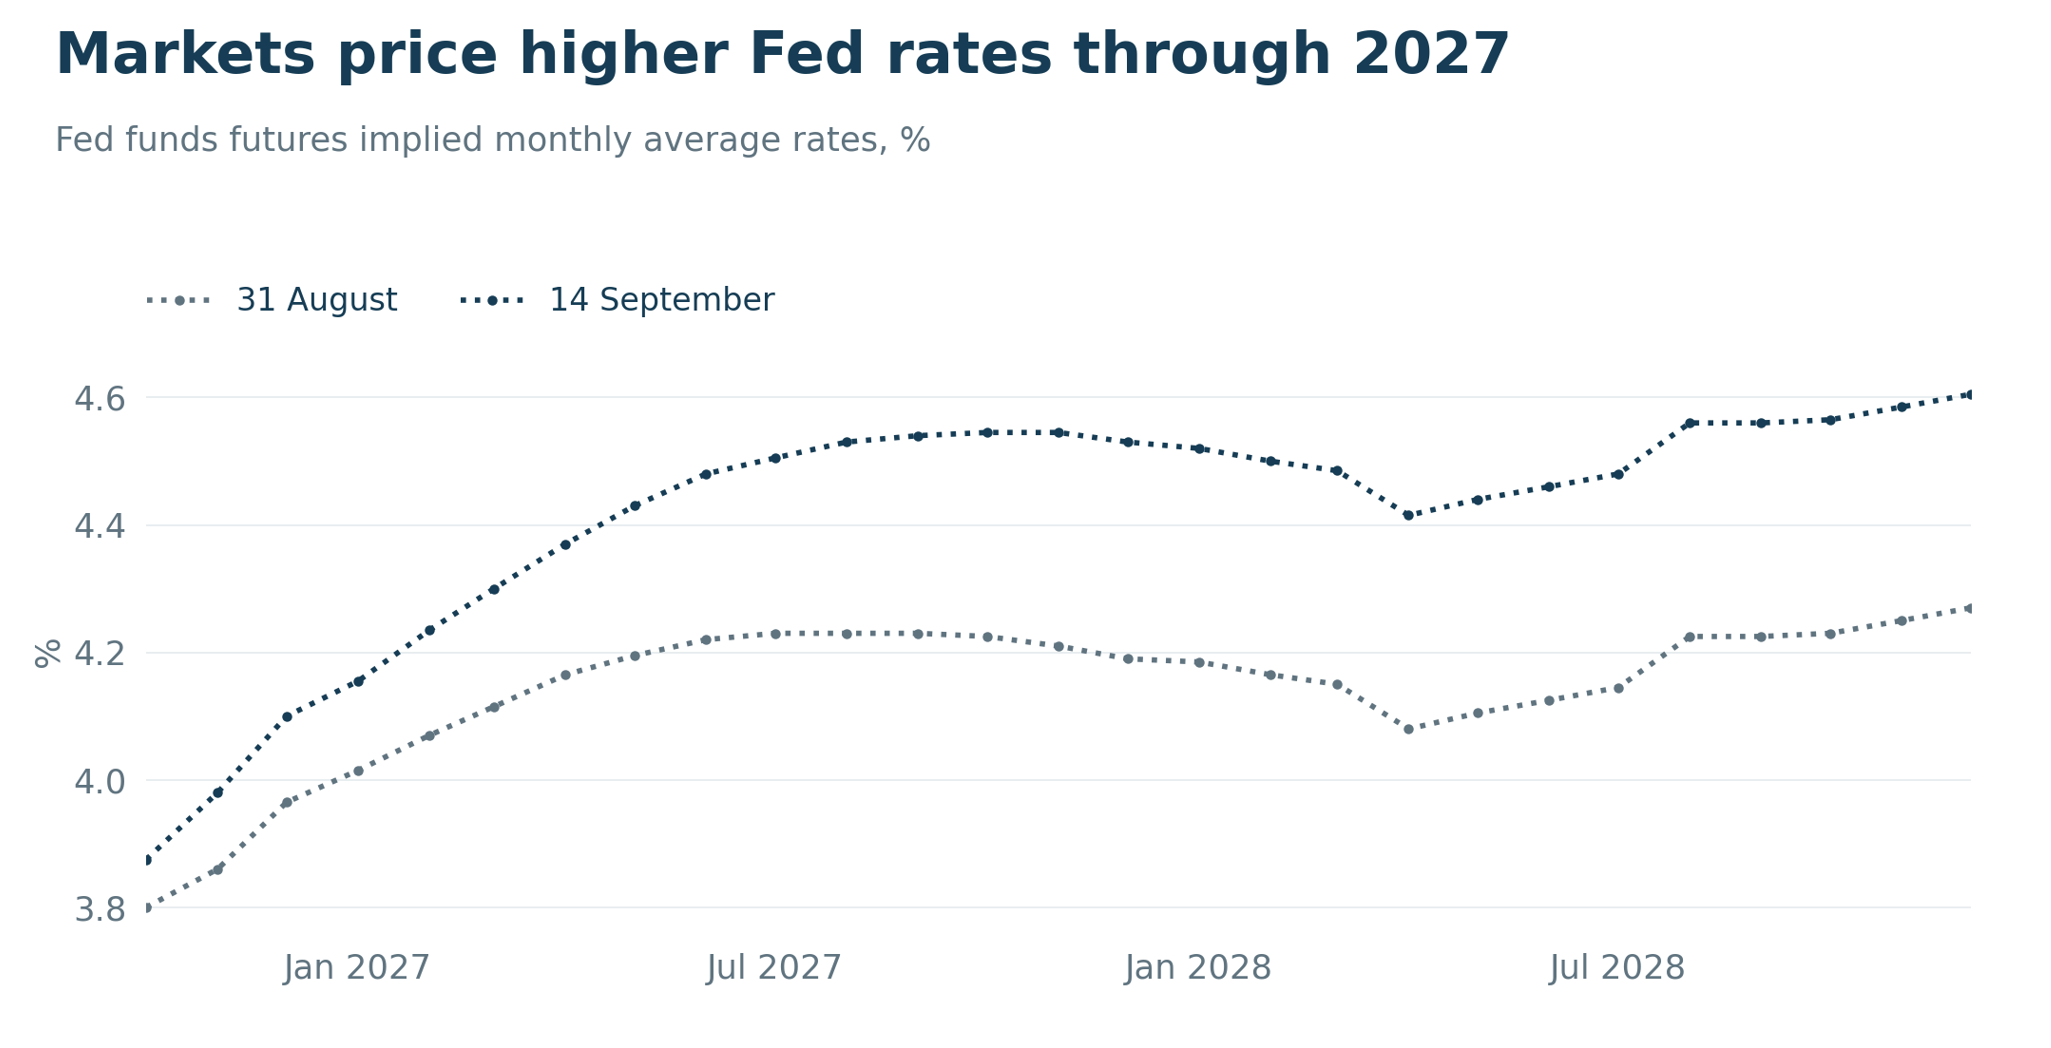
Figure 2: Sep’s sharp repricing of Fed funds driving the curve this month to date
Source: Datastream; CE
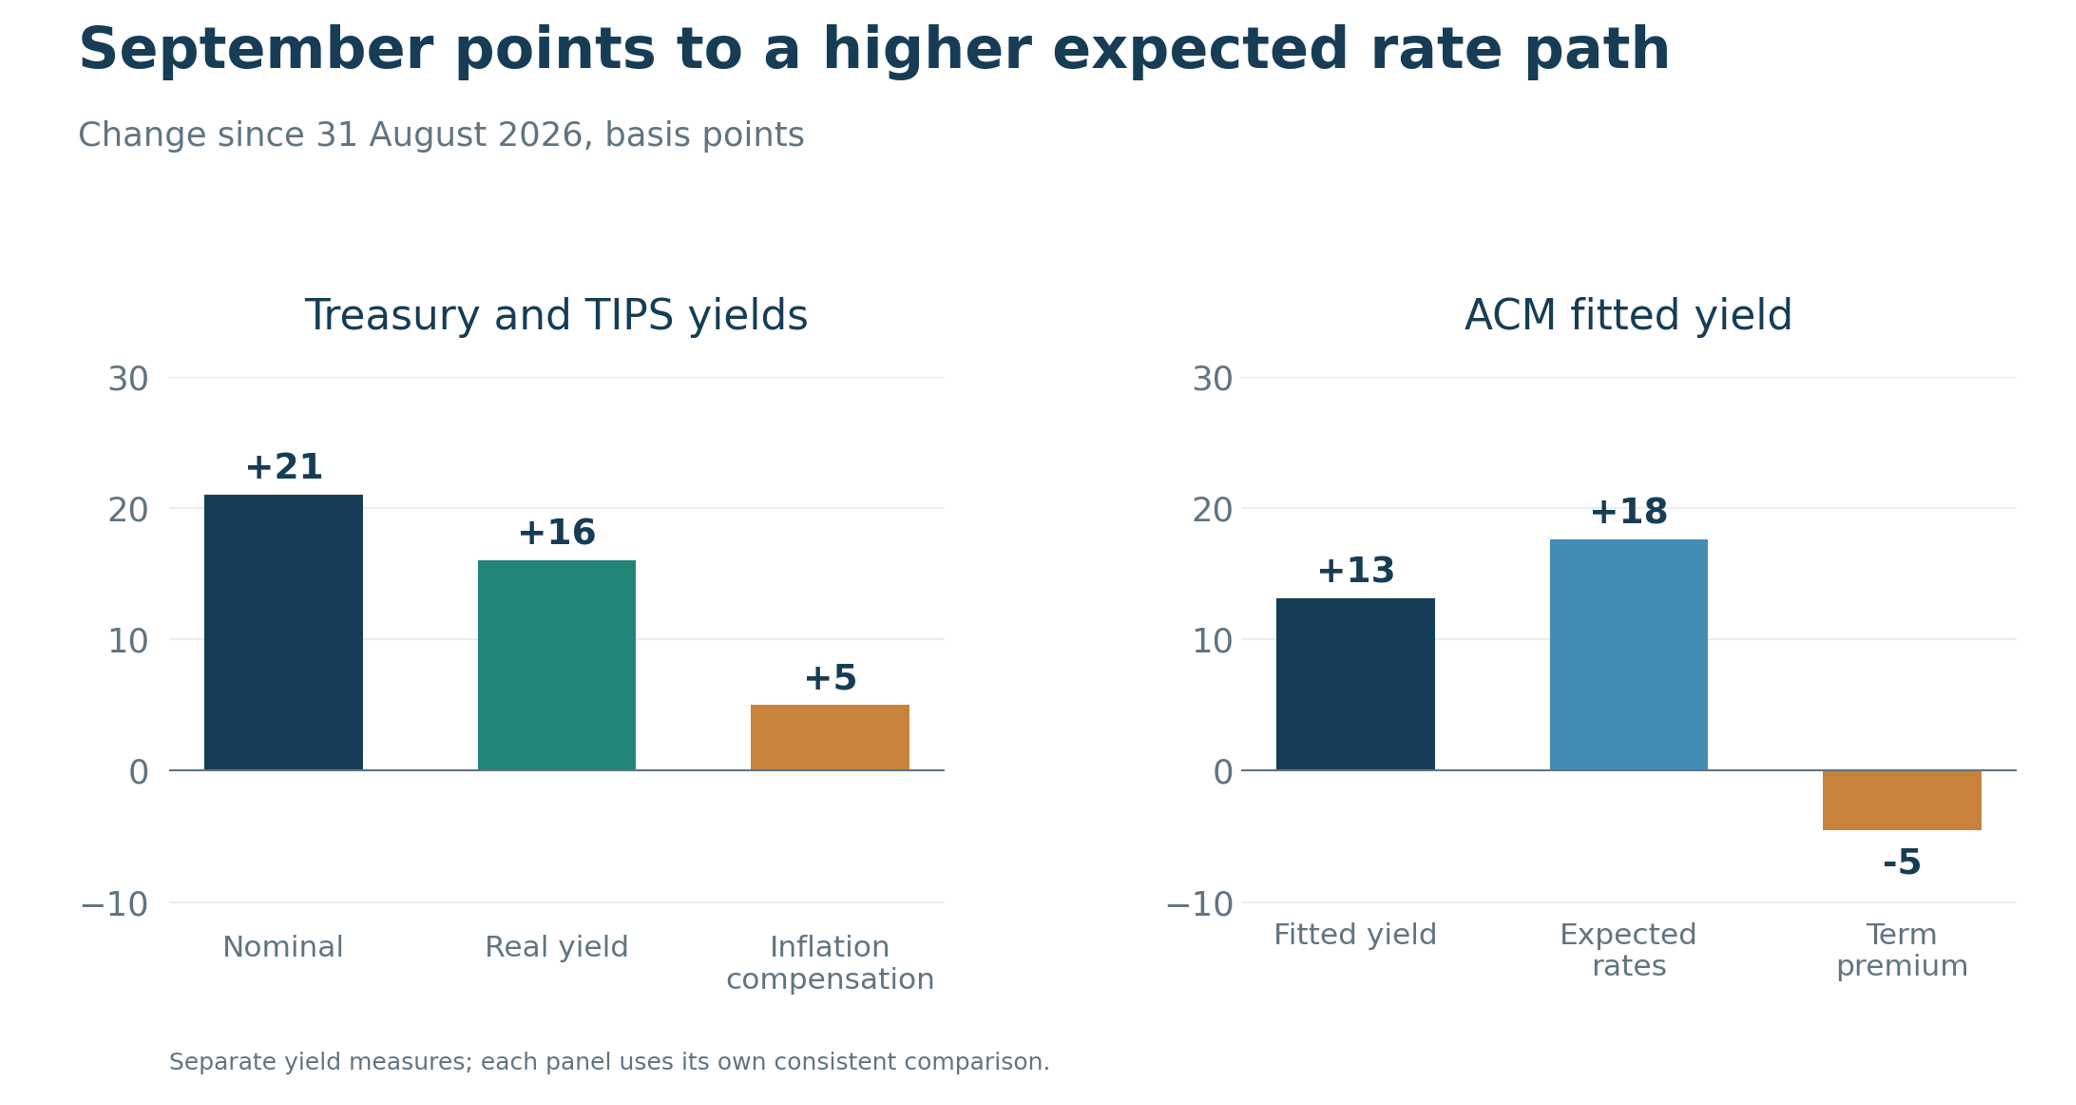
September’s acceleration to date this month looks predominantly consistent with a repricing of the expected policy path, with some 30bp+/- pick up in implied rates across the Fed funds strip, albeit one that doesn’t necessarily distinguish between actual expectations and ‘policy premium’.
Figure 3: Sep’s moves in component breakdown terms
Source: Federal Reserve; FRNY; CE
The resulting 10yr yield rise is broadly consistent with the normal typical curve behaviour. The ACM (Adrian, Crump, Moench) model also shows higher expected average short rates and a slightly lower term premium, albeit leaving some residual to the benchmark.
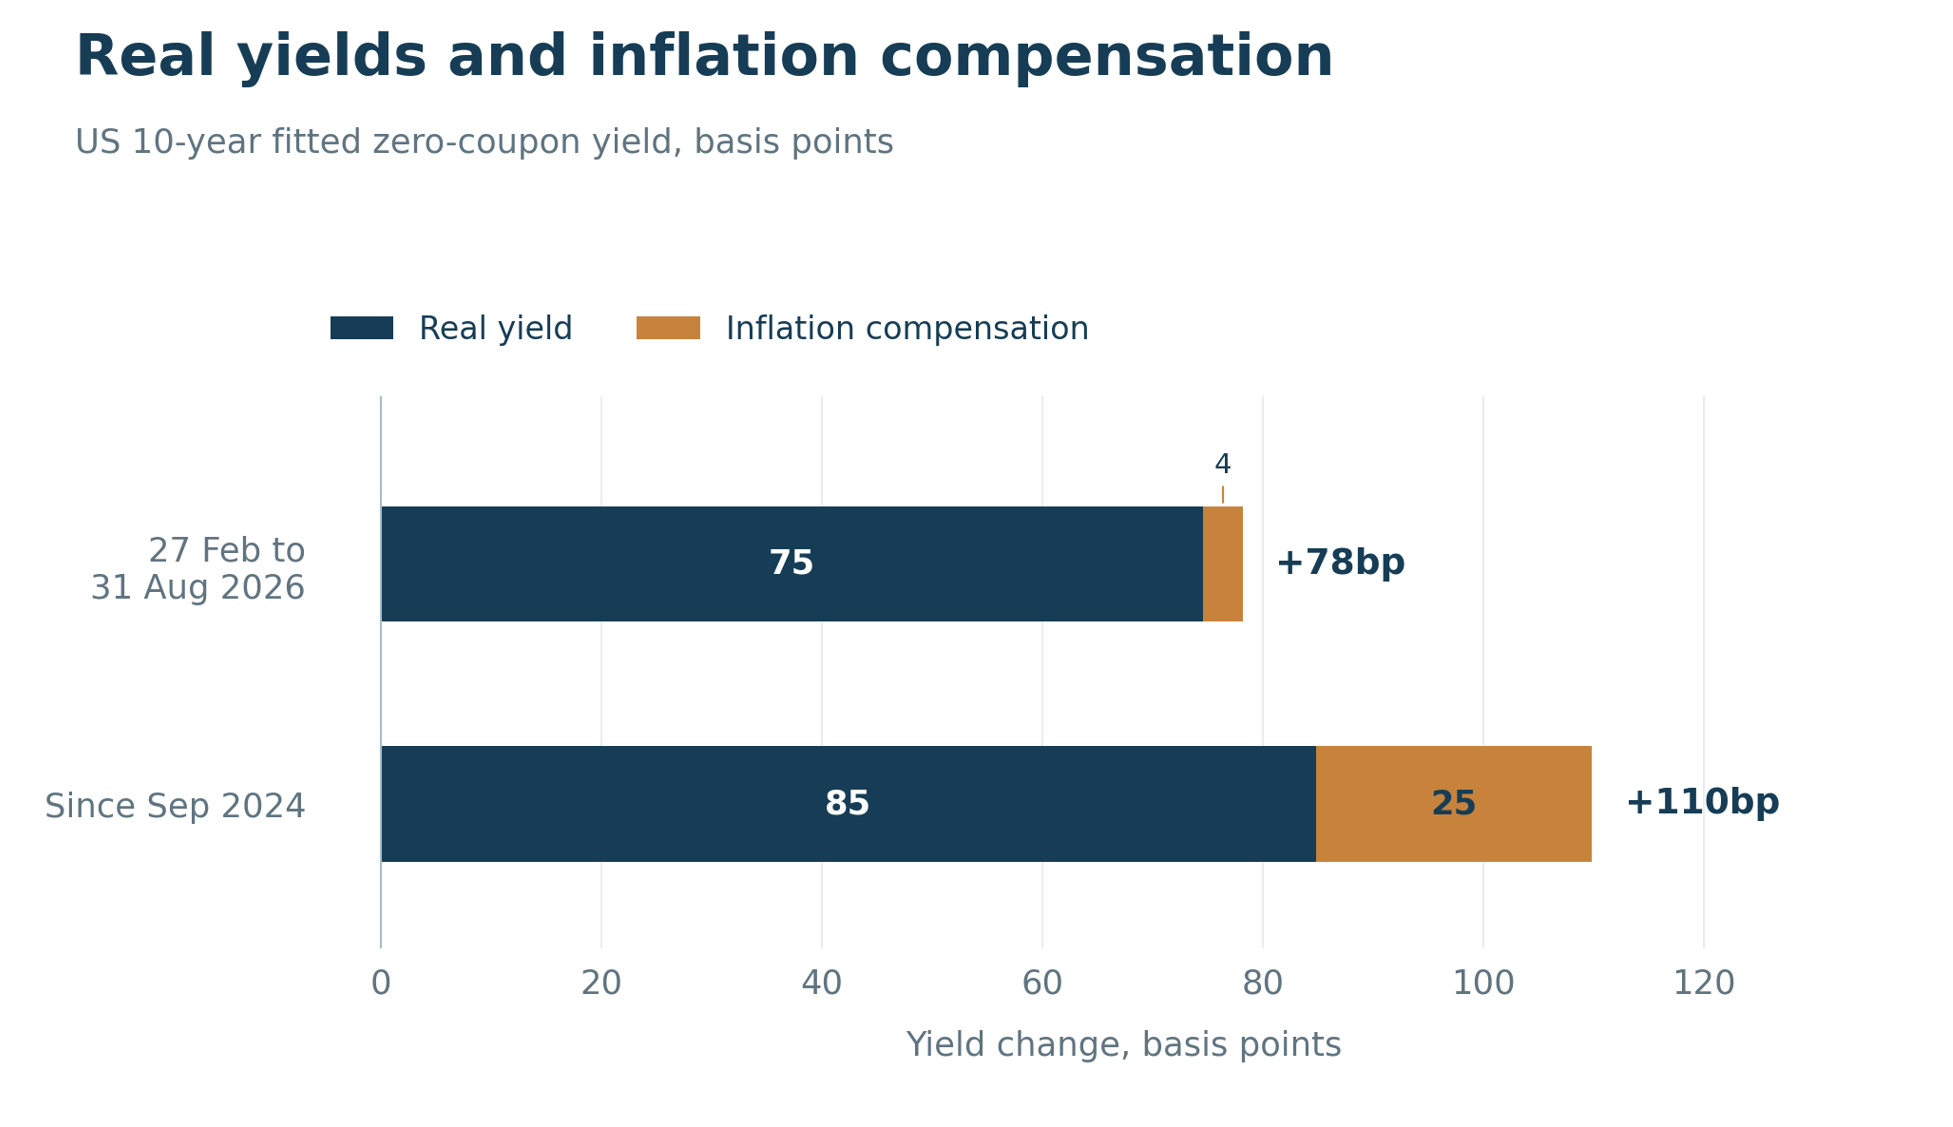
Stepping back, linkers provide the starting point for looking below the headline. Higher real yields account for the majority of the 10yr rise, both over 6 months and over the last 2 years, with some lesser longer-term rise in inflation compensation.
Figure 4: Yield vs inflation compensation across recent timeframes
Source: Federal Reserve; FRNY; CE
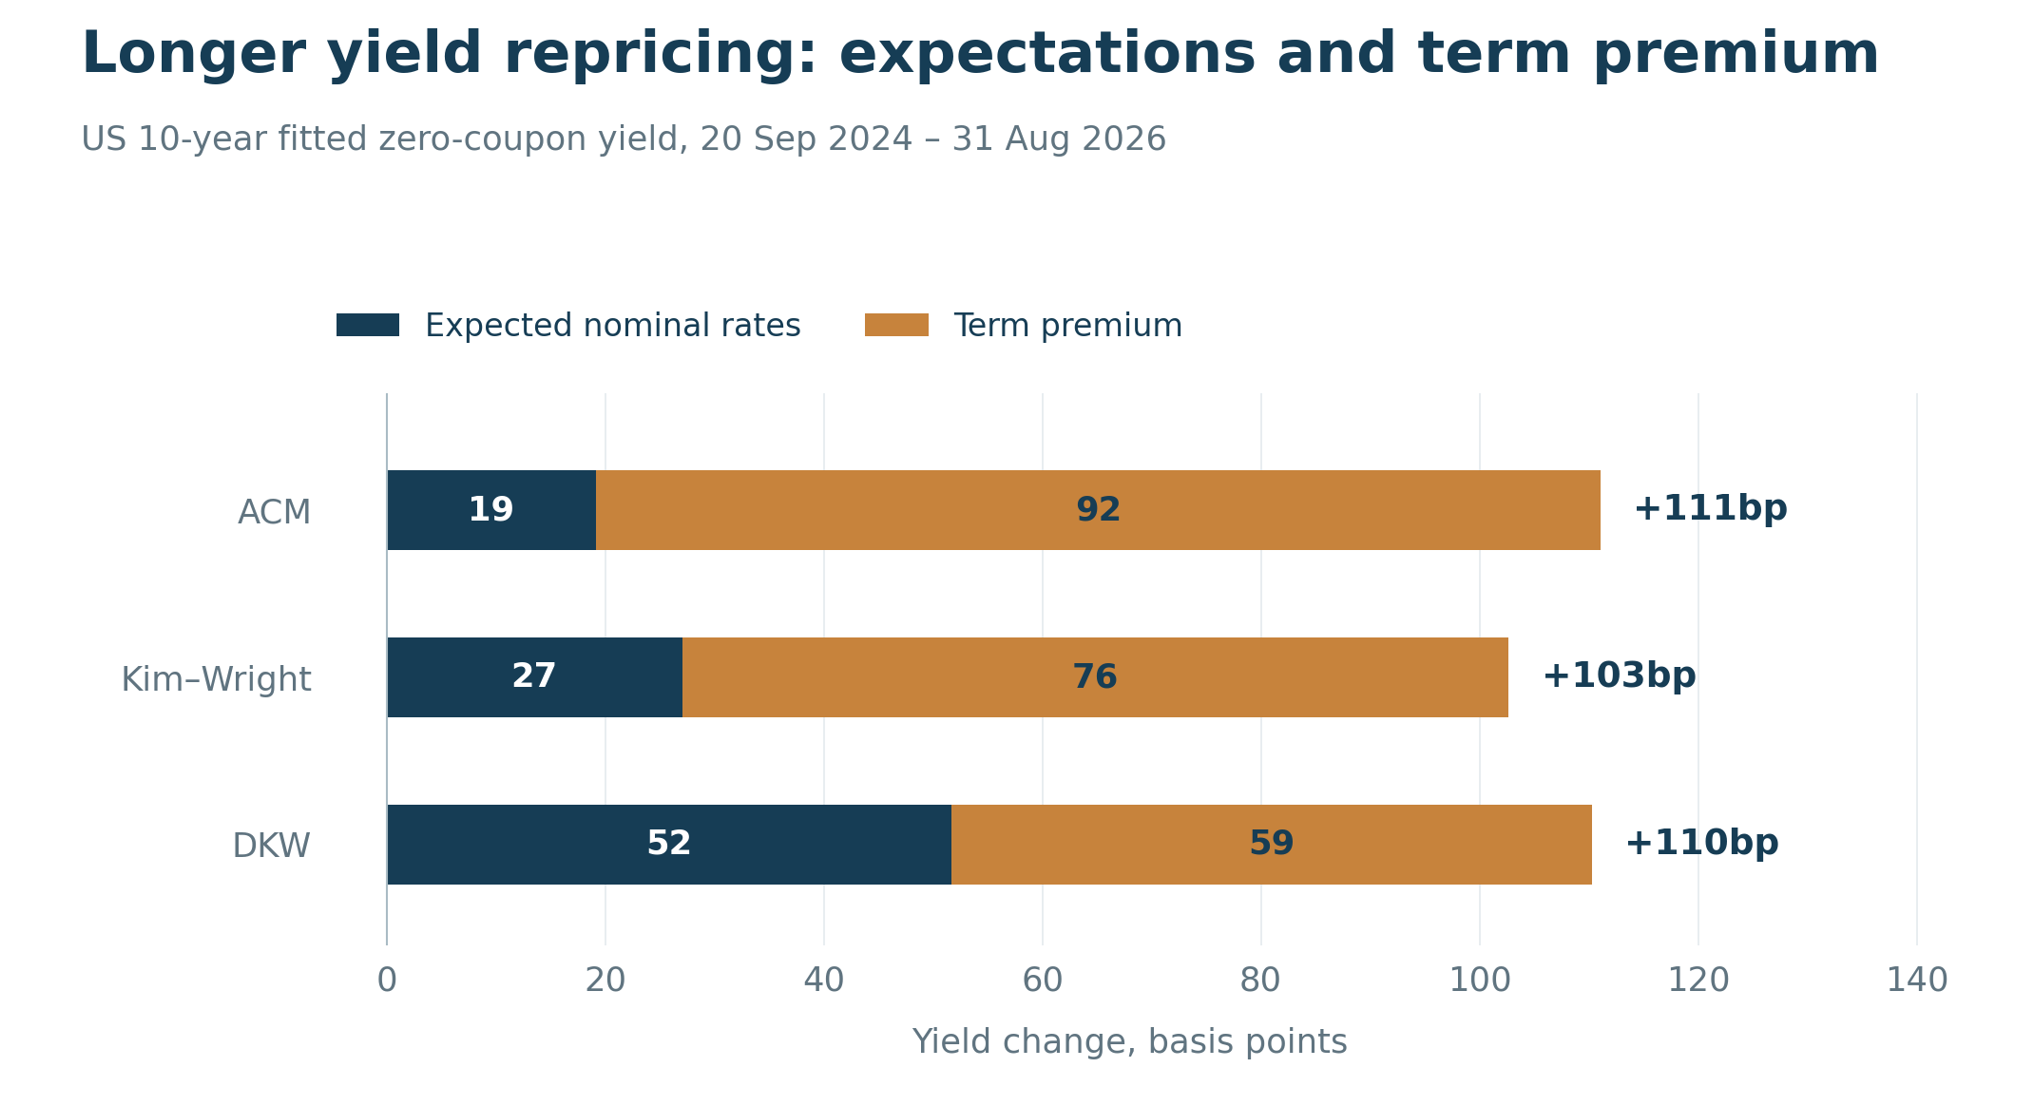
Different model decompositions show a more nuanced factor story though. Since September 2024, three main models assign roughly 60–90bp or so of the rise through August to term premium, with some variation in contribution from nominal rates.
Figure 5: 3 model views on nominal yield vs term premium
Source: Federal Reserve; FRNY; CE
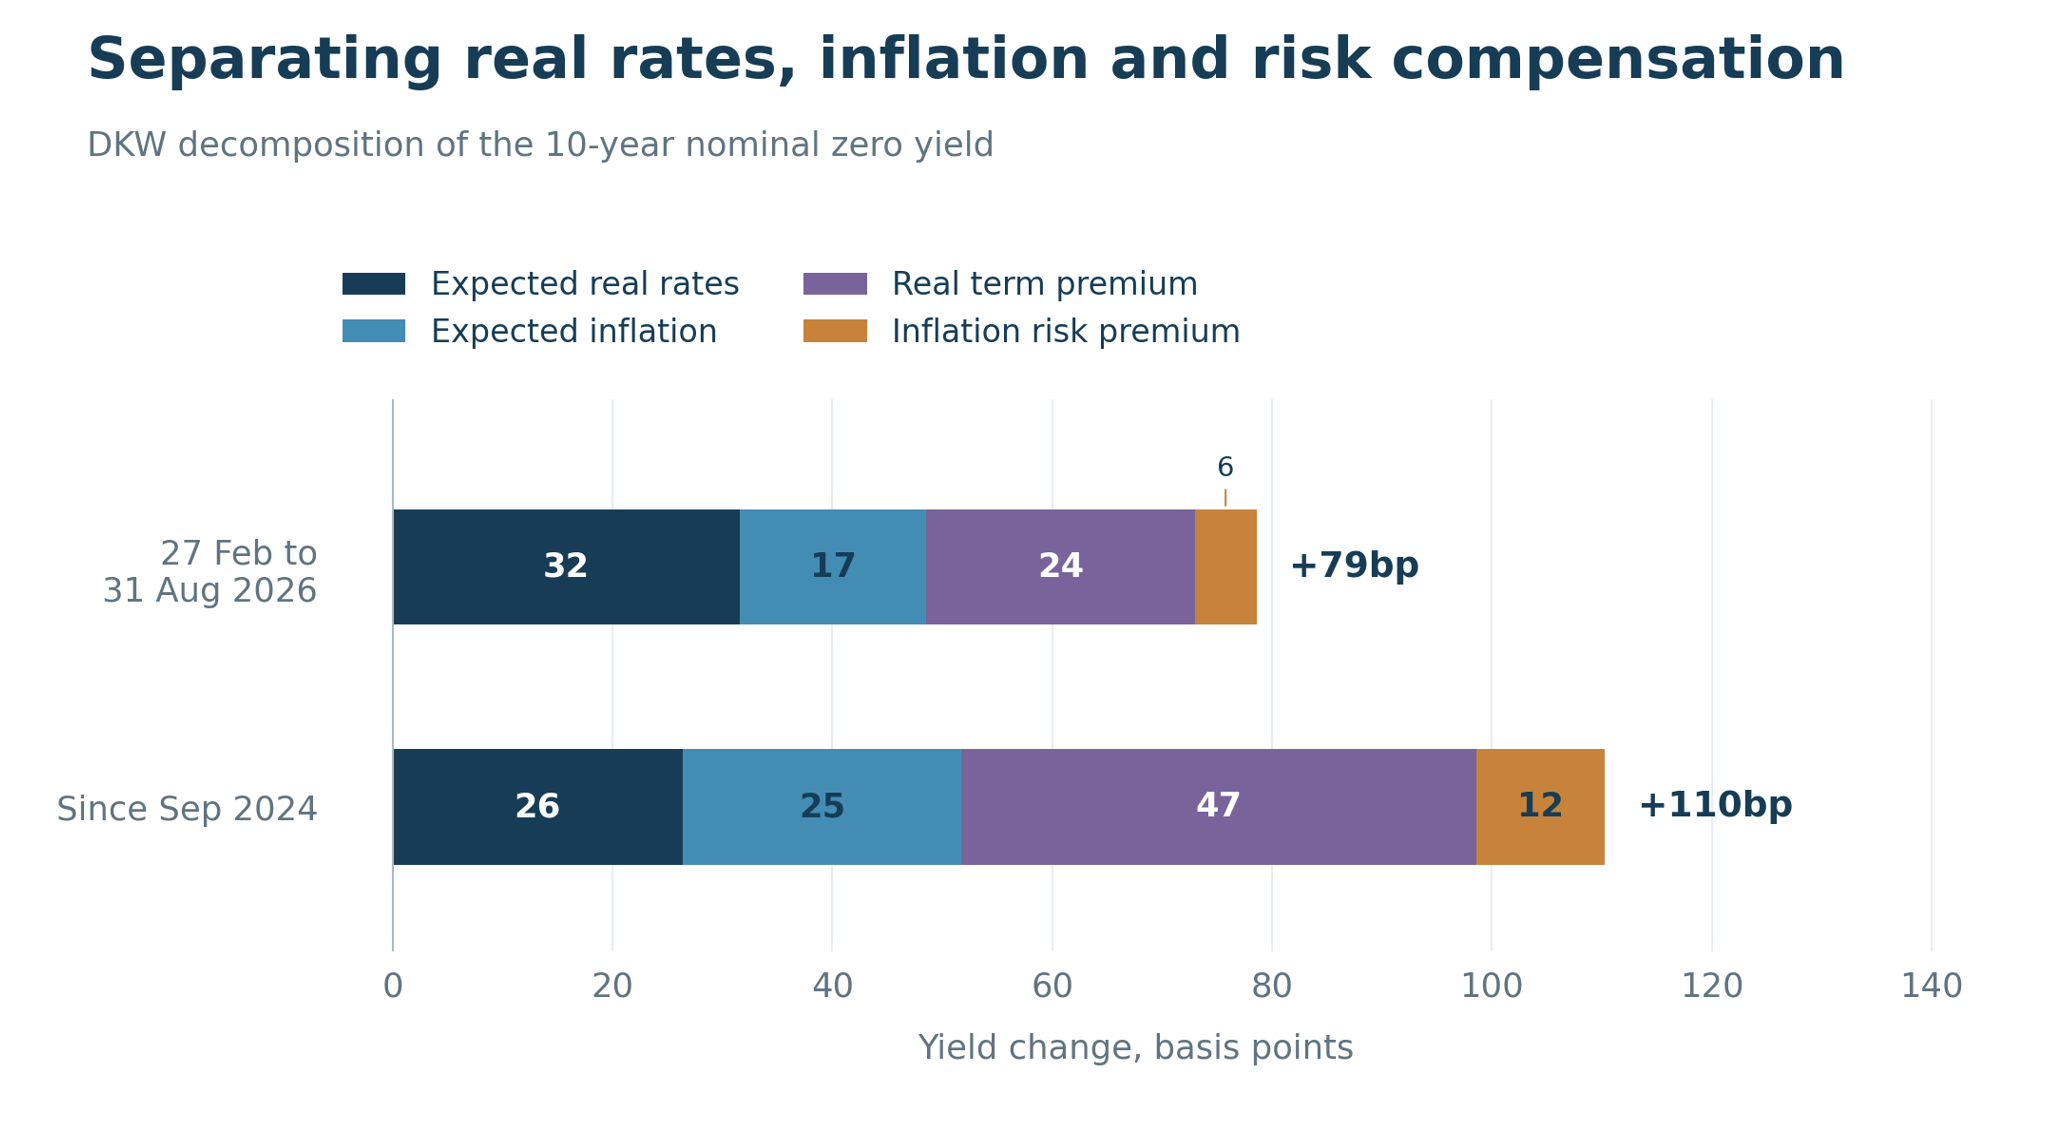
The DKW version (D’Amico,Kim,Wei) allows for a more detailed breakdown of those components and gives a slightly different slant. As of August data, it assigns just under 50bp to a higher real term premium and a little over 10bp to inflation risk compensation over that longer period. Real rates risk/compensation therefore is the more dominant specific narrative there.
Figure 6: Breaking out real rates and real term premium effect
Source: Federal Reserve; FRNY; CE
That in turn puts the focus more heavily on a collection of local and global influences: fiscal debt and financing pressures, with increased compensation necessary to clear; long-duration competition from AI led long-end-heavy corporate issuance; shifts in the savings and investment balances; some reduction in the US convenience yield discount amid the global pick up in major bond issuance and so increase in available safe assets supply; and the ongoing reflation of financial assets.
Simplifying the backup in yields to an overarching and more reassuring story of a ‘rise in real rates’ carries the risk therefore of being reductive and offering an overly benign interpretation of the macro implications.
Shifting focus from history to outlook, this crystallises the key question to which parts of the recent reset can (over different periods) unwind, remain, or in the long term extend.
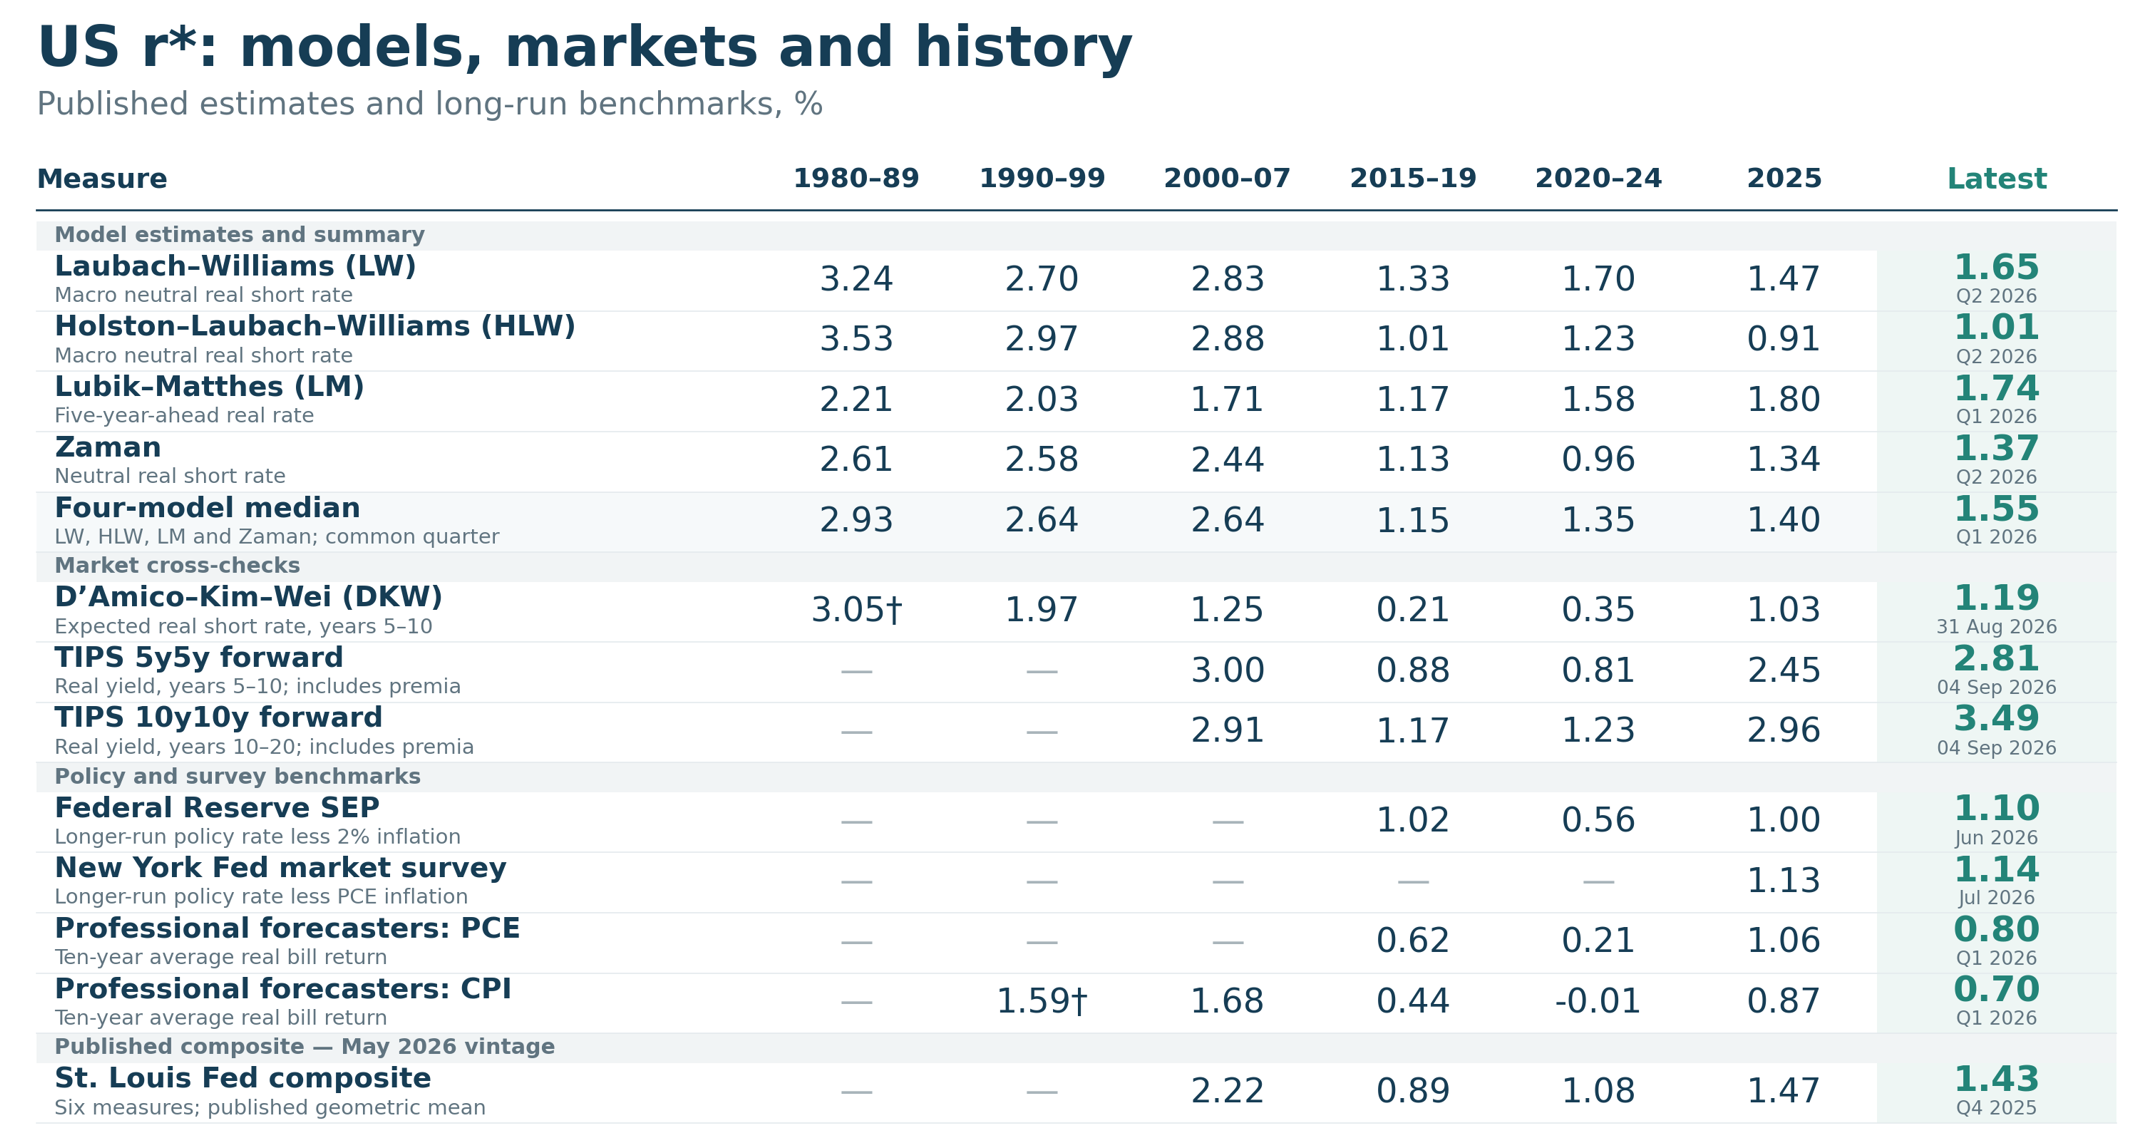
Figure 7: Neutral real rate (r*) vs averages in different periods
Source: Federal Reserve and various regional Feds; CE
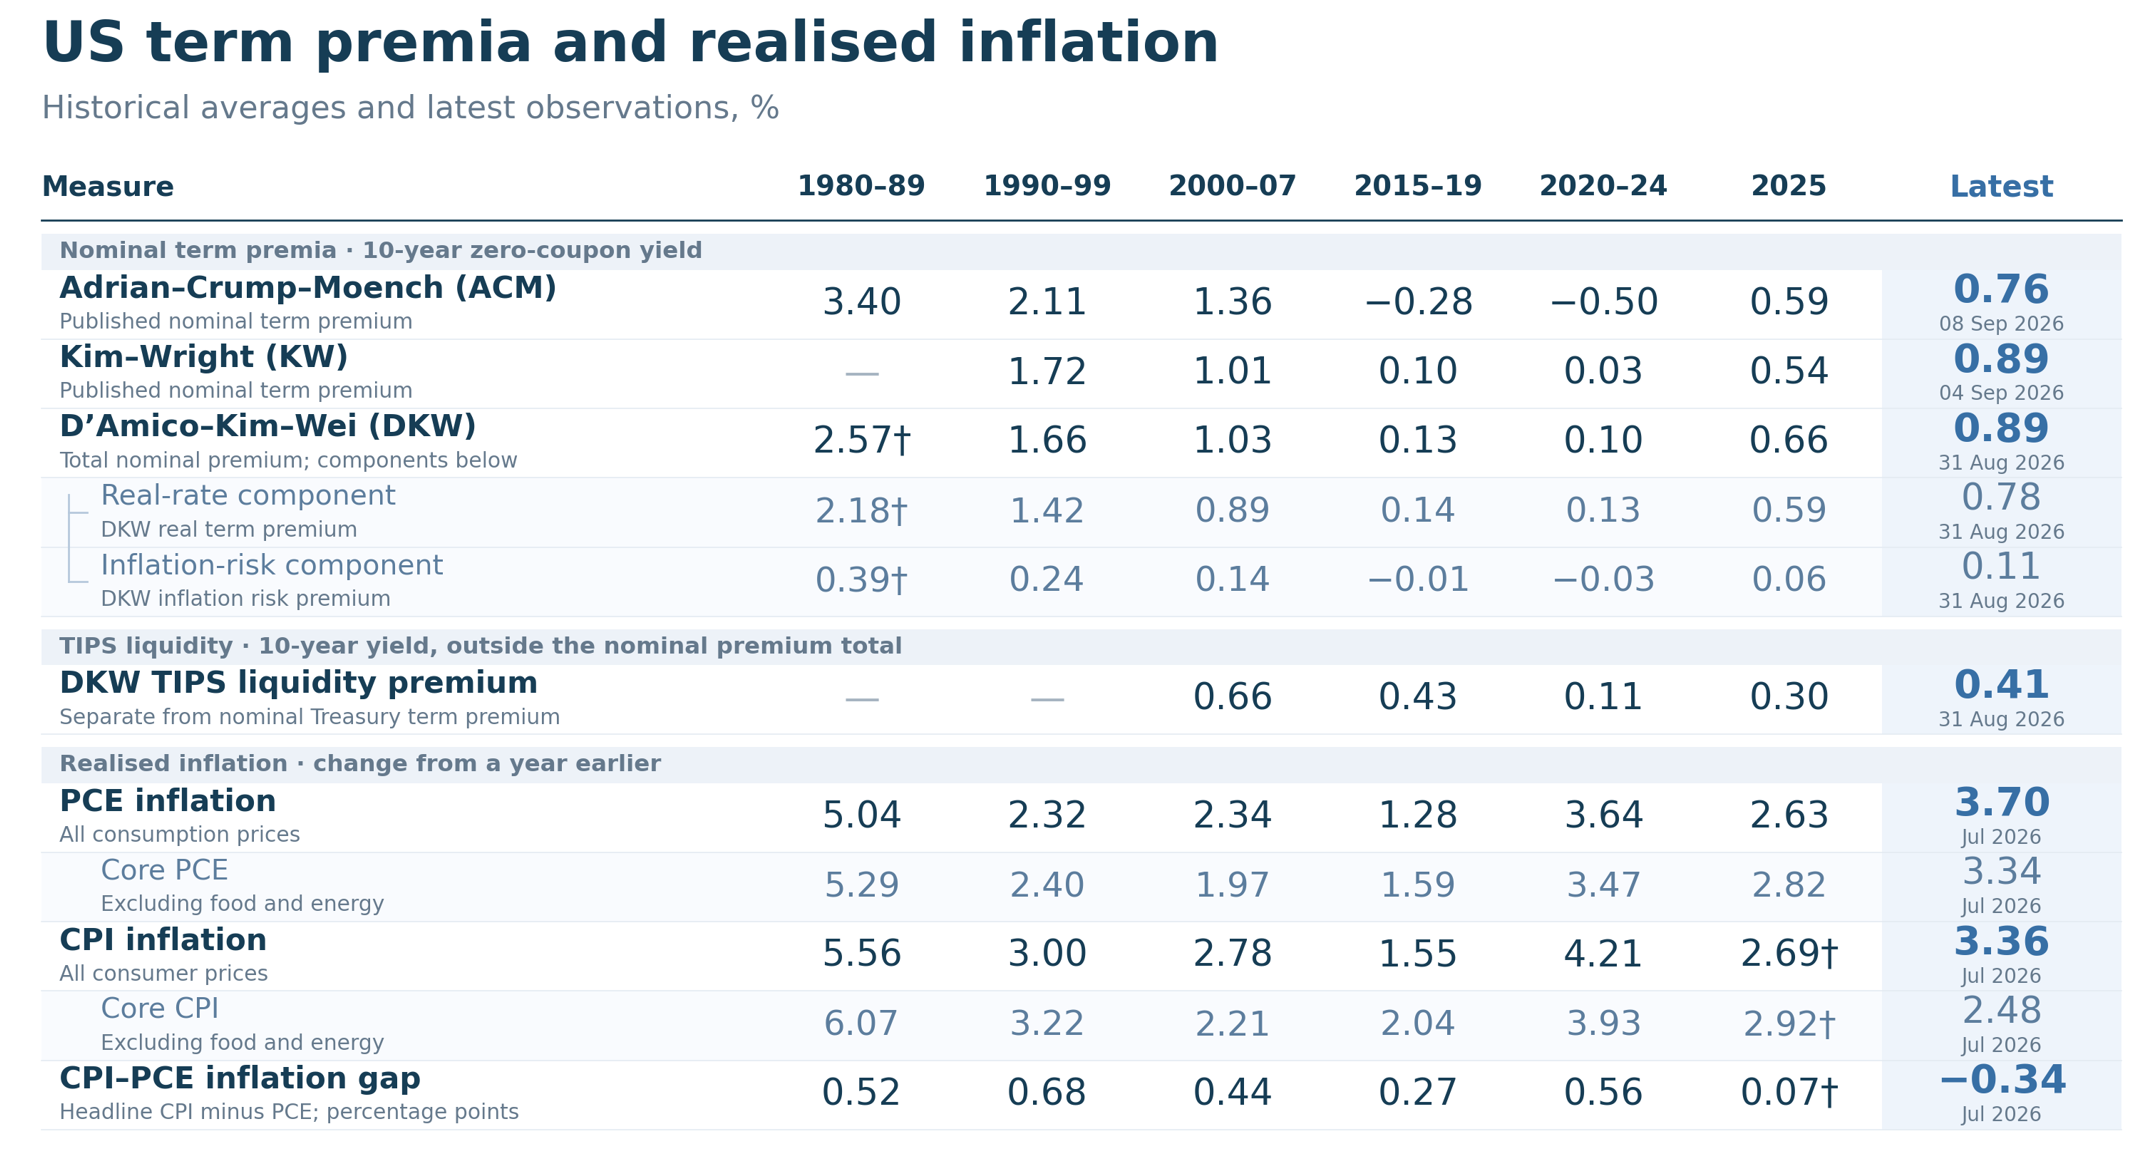
How much of the real risk premium represents uncertainty over neutral real rates in a structurally changing global economy and technology cycle? How much of that could become entrenched and extended - with further normalisation back to the neutral real rates and indeed premiums that existed back in the periods pre financial crisis? How much of the recent backup embeds major bond premia attached to the geopolitical backdrop and could be resolved or briefly relieved by any eventual normalisation of US relationships or at least Middle East truce? How much of the pressure is coming from competition for funds that could recede either on a later AI investment slowdown or on the next financial cycle peak (or more temporarily on a short-term risk sell off)? And finally, how much could any more aggressive double-down on ‘operation twist’ (in terms of buybacks and further bill issuance share increase) offset fiscal duration pressure, without triggering offsetting premia-lifting effects via loss of confidence in bonds and the dollar?
Figure 8: Term premia vs averages in different periods
Source: Federal Reserve and various regional Feds; CE
The pace of the recent backup has been so sharp and oversold that in the near-term, the bond market is arguably now more sensitive to short-term bounces on good news than further selloffs on 'expected bad news' – at least absent any scenario that sees a more dramatic global commodity supply crunch escalation from here. In recent years at least, after such steep selloffs there is a modest bias towards corrective tactical bounces over 1-3 months, though only as a corrective bias and not really evident as a pattern over the longer-term.
Some investors may also be increasingly viewing bonds (or at least out to mid-duration) as starting to offer better compensation and renewed risk hedging attributes, to balance against the risk asset cycle. Or, they may do, at least when it is safe again not to stand in front of the recent fast-moving train.
Longer-term, the potential is still for further real neutral rates upside correction, and for persistent global fiscal supply pressure. These both remain as forces going with the grain of the shift in bond trends seen since the major multi-decade trendline breaks.