Commodities Outlook: Policy Realignment
In Q2 2025, eight OPEC+ countries pledged a faster oil supply hike, motivated by market share losses, internal frictions, and geopolitical shifts. However, actual output has fallen short due to overproduction offsets, domestic consumption, and capacity limits. Further gradual increases are expected, though full restoration may extend to end-2025. Demand remains resilient but faces headwinds from China’s structural shift and trade uncertainties. India is emerging as the key growth driver. WTI is forecast at USD 63 by end-2025 and USD 58 by end-2026, with key risks tied to OPEC+ strategy shifts and geopolitical tensions.
China remains the primary driver of copper demand, supported by infrastructure spending, power grid upgrades, and high-tech sectors. While U.S. demand rose due to tariff fears, economic weakness may limit future consumption. Global supply is constrained by disruptions and structural challenges, keeping the market tight despite modest production growth. Inventories remain low in Asia and Europe, highlighting regional shortages. We forecast copper at USD 9,500 by end-2025 and USD 9,800 by end-2026, with risks including trade tensions, U.S. policy shifts, and potential supply disruptions.
Gold hit a record high of USD 3,500/oz in April, driven by strong central bank buying, ETF inflows, and heightened geopolitical tensions. Central banks, especially in Poland and China, have boosted gold holdings to diversify reserves and reduce USD exposure. Investor demand remains robust despite recent ETF outflows and high prices. A weaker USD and expected Fed rate cuts support the outlook, though relatively high real yields and profit-taking may limit gains. We forecast gold at USD 3,200 by end-2025 and USD 3,400 by end-2026. Key risks include geopolitical escalations and changes in central banks’ buying behavior.
Oil: Supply Rises, But Execution Lags
Oil production experienced a significant development in Q2 2025, when a group of eight OPEC+ countries, led by Saudi Arabia, pledged to increase supply at a faster pace than expected. Although this group had previously committed to gradually restoring the 2.2 million barrels per day (bpd) that were removed from the market in November 2023 – by increasing production by an average of 122,000 bpd by month over an 18-month period – they unexpectedly accelerated this timeline. Instead, they announced an increase in output of 411,000 bpd in May, June, and July; however, this hike has so far been “theoretical”.
"Theoretical" because not all the announced barrels have reached (or are expected to reach) the market. For instance, in May, the eight OPEC+ producers involved in the cuts increased output by only 154,000 bpd, 257,000 bpd less than the target. Several factors explain this discrepancy: first, some countries are compensating for previous overproduction; second, part of the additional output is expected to be absorbed by domestic consumption, particularly in Saudi Arabia and across the Middle East, where summer demand surges due to air conditioning and power generation needs; third, some countries are already producing at or above their quotas and may be unable to increase output further.
Even if the full volume of the announced additional supply has not materialized, this development raises two key questions: first, why has this group chosen to accelerate the pace of the hikes? And second, what are their plans going forward?
In our Q4 2024 outlook, we identified three drivers behind the production increases that remain valid and equally relevant: the desire to regain market share, internal frictions within the group, and geopolitical considerations, including sanctions. First, OPEC’s decision to cut supply has resulted in a loss of their market share (35% in 2018 vs 31% in 2025 as per data from the Energy Information Administration). Second, internal tensions have intensified as countries like Kazakhstan exceed their production quotas (Figure 1), prompting core members to reassess their strategy. And third, geopolitics factors remain highly relevant – sanctions on Russia, Venezuela, and Iran continue to provide space for others to increase output without triggering a price collapse.
Figure 1: OPEC+ Compliance Over/Under Quota (May 2025, mbpd)
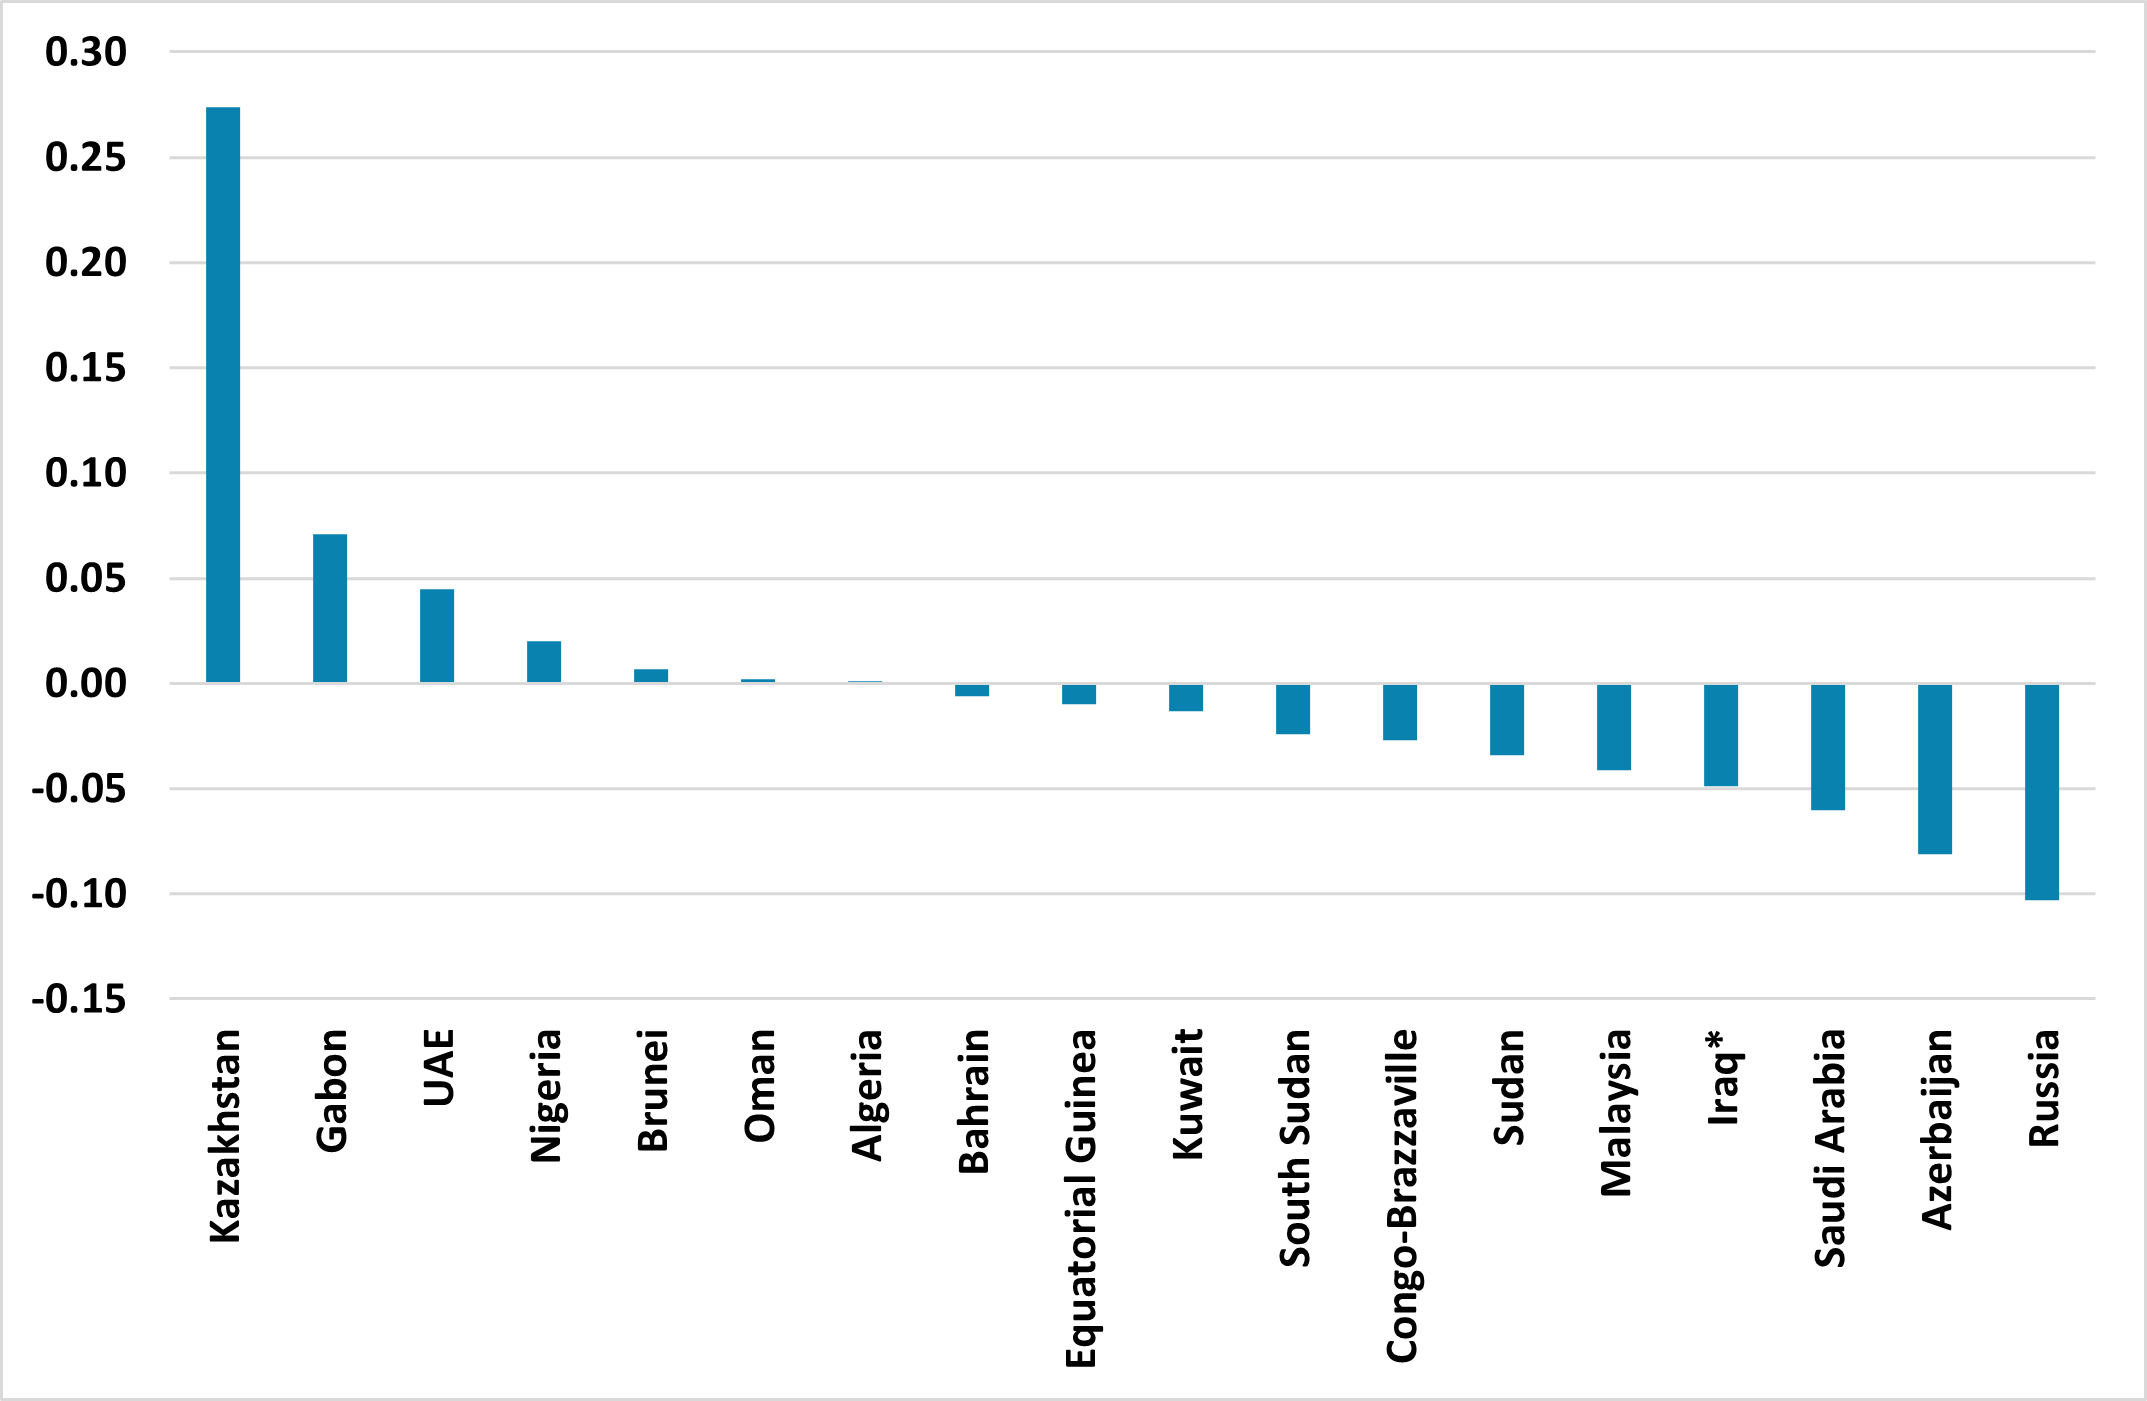
Note: * Includes estimated 240,000 bpd output in the semi-autonomous Kurdistan region.
Source: S&P Global Commodity Insights / Continuum Economics
Turning to the second question, we expect the group of eight OPEC+ countries to continue increasing production in the second half of the year. Of the 2.2 million bpd announced to be returned to the market, approximately 1.2 million bpd would have already been theoretically restored by July. Our baseline scenario assumes at least one more “super hike” of 411,000 bpd in August, followed by average monthly increases of around 140,000 bpd through the remainder of the year. This would imply a full return of these supply cuts by the end of 2025. We believe that a faster ramp up of quotas is unlikely, given the group’s inability to meet its target in May. Moreover, it is precisely such a faster than expected scenario that would likely surprise the market and trigger a stronger price reaction, especially considering that market participants have largely adjusted their expectations regarding OPEC+’s policy direction and potential supply imbalances.
We do not believe that OPEC+ is aiming to trigger a price war with Western producers. First, while President Trump supports lower energy prices, a collapse below USD 50 would harm U.S. shale producers, who are already underperforming and for whom that price is close to the breakeven level. A similar situation during Trump’s first term led to diplomatic pressure on Saudi Arabia and Russia to cut output in order to support U.S. production. Second, many relevant producers within OPEC+ themselves have fiscal breakeven prices near USD 90, making ultra-low oil prices unsustainable for them as well. Overall, we believe OPEC+ has identified a favorable window to reintroduce more barrels to the market without triggering a sharp correction in prices. We do not see the Israel-Iran war impacting OPEC+’s strategy, as we expect the conflict to be short-lived and not to disrupt supplies through the Strait of Hormuz under current circumstances.
Oil demand has proven more resilient than expected, providing support to prices. In the short to medium term, we see a mix of supportive and adverse factors, but overall, we expect oil demand growth to remain moderate. On the upside, the summer season will likely boost consumption, particularly due to increased travel and higher energy use for cooling. In the U.S., although we have revised our 2025 GDP forecast downward, this reflects a weak first quarter, and a recovery is anticipated in the second half of the year, which should support oil demand. Also contributing positively is President Trump’s reversal of policies that encouraged investment in electric vehicle infrastructure and adoption. On the downside, persistent uncertainty surrounding tariffs and their potential impact on global trade and economic activity could weigh on oil prices.
China oil demand growth is slowing and fundamentally shifting. In 2024, consumption of key transport fuels declined and is now below 2021 levels as reported by the International Energy Agency, reflecting a broader economic transition from manufacturing to services and rising EV adoption. While total oil demand in China continues to grow, it is now driven primarily by petrochemical feedstocks rather than combustion fuels. In contrast, India is emerging as the key global oil demand growth driver, with Moody’s projecting annual increases of 3-5% through at least 2030. India’s oil demand is supported by strong economic growth, rising population, infrastructure expansion, and seasonal factors. OPEC forecasts India’s demand to rise by 170,000 bpd in 2025, with strong growth in diesel, gasoline, and aviation fuels, despite potential downside risks from global trade tensions.
The outlook we have outlined lead us to forecast WTI at USD 63 by the end of 2025. Looking ahead to 2026, we do not expect the group-wide cuts of 3.6 million bpd, currently scheduled to remain in place through next year’s end, to be reversed just yet. We anticipate that these cuts will be reassessed closer to that time. On the demand side, we expect oil consumption to remain moderate, in line with our outlook for global economic growth, particularly in the U.S., China, and India. We forecast WTI at USD 58 by the end of 2026. Key risks to our forecast include a significant shift in OPEC’s strategy, either a sudden stop to production hikes or a larger than expected increase in supply, an escalation in geopolitical tensions (such as the Russia-Ukraine or Israel-Iran conflicts), or a larger decline in global oil demand. In the short term, an escalation of the Israel-Iran conflict, including the closure of the Strait of Hormuz could potentially take oil prices above USD 90.
Copper: Moderate Gains, Rising Risks
China remains the most relevant player for copper demand, consuming over 50% of global supply. A slightly better than expected economic outlook is constructive for the metal, with our 2025 GDP growth forecast revised up from 4.2% to 4.4%, supported by additional central government infrastructure spending, as discussed in our China chapter. Notably, the property sector, a historical driver of copper prices, is expected to be less of a drag in 2025 and 2026, although we argue a bottom in the market might not have been reached. Meanwhile, investments in the power grid remain a key demand pillar, with State Grid spending rising 25% YoY during Q1 2025 and contributing to roughly one third of China's copper usage. High-tech sectors such as AI, data centers, and electric vehicles continue to expand, further supporting structural demand. A weaker USD would make copper relatively cheaper in emerging markets, providing additional support for prices. On the downside, however, consumer sentiment remains subdued due to weak income growth and job insecurity. These factors, combined with the impact of U.S. tariffs, point to a more cautious outlook for copper consumption.
Demand from the U.S. picked up after President Donald Trump announced the possibility of imposing tariffs on copper, following an investigation under Section 232 of the Trade Expansion Act of 1962. This led to a front-loading of imports and a significant inventory buildup at CME warehouses (the highest since 2018). However, we expect this surge in demand to fade, potentially weighing on future copper consumption, particularly as we assume the tariffs resulting from the investigation will take effect in the second half of the year.
More broadly, protectionist measures and the rollback of EV incentives under Trump’s policy direction are likely to weigh on U.S. copper demand. For instance, Trump signed an executive order halting the distribution of unspent government funds for vehicle charging stations from a USD 5 billion federal program and indicated that his administration would consider terminating EV tax credits. He also signed joint resolutions of Congress blocking California’s plan to phase out gasoline-powered vehicles. These policy shifts coincide with low consumer interest in EVs: only 16% of U.S. drivers say they are likely to buy an EV, according to a recent American Automobile Association survey. As tariffs lift inflation to an expected 3.5% in Q4 2025, the Fed is likely to maintain restrictive monetary policy well into late 2025, further dampening growth. With U.S. GDP forecast to grow by just 1.4% in 2025 and 2026, we feel the recent boost to copper demand may prove short-lived and insufficient to support sustained consumption.
On the supply side, global mine production is forecast to grow by just 2.3% in 2025 as per the International Copper Study Group (ICSG), led by expansions at Oyu Tolgoi (Mongolia), Malmyz (Russia), and new operations in Asia and Africa. However, this growth is constrained by multiple factors. Flooding at the Kamoa-Kakula mine in the DRC is delaying production, and broader issues such as resource nationalism, aging assets, and stricter environmental regulations are capping the longer-term supply. The ICSG also projects refined copper production to rise by 2.9%, largely from China, India, Indonesia, and the DRC, but this may not be sufficient to ease the market's structural tightness. Inventories also tell a diverging story: while U.S. stockpiles have increased, London Metal Exchange and Shanghai Future Exchange inventories remain at multi-year lows, pointing to physical tightness in Asia and Europe.
We project copper at USD 9,500 by the end of 2025. In 2026, demand is likely to be balanced by moderate economic growth in China, ongoing weakness in the U.S. economy, and the persistent impact of trade tariffs. However, several supportive factors remain in play, including a weaker USD, further monetary easing by the Fed, sustained momentum in the electric vehicle and high-tech industries, and a tightening supply-demand balance. As a result, we anticipate copper prices will rise to USD 9,800 by year-end 2026. Key risks to this outlook include unexpected shifts in trade policy, deeper than expected demand weakness from escalating trade tensions, and potential supply disruptions that could accelerate market tightening.
Gold: Structural and Speculative Demand
Gold reached an all-time high in April, hitting USD 3,500 per ounce. We believe this performance reflects a combination of structural and speculative factors. On the structural side, strong demand from central banks and sustained inflows into gold-backed ETFs have provided solid support for prices. On the speculative side, heightened geopolitical tensions, from the U.S.-China trade war to the Russia-Ukraine conflict and, more recently, the Israel-Iran escalation, have reinforced gold's appeal as a safe haven asset.
Central bank buying has been a key driver behind gold’s recent outperformance. These institutions have increased their gold holdings to enhance reserve stability, hedge against economic and geopolitical risks, and reduce reliance on foreign currencies such as the USD. In this context, a Bloomberg report notes that “gold has been the second largest reserve currency since March 2024, in front of the euro and just behind the dollar, once they rank it along with central banks' holdings of fiat reserve currencies”.
Statistics from the World Gold Council (WGC) show that the National Bank of Poland has been the largest net buyer of gold among central banks year to date. The second largest buyer is the State Oil Fund of Azerbaijan, followed by the People’s Bank of China (PBOC), which, as of May, had recorded seven consecutive months of gold purchases. However, as shown in Figure 2, the PBOC’s gold reserves remain relatively low compared to other upper middle-income economies, and the gap is even more pronounced when compared to advanced economies. This suggests there is considerable room for further accumulation. A key question going forward is whether central banks will continue to accumulate gold. Our view is that the trend will persist, but at a slower pace than the record levels seen over the past three years. Diversification remains a strong driver of demand, even if higher prices moderate the pace of purchases.
Figure 2: Gold Holdings as % of Total Reserves in Upper Middle-Income Economies (Q1 2025)
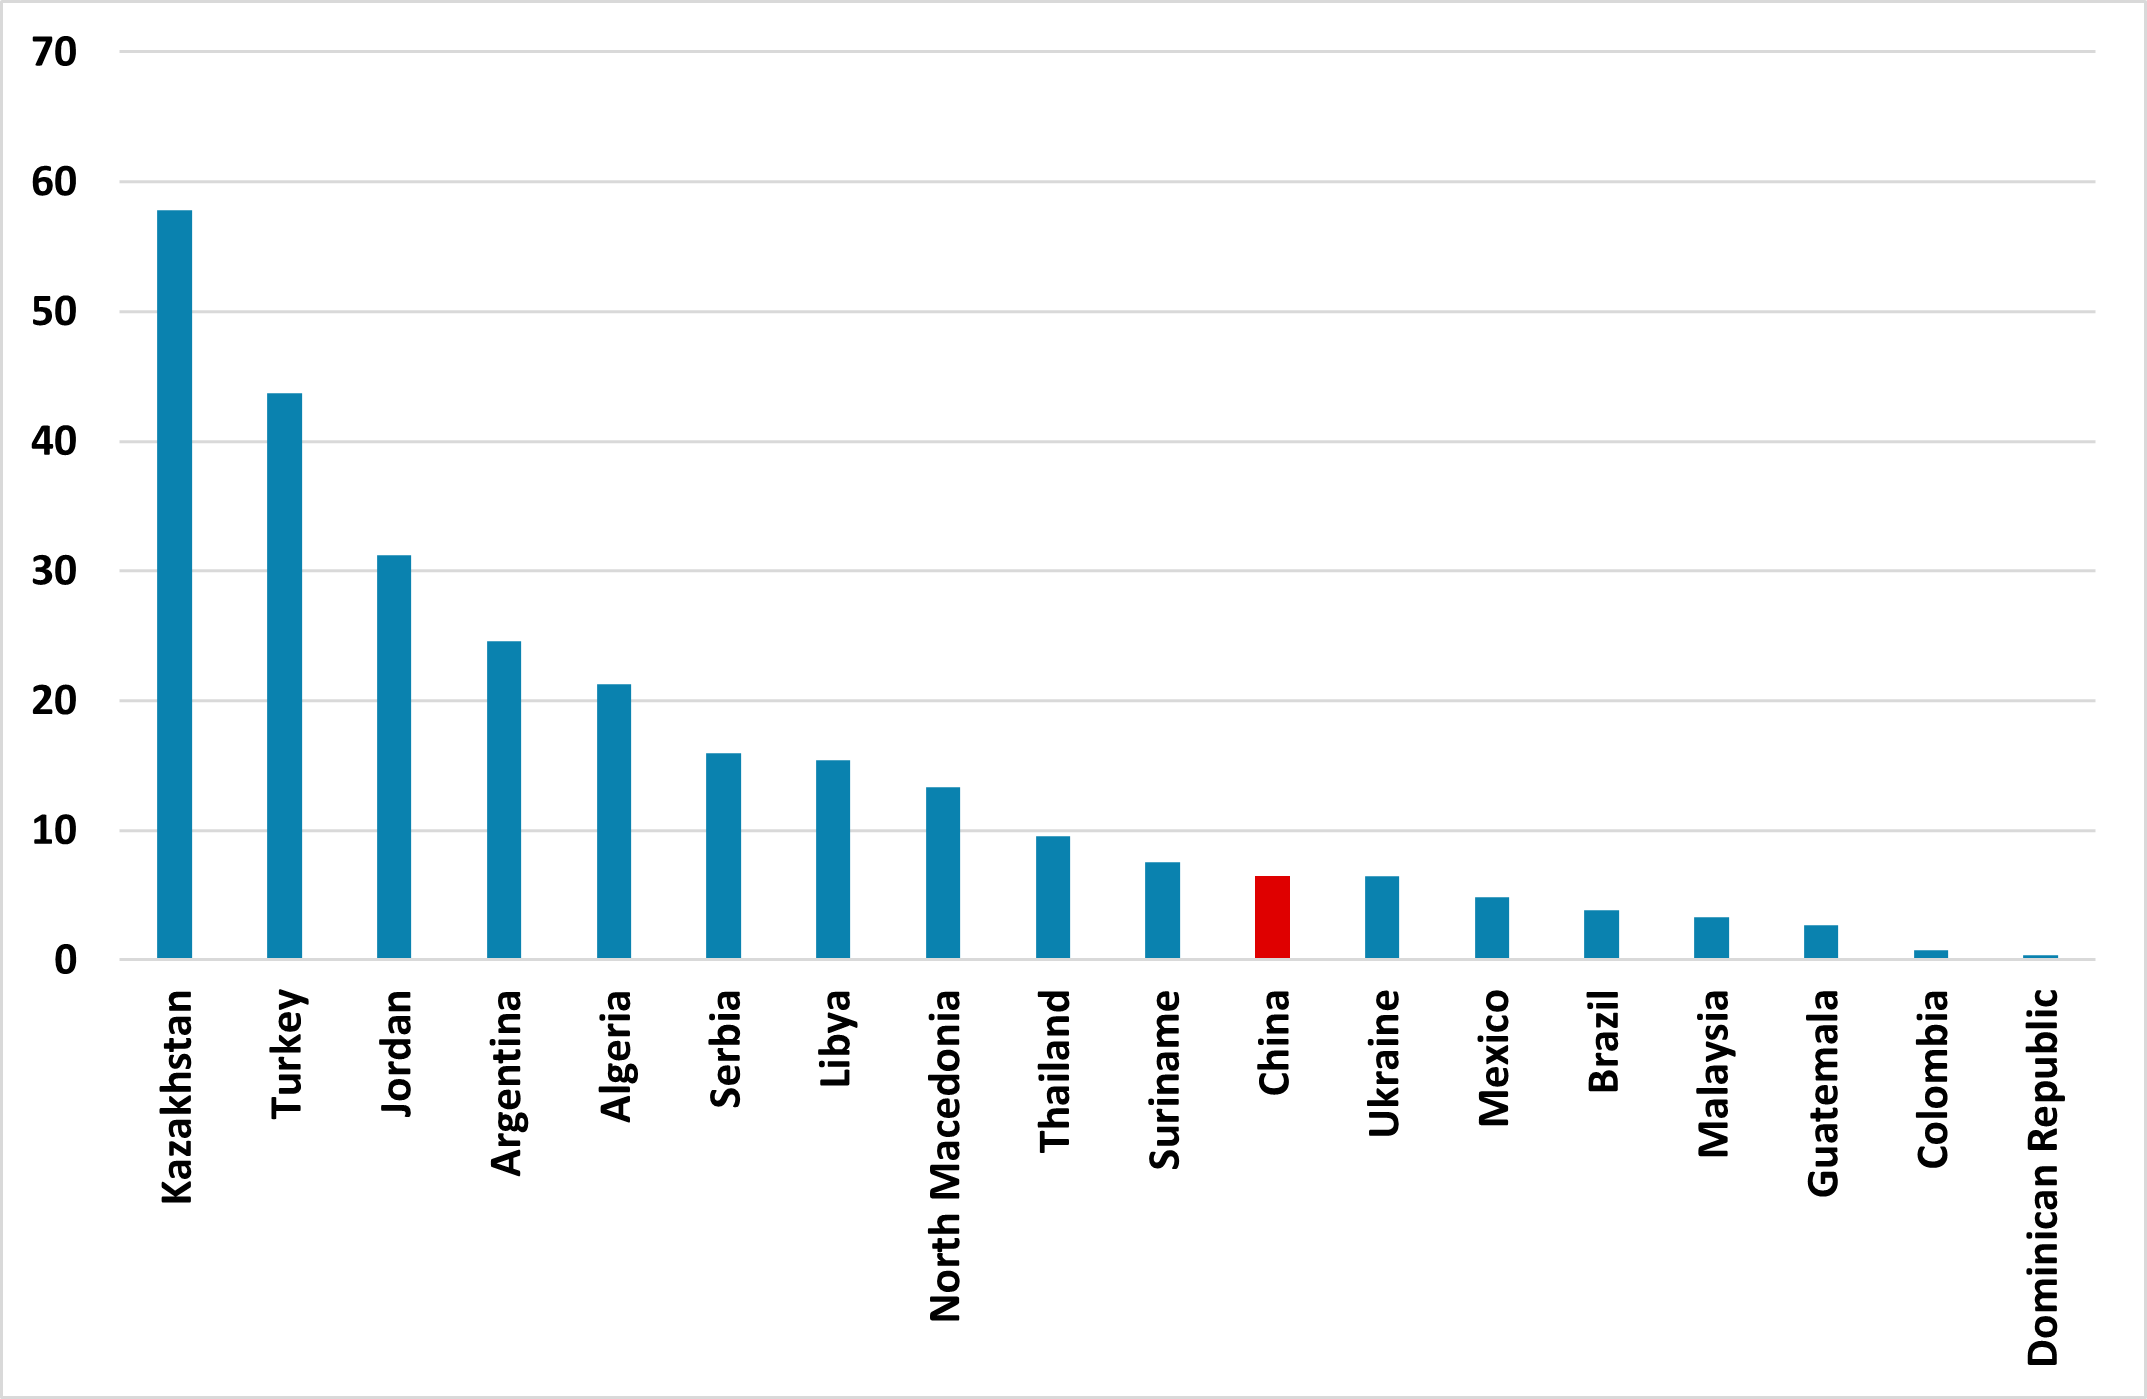
Source: World Gold Council / Continuum Economics
Another fundamental factor supporting gold prices is investor interest in gold-backed ETFs. Although the WGC reported the first outflow of funds in May since last November, total inflows for the year remain positive at USD 30 billion. Looking ahead, and as outlined in our U.S. chapter, we expect the Fed to cut rates once by year-end, with 10-year Treasury yields projected to reach 4.4% by the end of 2025 and 4.3% by the end of 2026. While this may offer some marginal support for gold, U.S. real yields remain elevated relative to their average over the past decade. Additionally, our expectation of a weaker USD is another supportive factor for gold prices.
Recently, global conflicts have helped push gold to new highs, but we view this as a temporary catalyst rather than a structural driver of long-term price growth. Combined with investor profit-taking and elevated prices weighing on retail demand, this leads us to maintain a moderately optimistic view on gold (but not overly so). In this context, we have revised our forecast upward to USD 3,200 by the end of 2025. For 2026, we expect continued central bank purchases, positive ETF inflows, and a weaker USD to support demand. However, elevated prices may act as a limiting factor. Accordingly, we have also raised our 2026 forecast to USD 3,400 by year-end. Key risks to this outlook include the escalation of current conflicts into broader regional or global crises, which would likely boost demand for gold. Conversely, a more cautious policy in central bank buying would pose a downside risk.