UK CPI Inflation Preview (May 22): Inflation to Fall Further and More Broadly
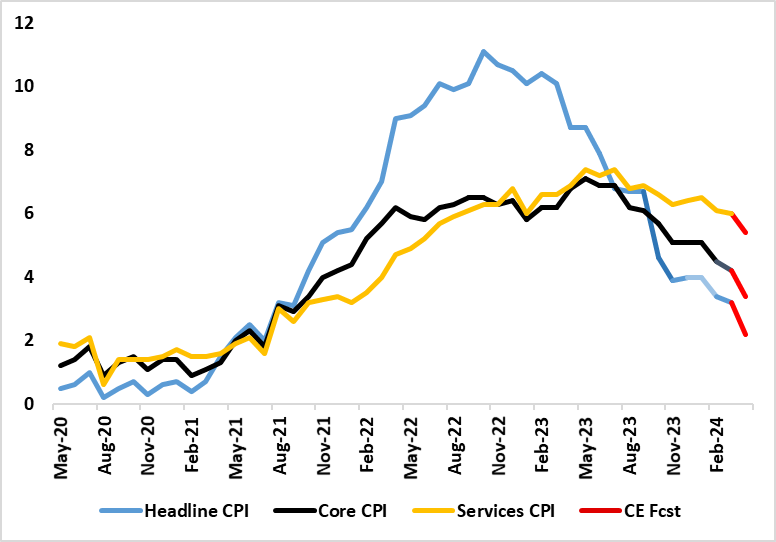
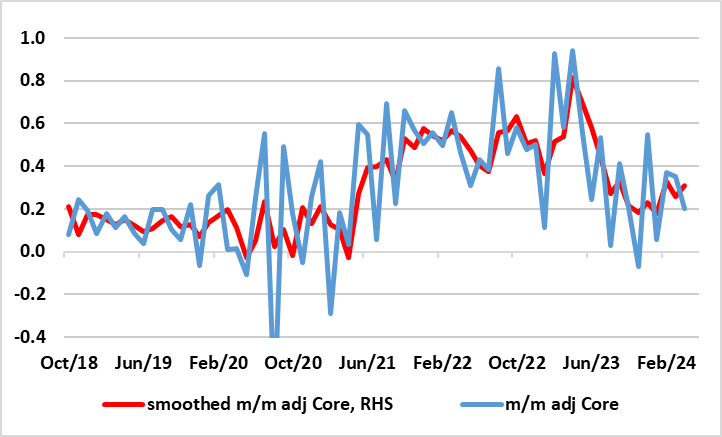
It is very clear that labor market and CPI data are crucial to BoE thinking about the timing and even existence if any start to an easing cycle. But perhaps the CPI data is the most crucial making the looming April data all the more important for markets as they weigh the chances of an initial rate cut from the MPC coming as soon as the verdict due on June 20, a decision that Governor Bailey has explicitly suggested remains up in the air. What the bar of acceptability is for the MPC in terms of the April CPI is unclear; do they just have to hit the forecasts laid out in the recent Monetary Policy Report, or undershoot, this assessment made all the more awkward as another set of CPI data are due the data before the next MPC decision. Helped by favourable base effects and the drop in the energy cap should mean a decisive and broad fall in the April headline of one ppt to 2.2% and of 0.6 ppt for services (Figure 1), the latter most influencing the MPC hawks’ emphasis on persistent price pressures. We also see the core down 0.8 ppt, this outcome consistent with an m/m adjusted reading back down to more target-consistent 0.2% (Figure 2).
Figure 1: Headline and Core Inflation Drop to Continue as Services Buckle?

Source: ONS, Continuum Economics
Such outcomes largely chime with BoE thinking for the April numbers, albeit with the CE services projection a notch below. The April data will be dominated by a drop in energy costs due a fall in the OFGEM cap, but this will be partly offset by a rise in petrol costs. But base effects should also see services inflation belatedly buckle, a development already being flagged somewhat by the drop in restaurant inflation – often considered to be a leading indicator of persistent inflation swings.
Beyond April
Notably, and as suggested above these April data are only art of the inflation story that will unfold ahead of the next MPC decision. The BoE envisages the headline falling to a below-target 1.9% in May and services then down to 5.3%, numbers we agree for the headline but see more of an undershoot for services, albeit where we also see a small rise back occurring in June – albeit solely for the headline though.
Policy Perspectives
Regardless, context is needed. UK headline and core inflation have been on a clear downward trajectory in the last few months, the former having peaked above 10% in February last year and the latter at 7.1% In May. After a pause in the preceding three months, this downtrend seemingly resumed in the February CPI numbers and clearly so (Figure 1), despite higher petrol prices, with food acting as a major offset. Moreover, it continued in March CPI data, albeit with more signs of resilient services inflation alongside additional hints that core inflation is also showing some resilience, at least in adjusted m/m numbers. Even so, the headline CPI rate fell 0.2 ppt to 3.2% y/y, the lowest in 33 months while the core fell a notch more significantly to 4.2%, albeit both readings a touch above consensus and BoE thinking.
Overall, and given what we think was far more mixed Q1 GDP than the media considered, we think the current thrust of data still leaves open the case and momentum for a BoE rate cut this quarter and further moves in H2 and then through 2025. This partly reflects BoE Governor Bailey choosing to underscore that (more supply-side) UK inflation dynamics are different enough to those in the U.S. to allow a possible cut before anything made by the Fed and thus chime with ever-clearer ECB policy leanings. Moreover, the MPR updated projections at least validated the rate path discounted by markets, with below target inflation, this possibly suggesting larger easing than the two moves this year, something that chimed with Governor Bailey remarks that market rate pricing prior to the last MPC decision may be too cautious.
Persistent Price Pressure Divisions
Any such BoE decision will be close and is already openly debated. Three-plus MPC members have lingering concerns about price pressures, something that is evident admittedly in recent core inflation outcomes. The last CPI numbers arrived a day after mixed labor market figures, which revealed slightly higher-than-expected wage outcomes but alongside clearly weak job dynamics,.
Figure 2: Adjusted Core CPI Pressures No Longer Falling Clearly?

Source: ONS, Continuum Economics, smoothed is 3 mth mov average
Backdrop Details
The softer March CPI data came alongside mixed PPI data at least for manufacturing. Regardless, CPI headline inflation slowed to 3.2% y/y, down from 3.4% in February. The largest downward contribution to the monthly change in CPI annual rates came from food, with prices rising by less than a year ago, while the largest, partially offsetting, upward contribution came from motor fuels, with prices rising this year but falling a year ago. Core CPI (excluding energy, food, alcohol and tobacco) rose by 4.2% in the 12 months to March 2024, down from 4.5% in February; the CPI goods annual rate slowed from 1.1% to 0.8%, while the CPI services annual rate eased slightly from 6.1% to 6.0%, this making the divergence between the two all the more striking and very much indicative of a disinflation process that seemingly is more supply influenced that demand. But it is also clear that rental costs are becoming clearer, now running over 7% y/y (and nearer 10% for private renting), this factor explaining the greater strength in CPIH inflation.
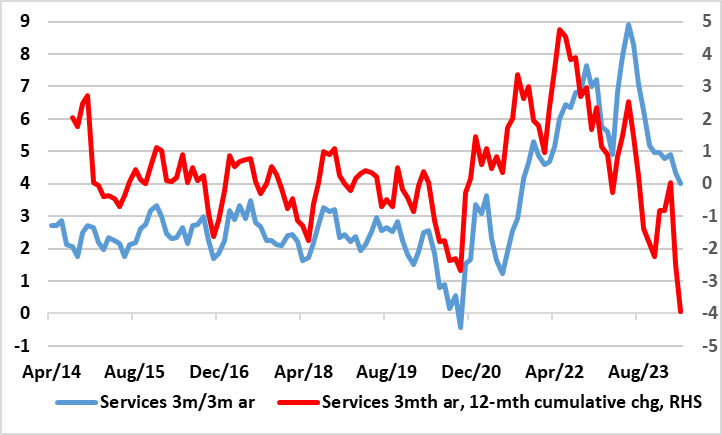
Figure 3: Current Fall in Adjusted Services Inflation Faster than the Surge

Source; ONS, CE
The March data continued the picture of the disinflation trend in our estimate of the seasonally adjusted data continued seen in months prior to December, albeit perhaps again less discernibly amid swings that we think at this juncture are noise rather than a change in tune. Indeed, on this basis, CPI core inflation was just above target and slightly more so as it was on a 3 mth/3 mth annualized basis, a measure that the BoE is starting to use more formally – indeed, and in contrast to the headline y/y figures there has been some clear fall in services price momentum as measured by the adjusted m/m numbers in the last few numbers however and to a degree where the monthly ppt falls have on average been greater than through the previous surge (Figure 3).