Eurozone: Does the ECB Have to Adjust its Inflation Thinking?
EZ Inflation has fallen clearly and faster than the ECB had expected with some Council members now acknowledging this. Indeed, implicitly accepting this ECB President Lagarde admitted yesterday that hardest and worst bit of the recent inflation surge was over and that the next move by the ECB, barring a fresh shock, was likely to be a cut in interest rates. But has the ECB gone far enough in admitting the scale of the disinflation already evident in an array of price gauges that it itself compiles? Given its stubborn over-reliance in looking at y/y rates, we continue to suggest it is overlooking an array of ever-clearer disinflation signals, perhaps most discernible in seasonally adjusted m/m HICP numbers now running near zero on a smoothed (ie three month moving average) basis. Of course this may not persist. However, as we think that as this reflects more the impact of ebbing supply problems than weak demand then more disinflation is on the cards as ECB tightening bites to weaken spending further. Moreover, such adjusted data also provides vital hints that a turning point on inflation has very much passed (Figure 1).
Figure 1: Headline m/m Price Pressures Running Near Zero

Source: ECB, CE where smoothed equates to 3-mth mov avg
Confused ECB Inflation Thinking?
In a very much unsurprising attempt to wrestle back market speculation about rate cuts starting as early as Q2, the ECB is underscoring that inflation this year will not fall as fast as seen in 2023. The question is whether ECB thinking on the inflation outlook has much authority given the overshoot of its projections into 2022 have given way to a clear undershoot more recently. Indeed, even on the basis of the headline rate having risen back to 2.9% in December due to short-lived German energy base effects, the Q4 average for the headline HICP was some 2.7%, 0.6 ppt lower than the ECB projections envisaged in September, with the core rate undershooting ECB thinking by a similar margin.
It is unclear what exactly is guiding ECB policy thinking and how it assesses inflation dynamics and what constitutes the target being attained. Ostensibly, it has to adhere to a policy stance that leaves inflation at the 2% target in the medium term (the latter interpreted as 2-3 years ahead). This is already the case, however, given the projections laid out last month which actually see inflation reaching 2% in H2 next year and settling at 1.9% through 2026. In other words, inflation is seen at or below target for six successive quarters and this on the basis of market rate thinking envisaging hefty cuts in the coming year.
Somewhat controversially, the ECB hawks, wounded by the inflation overshoots of the recent past, want to see more decisive and coincident evidence of actual inflation at or near target rather than relying on what have been inaccurate projections. So what more coincident measures do and/or should the ECB rely on?
Softer Signs in ECB Core Persistent HICP Measures
President Lagarde has repeatedly underscored the need to remain attentive to the risks of persistent inflation, something looking more and more misplaced. To address this, it is worth noting that there are also more and more signs of falling and less persistent underlying price pressures. Indeed, this is very evident in the latest updates on Persistent and Common Component of Inflation (PCCI) measures (Figure 3) compiled by the ECB itself in order to provide a more precise real-time indicator of the more lasting or persistent developments in headline and core inflation. In addition, not only is it a good tracker of more lasting and thus underlying inflationary developments, it is also timely and also (very importantly) signals turning points with some lead. Notably, the November PCCI measures fell further to as low as 2.0% for the headline and to below 2% on an ex food and energy basis, a 26-month low (Figure 2). This is all the more notable as the conventional HICP data has seen the headline fall below core with the relative resilience of the latter evidence of price persistence according to the hawks. The PPCI data suggest the very opposite!
Figure 2: Core Persistent Price Pressures Continue to Soften
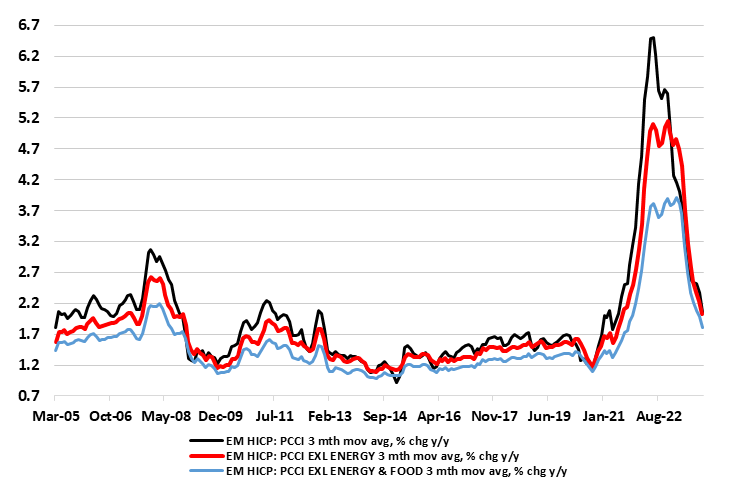
Source: ECB - Persistent and Common Component of Inflation, % chg y/y
But this disguises an even clearer fall in the most recent price dynamics, as seen in m/m seasonally adjusted data (Figure 1) that are also computed by the ECB itself. They show both the smoothed headline and core rate now consistent with a marked undershoot of the 2% target. The ECB instead continues to (at least overtly) focus on y/y rates despite the ensuing limitations from spurious base effects. It could be argued that using m/m adjusted data would place too much emphasis on what may be an aberrant monthly observation. But this applies equally to y/y rates too as the base effects may just as much reflect aberrant m/m observations. In addition, using a smoothed (ie 3-mth mov avg) would give a clear(er) idea of recent trends when using adjusted m/m data (as we have been using for some time). Moreover, when it comes to assessing real activity data, the ECB seems quite happy to look as the latest q/q or m/m figure in adjusted terns – why not then also for price dynamics too?
Adjusted Data Better for Highlighting Turning Points
As Figure 1 shows the smoothed adjusted rate offered a much earlier hint of what turned out to be more persistent price pressures in both early 2021 and early-2022. We think they are doing so again, especially as we think that most fi the inflation fall to date is a result of supply problems rather than weak demand. If so, then more disinflation is on the cards as ECB policy bites to weaken spending further.
Figure 3: Pandemic Damaged Growth Potential - Temporarily
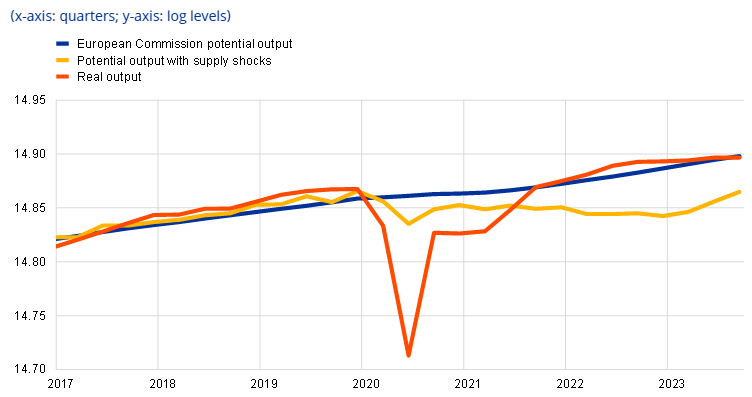
Source: ECB, alternative potential growth estimates and HICP core inflation
Supply Shocks the Key Factor – So Far
Supporting this view, a recent ECB working paper concluded that supply shocks explain the bulk of the post-pandemic EZ inflation surge, not just for the headline but also for core inflation. It shows that a counterfactual core inflation measure net of energy and global supply chain shocks has been more stable after the pandemic. This is important as the ECB hiking process has been aimed at taming demand. But if inflation rose in response to supply and that supply is now recovering then the result is that price pressures are being hit by both supply and (from here-on) demand factors. Another more recent ECB study very much corroborates this view in suggesting that supply shocks through and after the pandemic undermined potential growth but that the latter is now recovering as the supply shocks dissipate (Figure 3).
As for supply constraints, these are clearly ebbing according to survey data, most notably in regard to equipment, but where some labor shortages are still evident. Nevertheless, the demand for labor is also falling as weak demand and reduced pricing power are hitting company’s bottom lines.
Labor Supply Signals Increasing
This suggest that the current record-low jobless rate of 6.4% will not persist. While this may be causing some consternation amid the ECB hawks eyeing possible wage repercussions, this masks what has been a continued and marked rise in the unemployment level for younger (ie under 25), they more likely to consider looking for better paid work. In addition, and suggesting pressures likely to subdue wage increases, the jobs data highlights that labor supply continues to rise at a pace exceeding pre-pandemic rates, again where this is most clear-curt for the young, the latter partly explaining the rise in that version of the jobless level.
These alternative measures of assessing inflation discussed above are used in assessments by some of the less hawkish Council members, such a Chief Economist Lane, suggesting that they are used in Council discussions to some degree. Regardless, the ebbing price momentum they highlight supports our long-standing view that headline y/y inflation will fall further and down to the 2% target well before end-2024, and at least a full year earlier than current ECB thinking even if there may be some blips in coming months. Indeed, the growing risk is that the headline may hit the 2% target in the next 3-4 months. The ECB seems again to be poorly assessing even its own inflation indicators with a continued over-reliance on y/y rates. If it looked at the adjusted numbers, it would recognize that the 2.6% end-2024 rate it sees for HICP inflation, actually needs the m/m figure to average an annualized 4% in the next 12 months – is this really what the data suggest is likely?