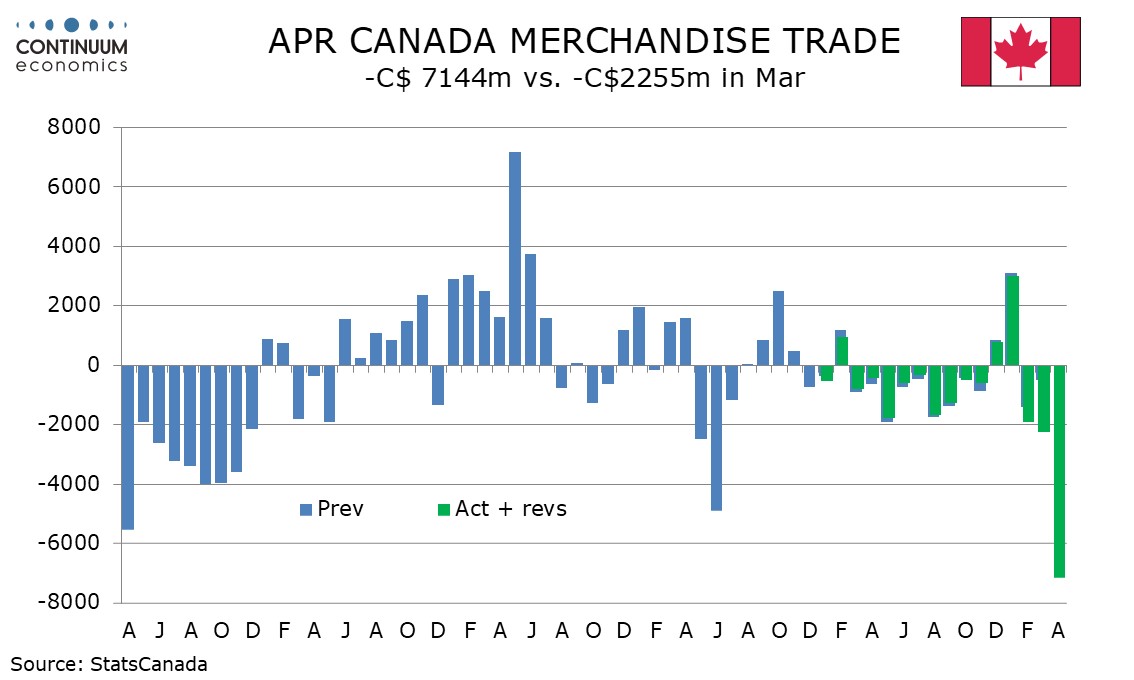
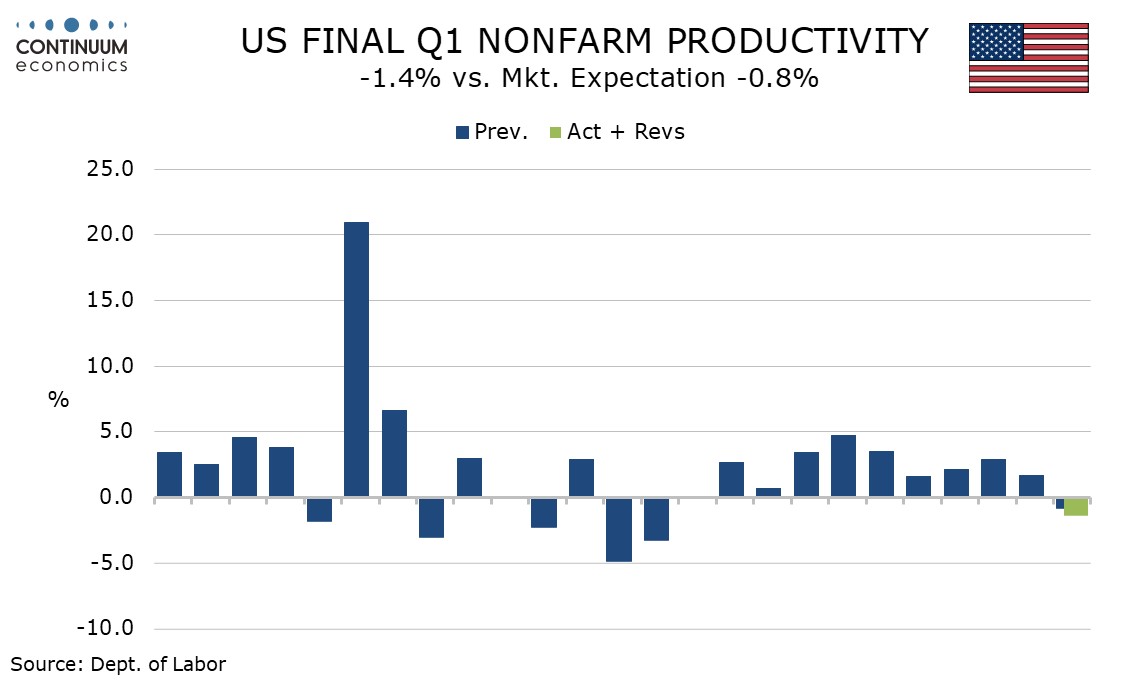
U.S. April Trade Deficit plunges as Canada's deficit surges, US Q1 Productivity revised lower
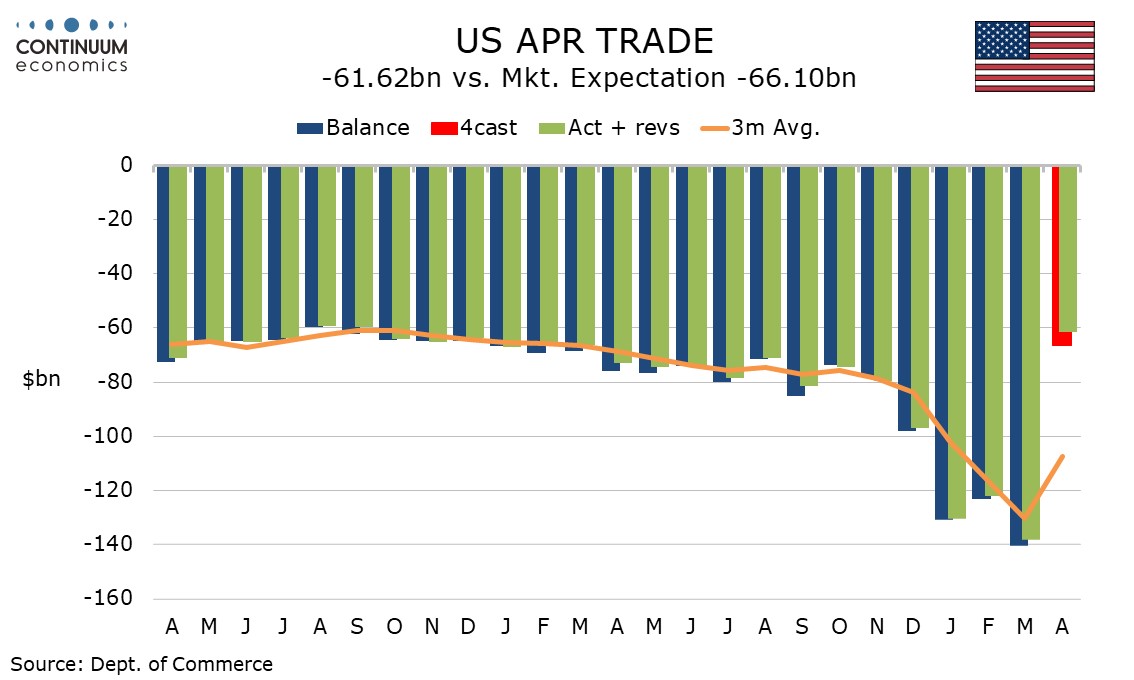
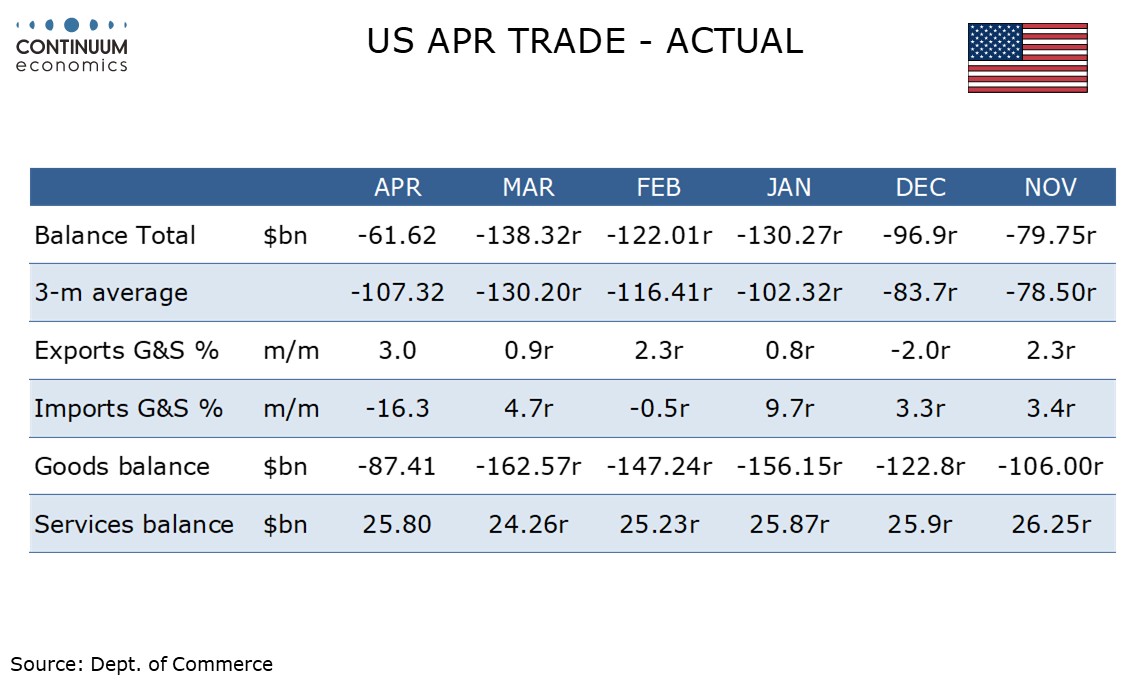
April’s deficit of $61.6bn from $138.3bn in March was even narrower than expected. Goods data was consistent with advance data already seen but the services surplus added to the improvement with an unexpected increase. An unexpected downward revision to Q1 non-farm productivity and an upward revision to unit labor costs is explained by an upward revision to hours worked.
Goods trade data shows a 3.4% rise in exports, a fourth straight increase, but a 19.9% plunge in imports after Q1 levels inflated by the anticipation of tariffs. This is almost identical to advance goods data which showed exports up by 3.4% and imports down by 19.8%.
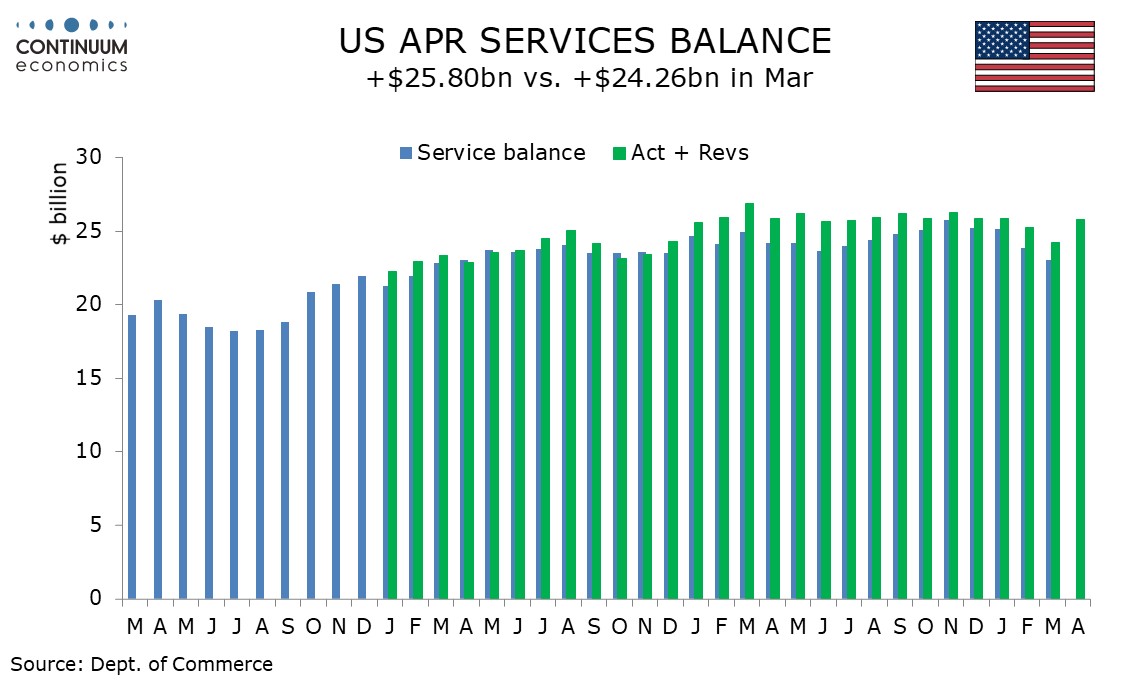
Services however showed a 2.1% rise in exports after three straight declines, suggesting the hit to US tourism from reluctance to visit the US, particularly from Canadians, is fading. This outpaced a 0.7% rise in service imports. Adding to the services surprise were historical upward revisions to the surplus.
While the US trade balance appears to be improving sharply in Q2, and that will reverse a large negative in Q1 GDP, Canada’s trade balance is deteriorating sharply, with its deficit surging to C$7.14bn in April from C$2.26bn in March, with exports plunging by 10.8% and imports down by 3.5%
Canadian exports to the US fell by 15.8% while imports from the US fell by 10.8%. Canadian trade with the rest of the world hit an all-time high. Still, with trade with the US making up 70% of exports and 57% of imports the US data dominates, and is likely to send Canadian GDP lower in Q2.
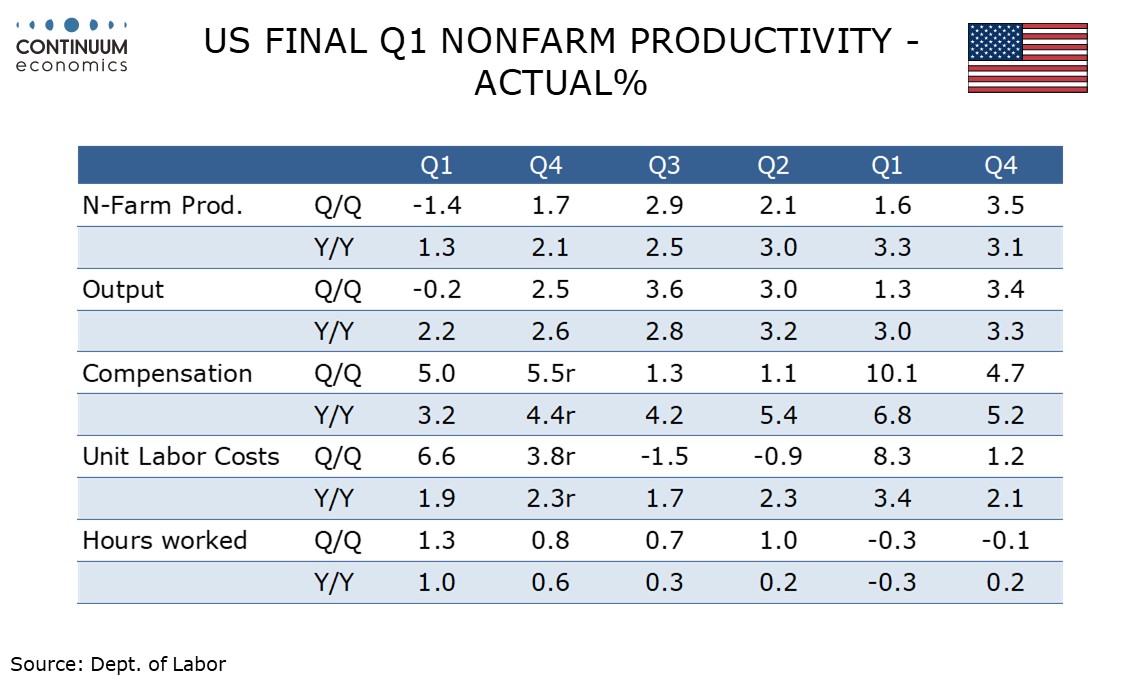
The downward revision to US non-farm productivity was unexpected with output revised marginally higher to -0.2% from -0.3% but hours worked were revised up to 1.3% from 0.6%, causing productivity to be revised down to -1.4% from -0.8%. Revisions to March non-farm payrolls were negative but the workweek was revised higher.
The productivity revision led the revision to unit labor costs but a modest upward revision to compensation to 5.0% from 4.8% also contributed, and unit labor costs were revised up to 6.6% from 5.7%. Non-labor costs were revised down to -0.2% from a 0.9% increase so the overall deflator was unrevised at 3.5%.
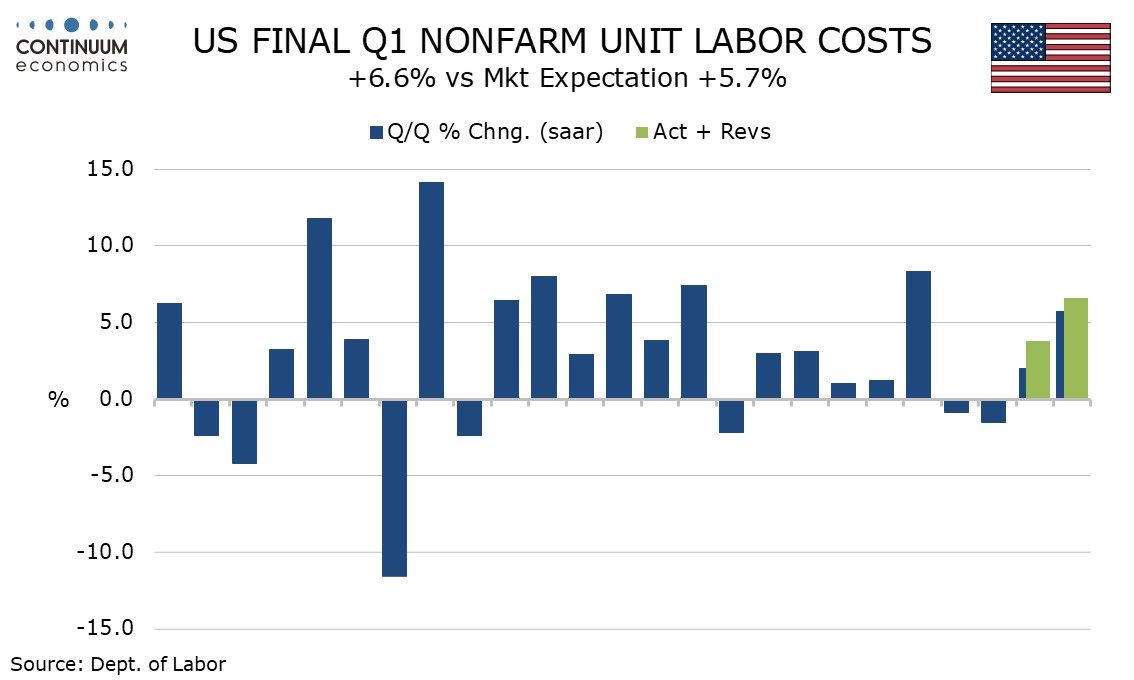
Yr/yr growth stands at 1.3% for productivity, 1.9% for unit labor costs and 2.2% for the overall deflator, which suggests inflationary pressure in Q1, ahead of most tariffs, was moderate.