UK Labor Market: More Signs of Clearly Softer Wage Pressure
As we have underscored repeatedly, the BoE has come to regard the official average earnings data with some suspicion; after all, they have implied wage growth being well above other official and survey sources. But now they too are showing signs of a material slowing in pay growth probably reflecting clear signs of a looser labor market, most notably evident in a further and significant drop in vacancies in the latest data. As such they now chime more with HMRC (the UK tax authority) sources data, which show a further and sizeable drop in mean and median pay growth. (Figure 1). That would also leave the ONS data on track to undershoot BoE thinking for private sector regular earnings not only for last quarter (ie 7.2%) by over a ppt but even for the current quarter. Regardless, straying away from the usual y/y measures of pay and earnings reveals even clearer signs of weaker remuneration in both the official ONS compiled labor force data as well as in the HMRC data, the latter actually suggesting that the level of pay has stopped rising.
There are increasingly clear signs of slowing wage pressures, most discernibly in terms of the manner flagged by weaker bonus growth. The latter is something the BoE will be paying ever clearer attention to and drawing reassurance from as it assesses that signs of more persistent inflation pressures have started to abate.
Figure 1: Conventional Measures of Pay Growth Easing Clearly?
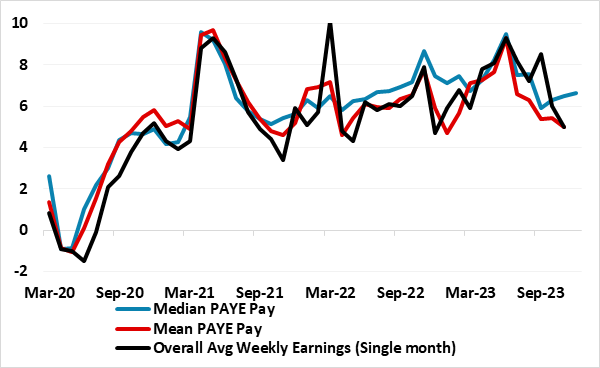
Source: ONS, HMRC, % chg y/y
During last quarter, the estimated number of vacancies in the UK fell by 49,000 on the quarter to 934,000. Vacancies fell on the quarter for the 18th consecutive period, the longest consecutive run of quarterly falls ever recorded but still above pre-coronavirus pandemic levels. As for pay and earnings, annual growth in regular earnings (excluding bonuses) was 6.6% in September to November 2023, and annual growth in employees' average total earnings (including bonuses) was 6.5% in September to November 2023, both down markedly from the previous estimate. Single month numbers were even softer with both the headline and regular pay measures dipping under 6%, actually below HMRC pay growth numbers.
As we highlight below, officially computed seasonally adjusted - but m/m presented – ONS earnings and HMRC pay data also offer a very much more benign cost picture than y/y numbers (Figure 2) with every likelihood that this may trigger a fresh dose of downward pressure on CPI inflation. Surely, this is likely to temper what is clearly at the core of the BoE’s worries about inflation persistence
Figure 2: Stark Contrast - Adjusted m/m Earnings vs y/y Data
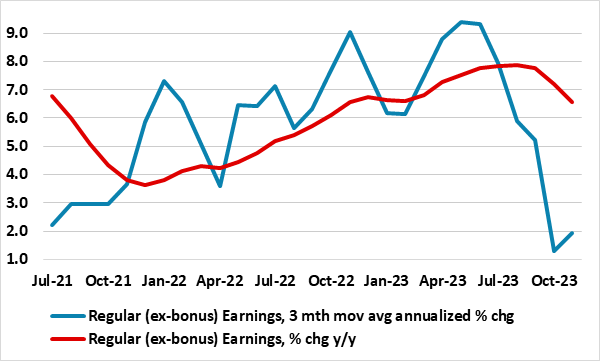
Source: ONS, all seasonally adjusted
The BoE still puts more weight on the ONS compiled average earnings data, also suggesting that the data is not subject to the same measurement problems that have rendered most of the rest of the labour force survey so unreliable. Even so, these official earnings data are nonetheless subject to revision, thanks to late returns and can be pretty volatile, particularly over short periods of time; and, for much of this year, the headline figure has been higher than many other indicators of wage growth, not least more recent survey indicators. In addition the data provide insights into the mean and median rates of pay, something the BoE is interested in, not least as it thinks the latter may be more informative. This is something that the HMRC does not provide. The latter also covers a much larger sample size than the ONS earnings numbers: it covers all subject to PAYE income tax (around 30 million people and is thus more than twice the size of the ONS numbers). Helpfully, it also has a wealth of detail as it also offers a sectoral breakdown, allowing the construction of a reasonably good proxy for private sector pay alone. One drawback the BoE points to is that, unlike the ONS numbers, there is no distinction between regular and bonus pay, this being important to the MPC generally which cares more about regular, non-bonus pay growth. This preference can be questioned as bonus pay is often a lead indicator of regular pay, albeit where an unusual divergence has appeared in the current cycle (Figure 3)!
Figure 3: Stark Contrast – Bonus Pay Suggests Turning Point Passed
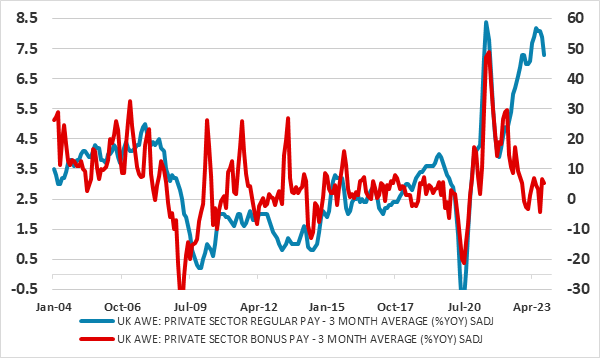
Source: ONS, all seasonally adjusted