The Aussie Chapter 2: Commodities
In "The Aussie", we will look into the "well-known "correlation among the Aussie and well-known benchmark to give our readers a closer look towards factors that have been affecting the movement of the Australian Dollar. In Chapter 2, we will look into the performance of the Aussie against commodities.
Australia is one of the largest commodity exporters in the world. The five commodities that Australia export the most (in terms of USD value) are iron ore (12.4b), coal (12.7b), natural gas (9.2b), gold(2.4b) and wheat(1.4b) in 2022-23. Historically, commodity trading has been supporting the economic growth of Australia and will continue to be one of the key pillars for the Australian economy. Thus, the price fluctuation of commodity is often linked to the volatility in the Aussie as the pace of Australian economics growth are affected by the change in commodity trading.
In this chapter, we will look into historical performance of commodity and the Aussie. The commodity prices are benchmark against the USD, so it is only fair we measure it against the AUD/USD.
Figure 1: AUD/USD Performance with reference to a basket of commodity
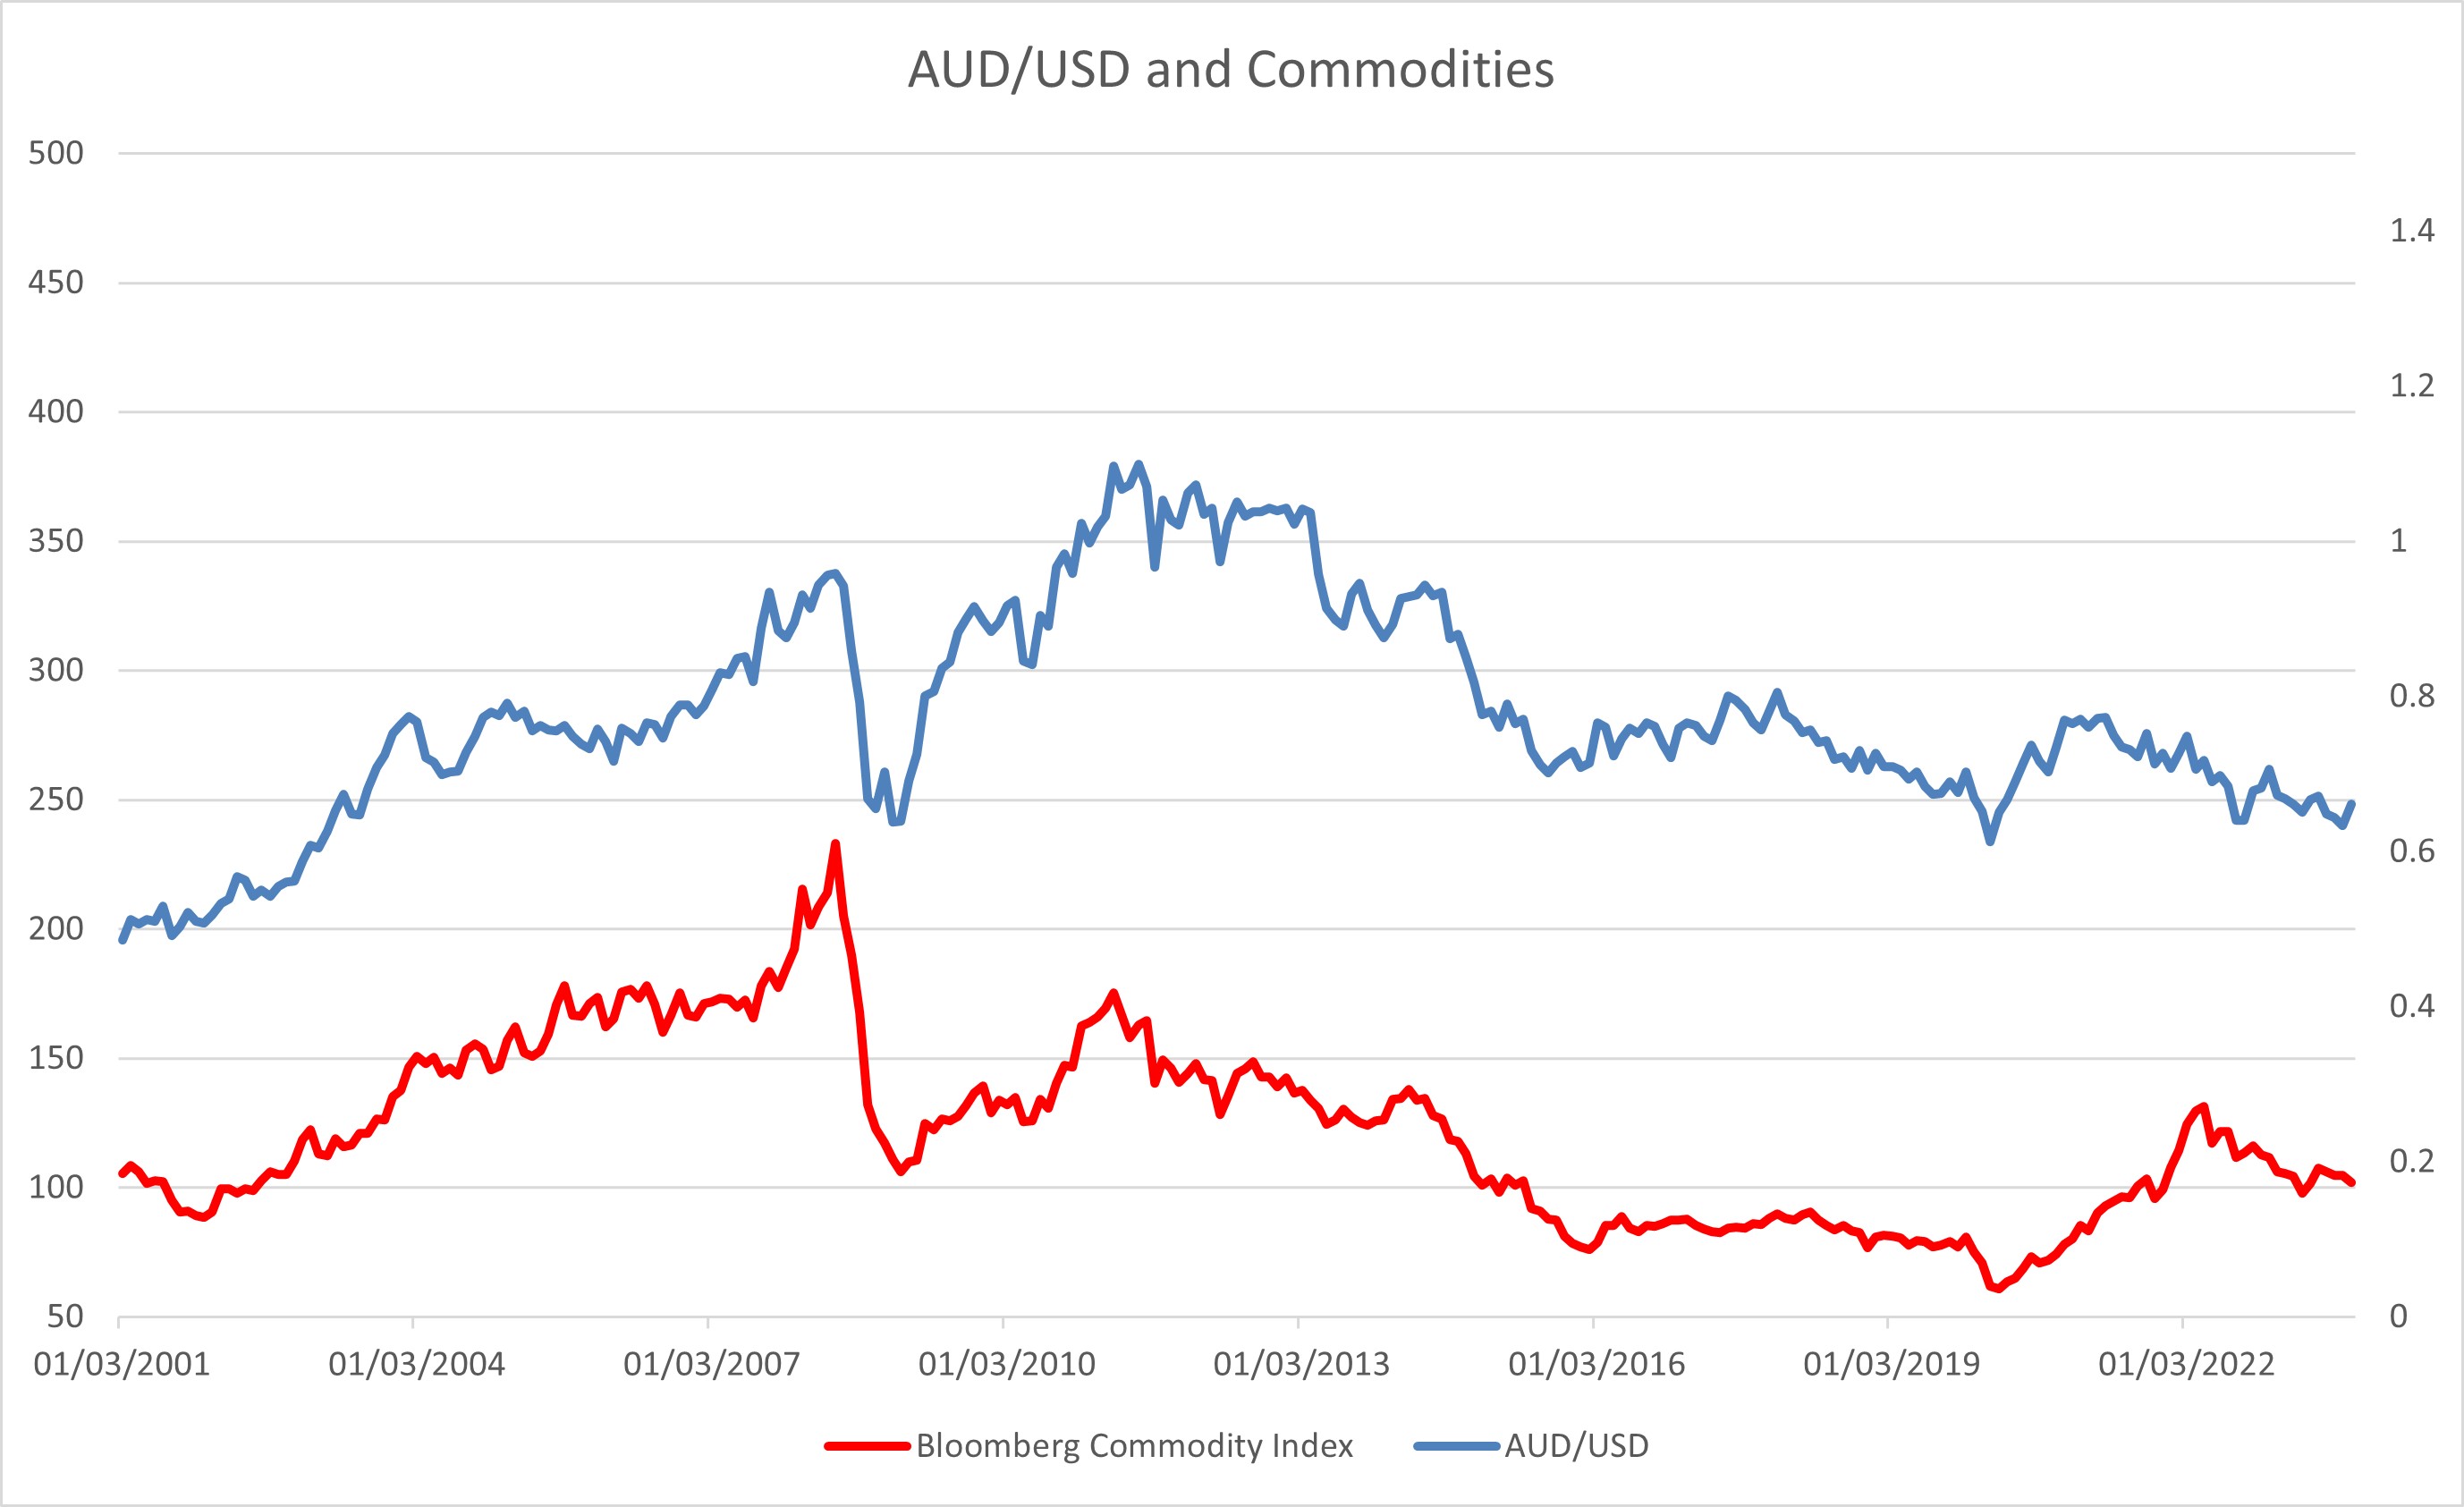
Figure 1 showed how the AUD/USD perform against a basket of commodities. In 2022-2023, Australia has exported AUD 608,439 million in commodities, accounting slightly less than a quarter of Australian GDP.
The chart looks quite identical at first glance and suggest the correlation between AUD/USD and commodity prices are indeed strong. Apart from a brief period in 2001-2002, the overall trend in AUD/USD can be seen closely tracked by the commodity index, with minor difference in the time interval in trend changes (less than 2 months). It shows the AUD/USD and commodity prices are likely to be correlated.
Figure 2: AUD/USD Performance with reference to iron ore
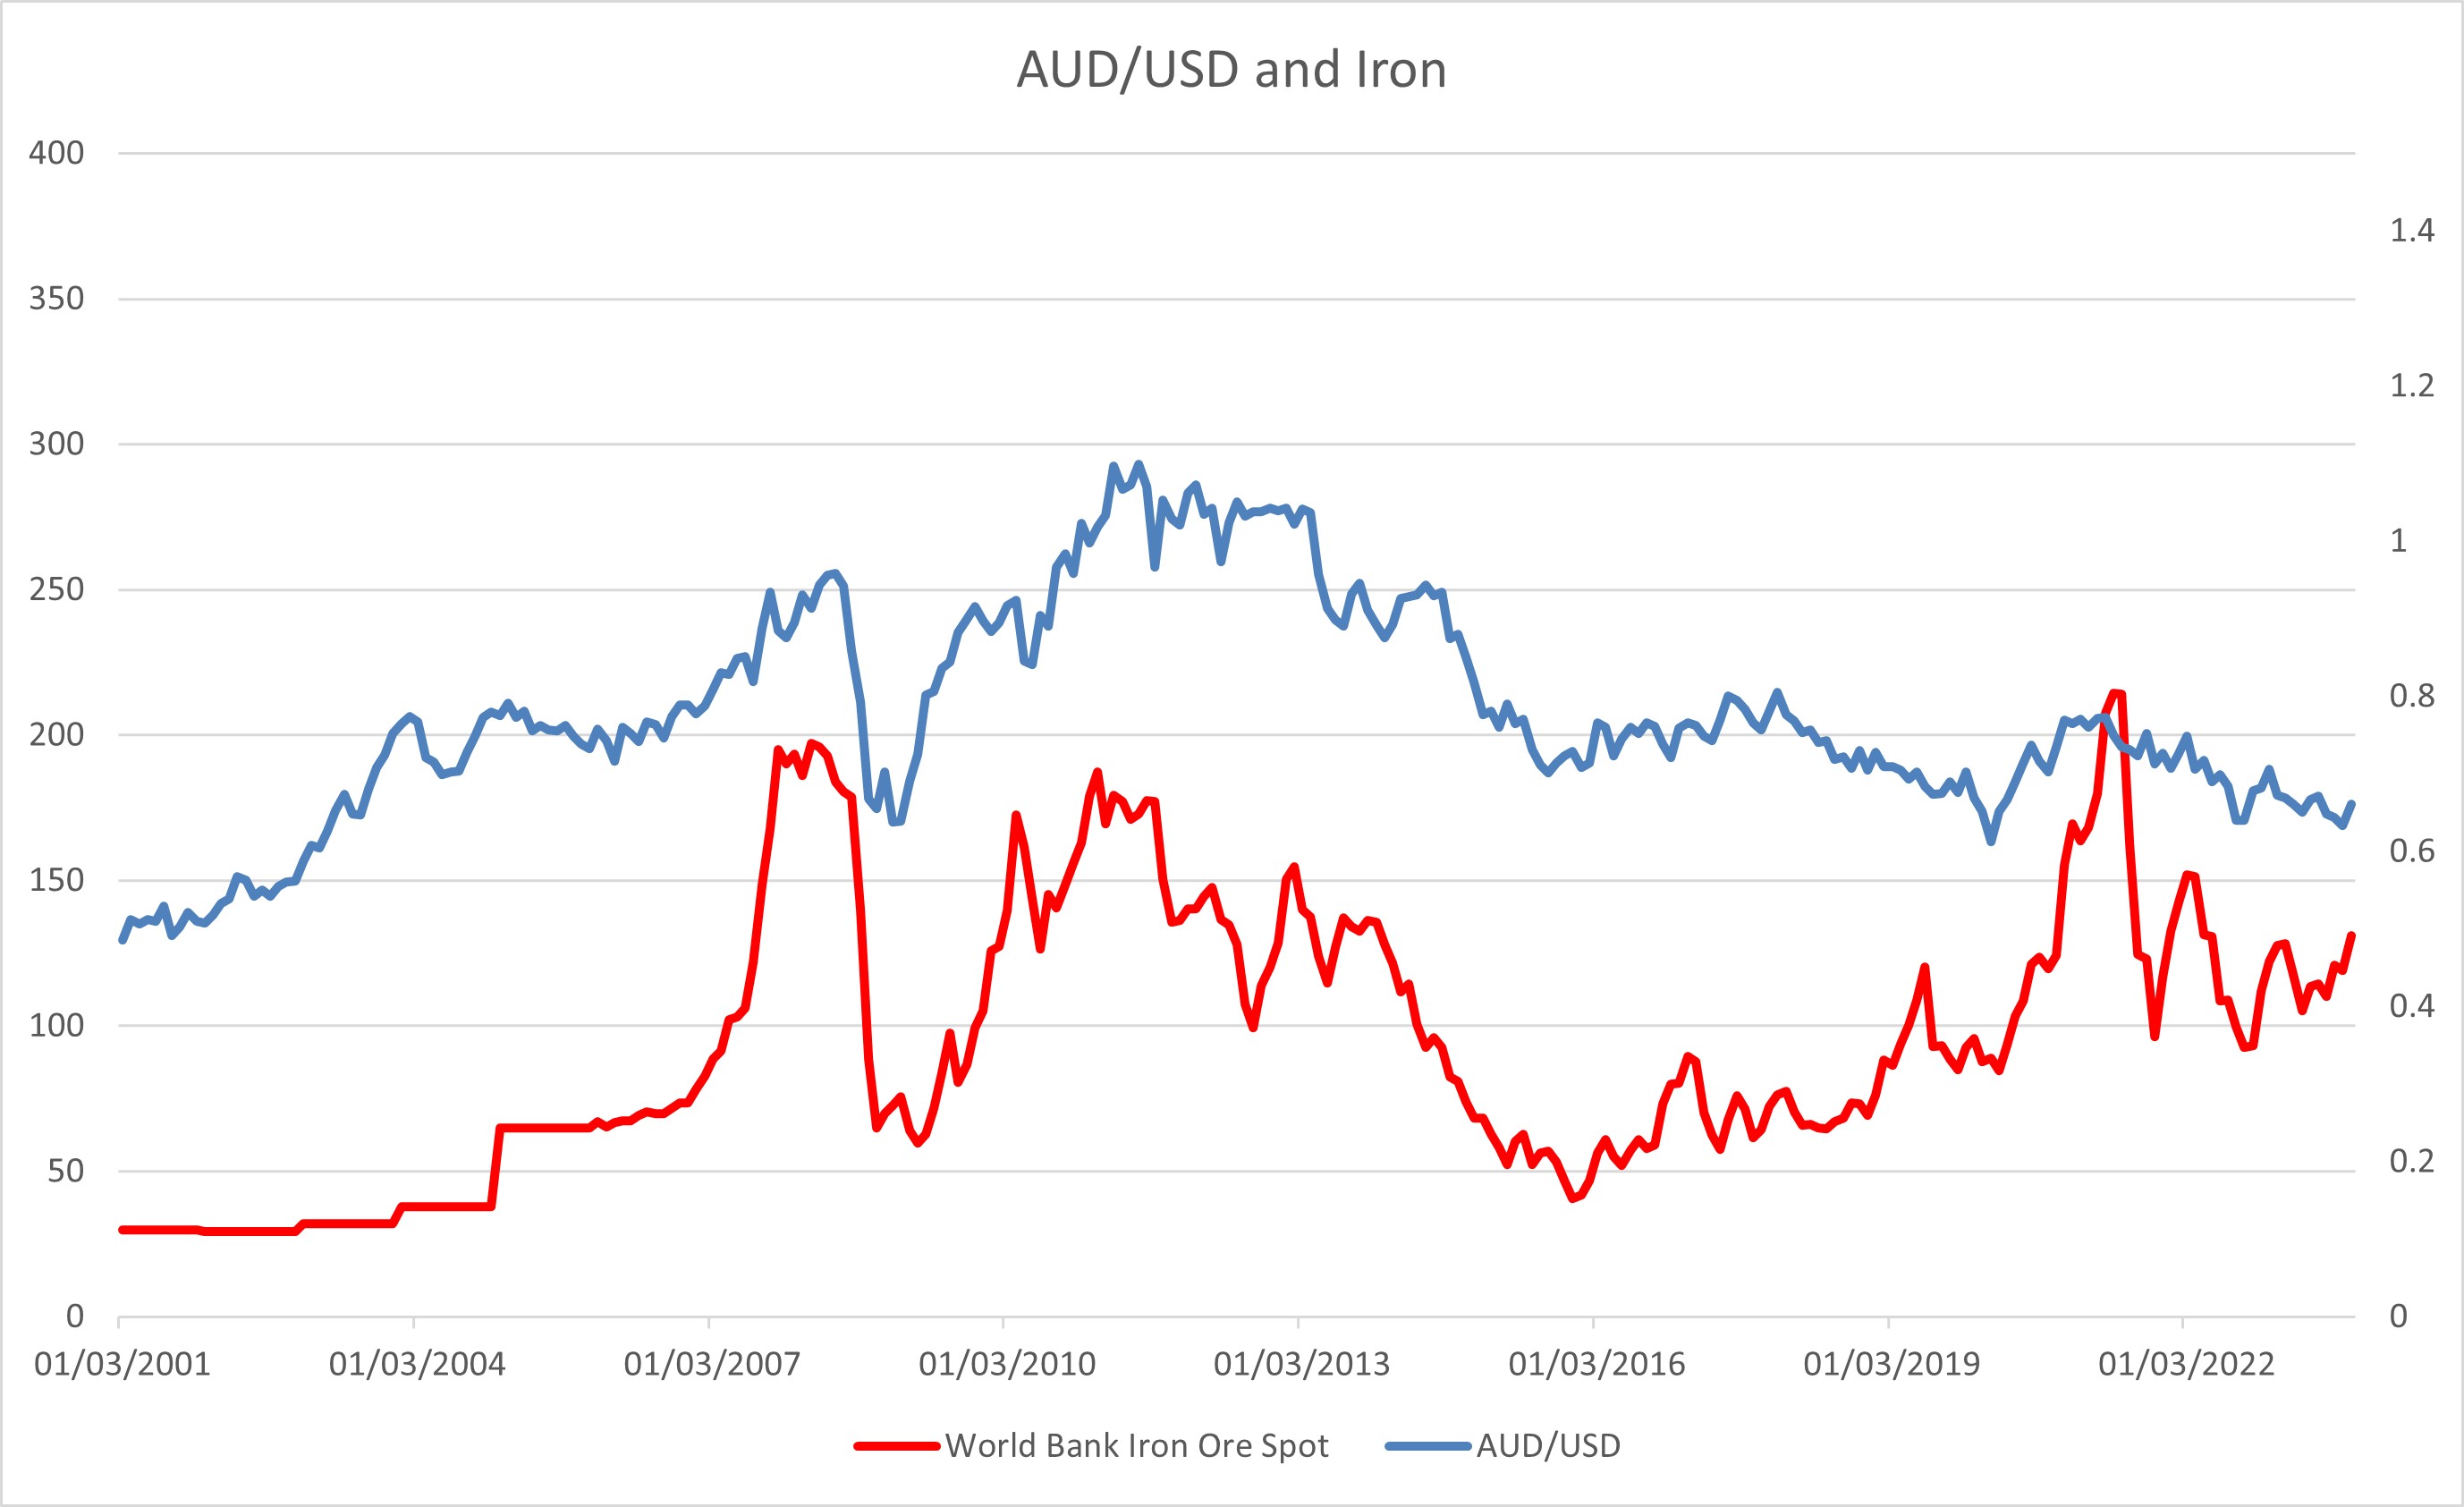
Figure 2 showed how the AUD/USD perform against the spot price of iron ore. Australian exported AUD 12.4B iron ore in 2022-2023. Iron ore used to be Australian largest export for the past decades but have been over taken by coal in 2022-2023.
Iron ore price has been steady in 2001-2004 and began to show more volatility since 2005. In the beginning of 2007, iron ore prices ascended sharply throughout 2008, only to erase all gains in 2009. Iron's price resume traction throughout 2010-2012 and was in a down trend from 2012-2016 and gradually strengthening till 2021 before correcting since but remain generally in an uptrend.
From the chart, we could see a general correlation between the AUD/USD and Iron Ore prices but it is not as tightly tracked as the commodity index. The correlation is stronger from 2007 to 2016 and the correlation turns negative after 2018 till now as we see iron prices gradually grinds higher while AUD/USD treads lower. While the correlation has weakened in the past few years, the price of iron ore still tracks AUD/USD's performance better than other commodities.
Figure 3: AUD/USD Performance with reference to coal
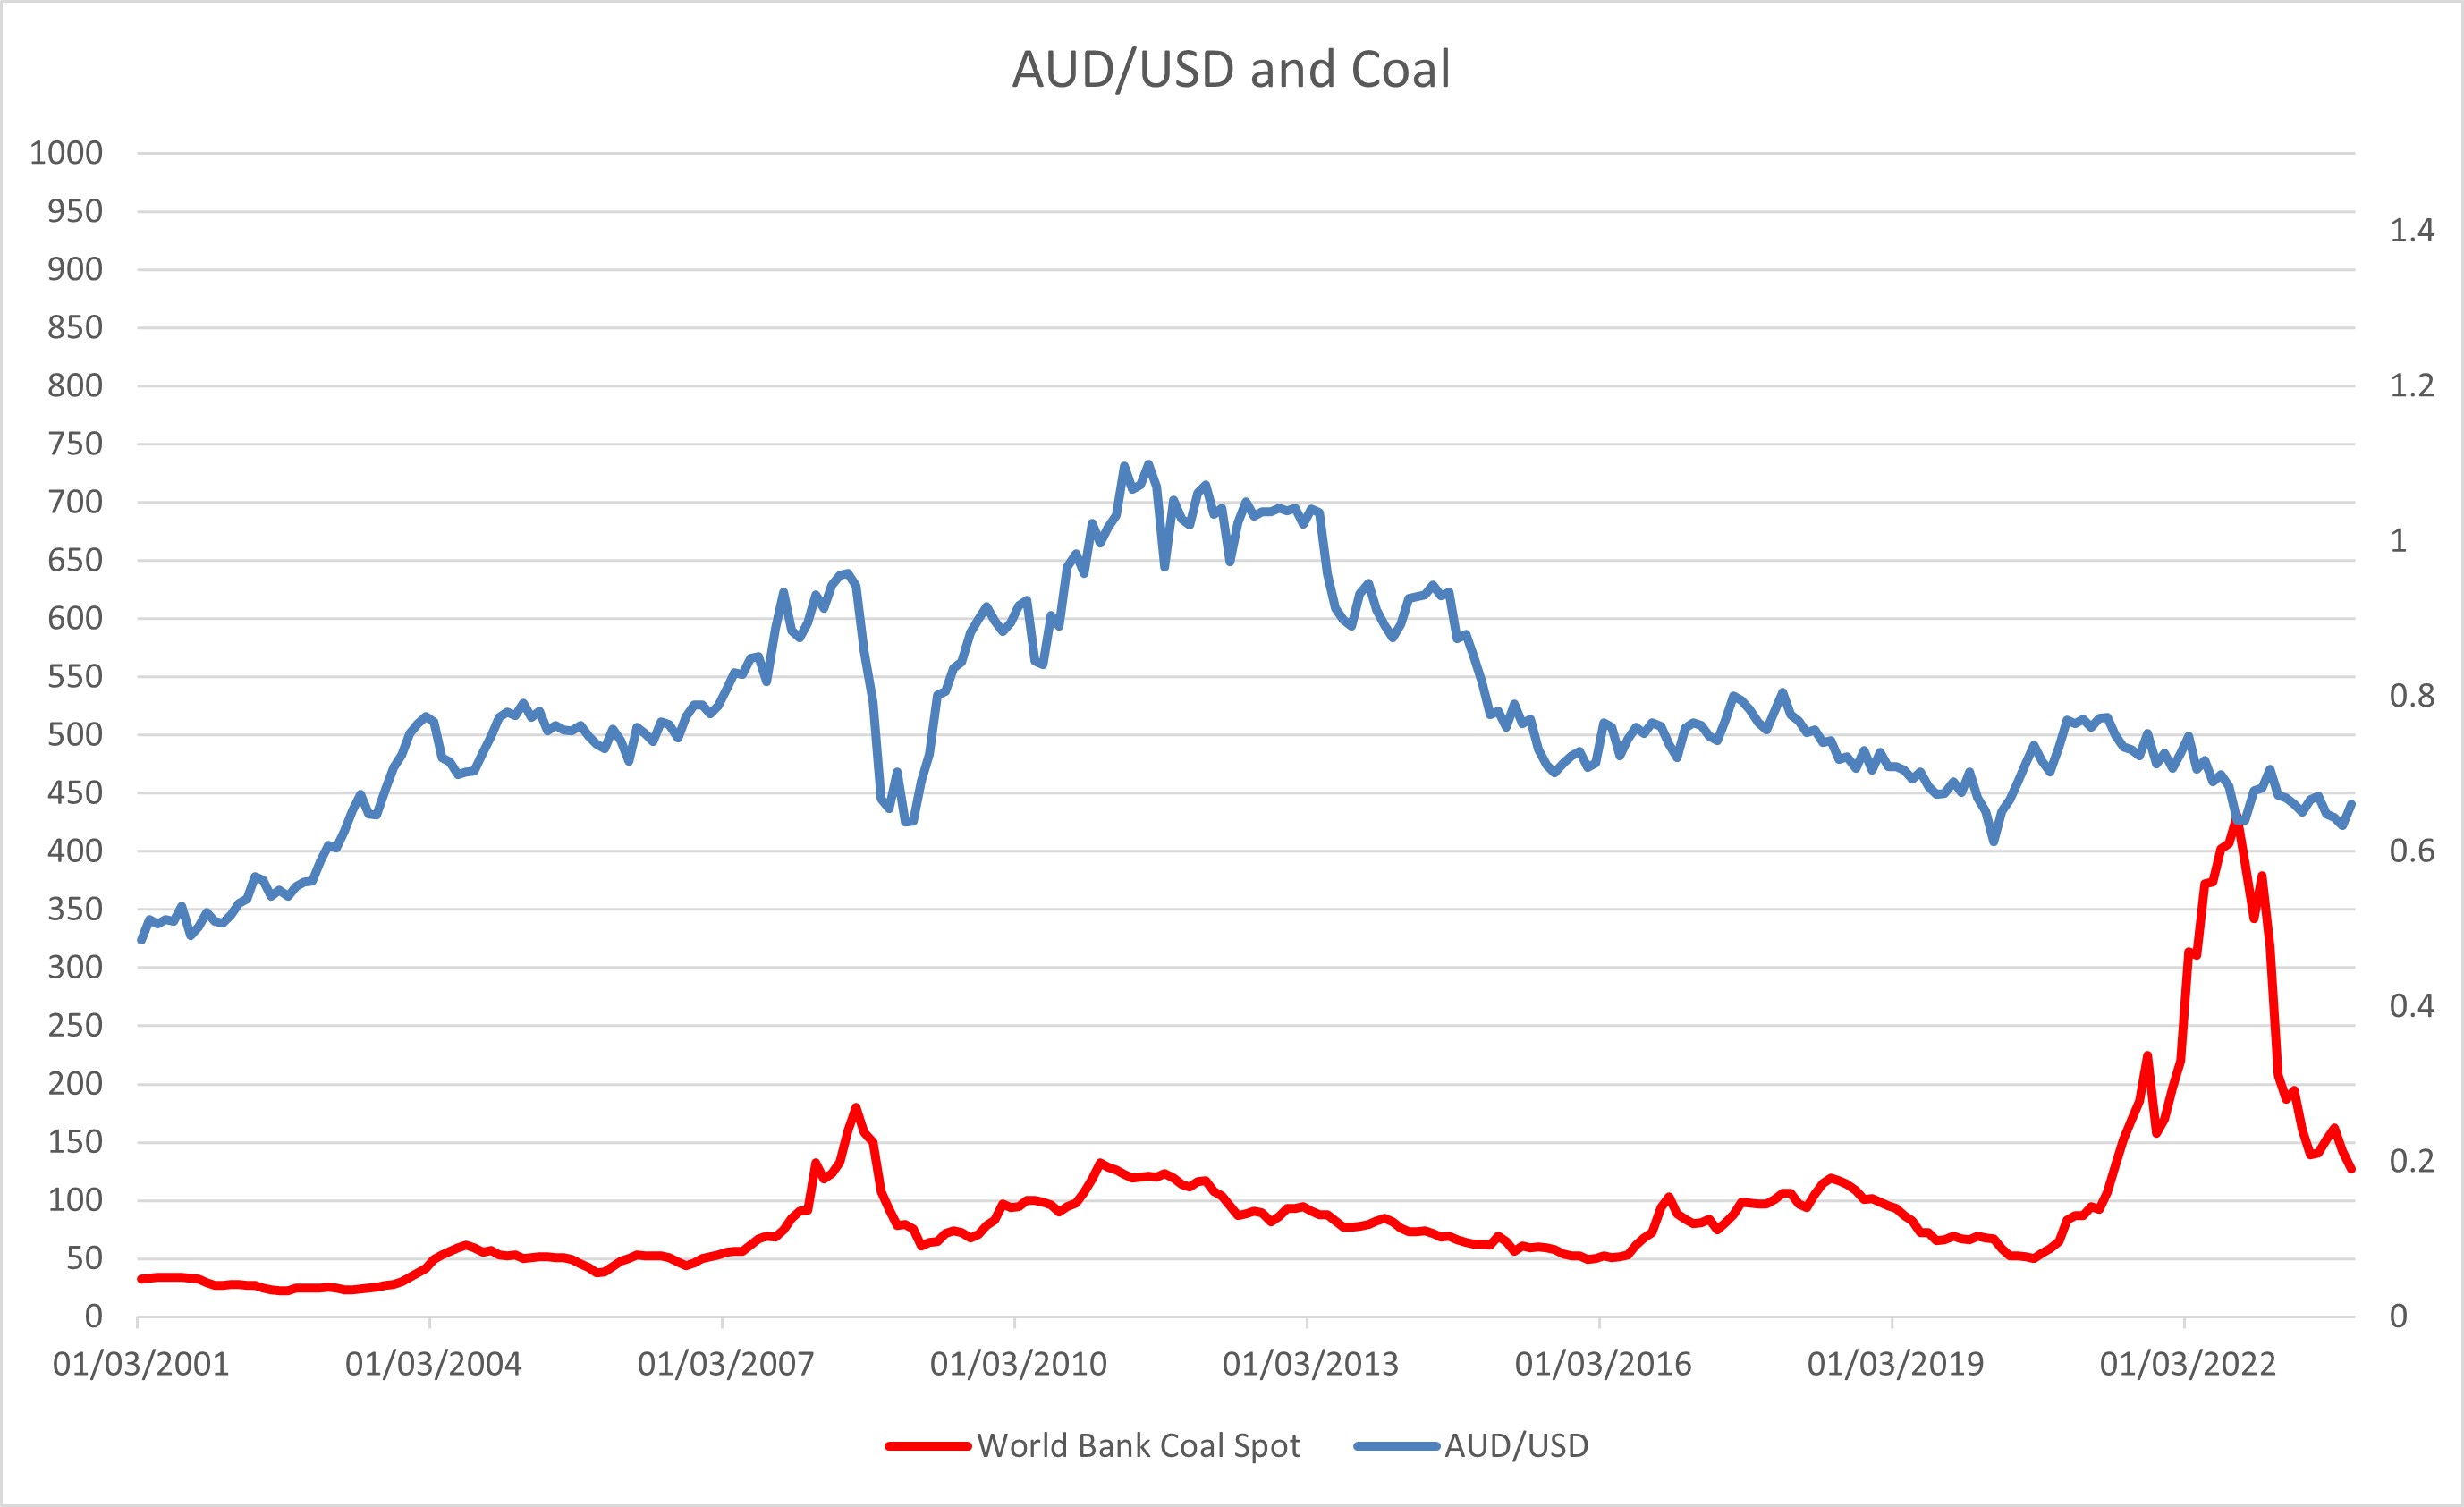
Figure 3 showed how the AUD/USD perform against the spot price of coal (all). Australian coal demanded jumped in 2022-2023, more than doubling from the previous year. Australia exported AUD 14.2b coal in 2022-2023 and have overtaken iron ore's first spot in export. Coal has been the second largest commodity export for years.
Coal price has been relatively steady from 2001-2007 with a jump in 2004. There is another spike in 2008 and 2021-2022, else coal's price has been in trading in trend. Apart from 2001-2004, the correlation between performance of AUD/USD and coal price is weaker than iron ore price, which is understandable given the proportion of export coal used to occupy in previous decade. There is a certain level of correlation as both trends are similar until 2021-now.
Figure 4: AUD/USD Performance with reference to natural gas
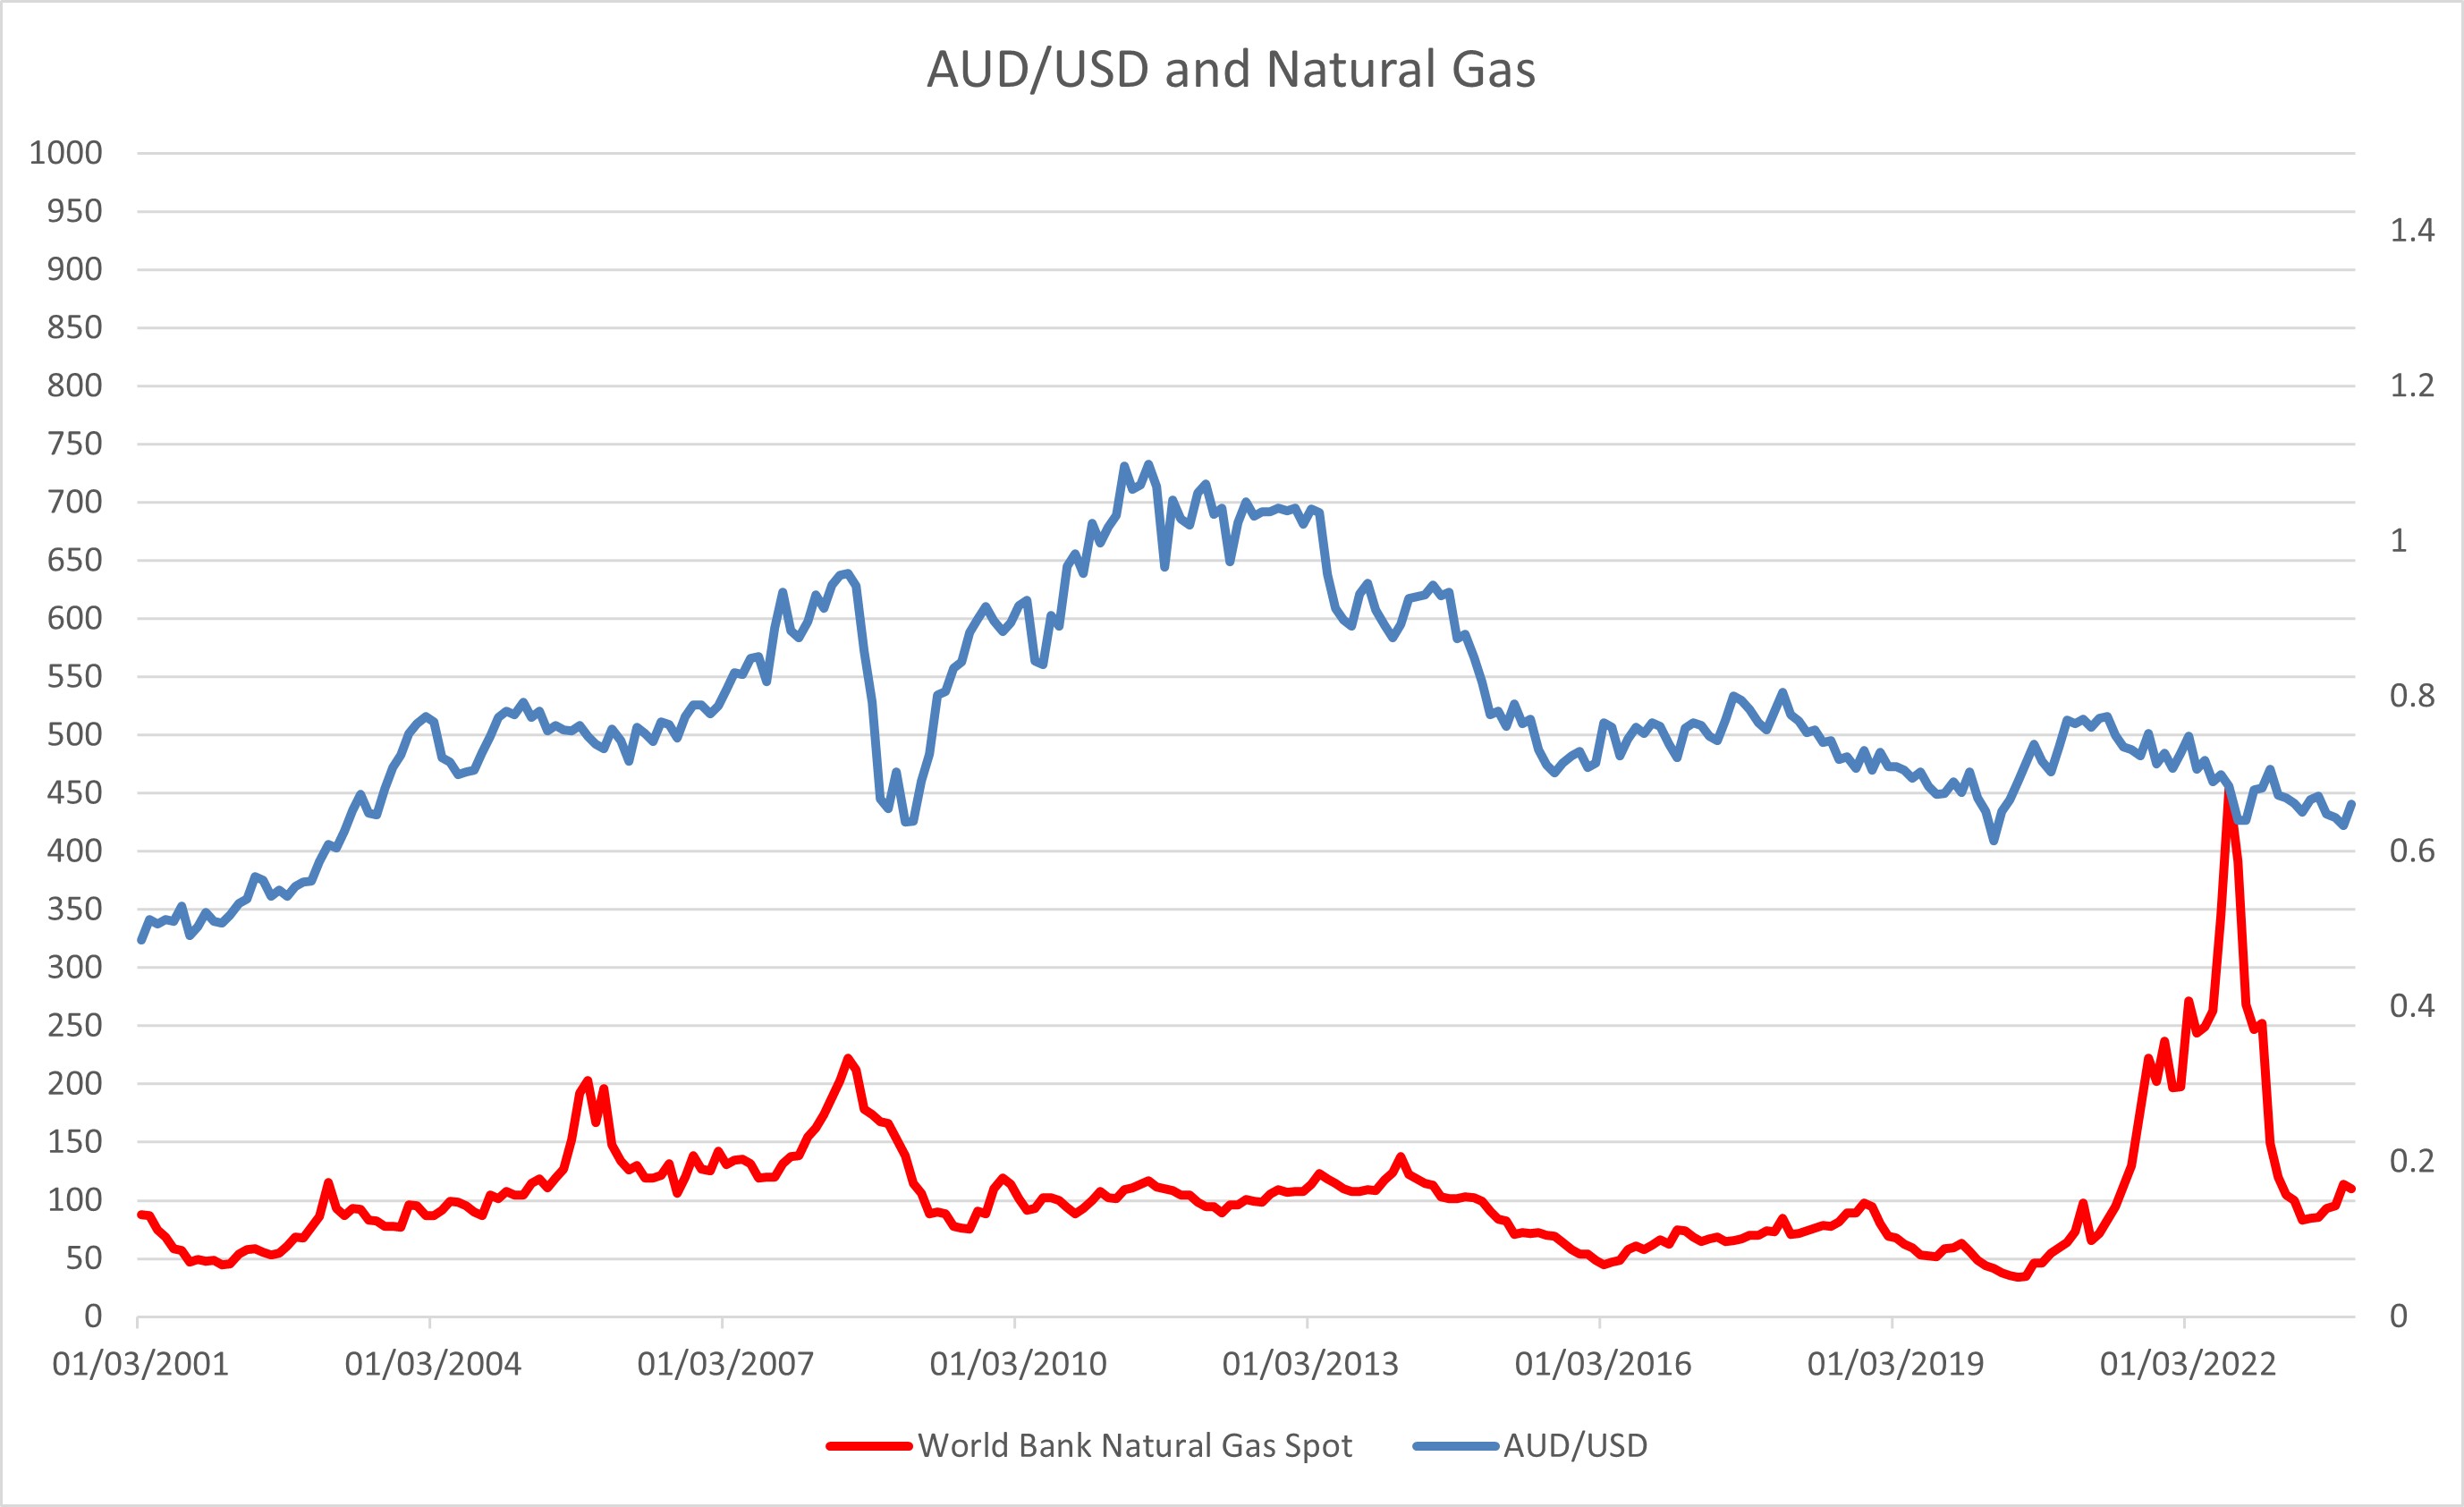
Figure 4 showed how the AUD/USD perform against the spot price of natural gas. Australia exported AUD 9.2b natural gas in 2022-2023, almost doubling from the previous year. Still, it is mostly the third mostly exported commodity in recent years.
Natural gas' price is more volatile compared to coal and iron ore. Natural gas is generally in an uptrend from 2002-2009, oscillating from 2010-2014,in a down trend from 2014-2016, resume a gradually uptrend in 2016-2019 and briefly dipped from 2019-2020 before jumping in 2022-23 and a sharp reversal following. The correlation is clear from 2001-2010 and 2014-2021, weakens from 2010-2013 and 2022-2023. It seems to suggest the correlation is weaker than the iron ore and coal counterpart.
Figure 5: AUD/USD Performance with reference to gold
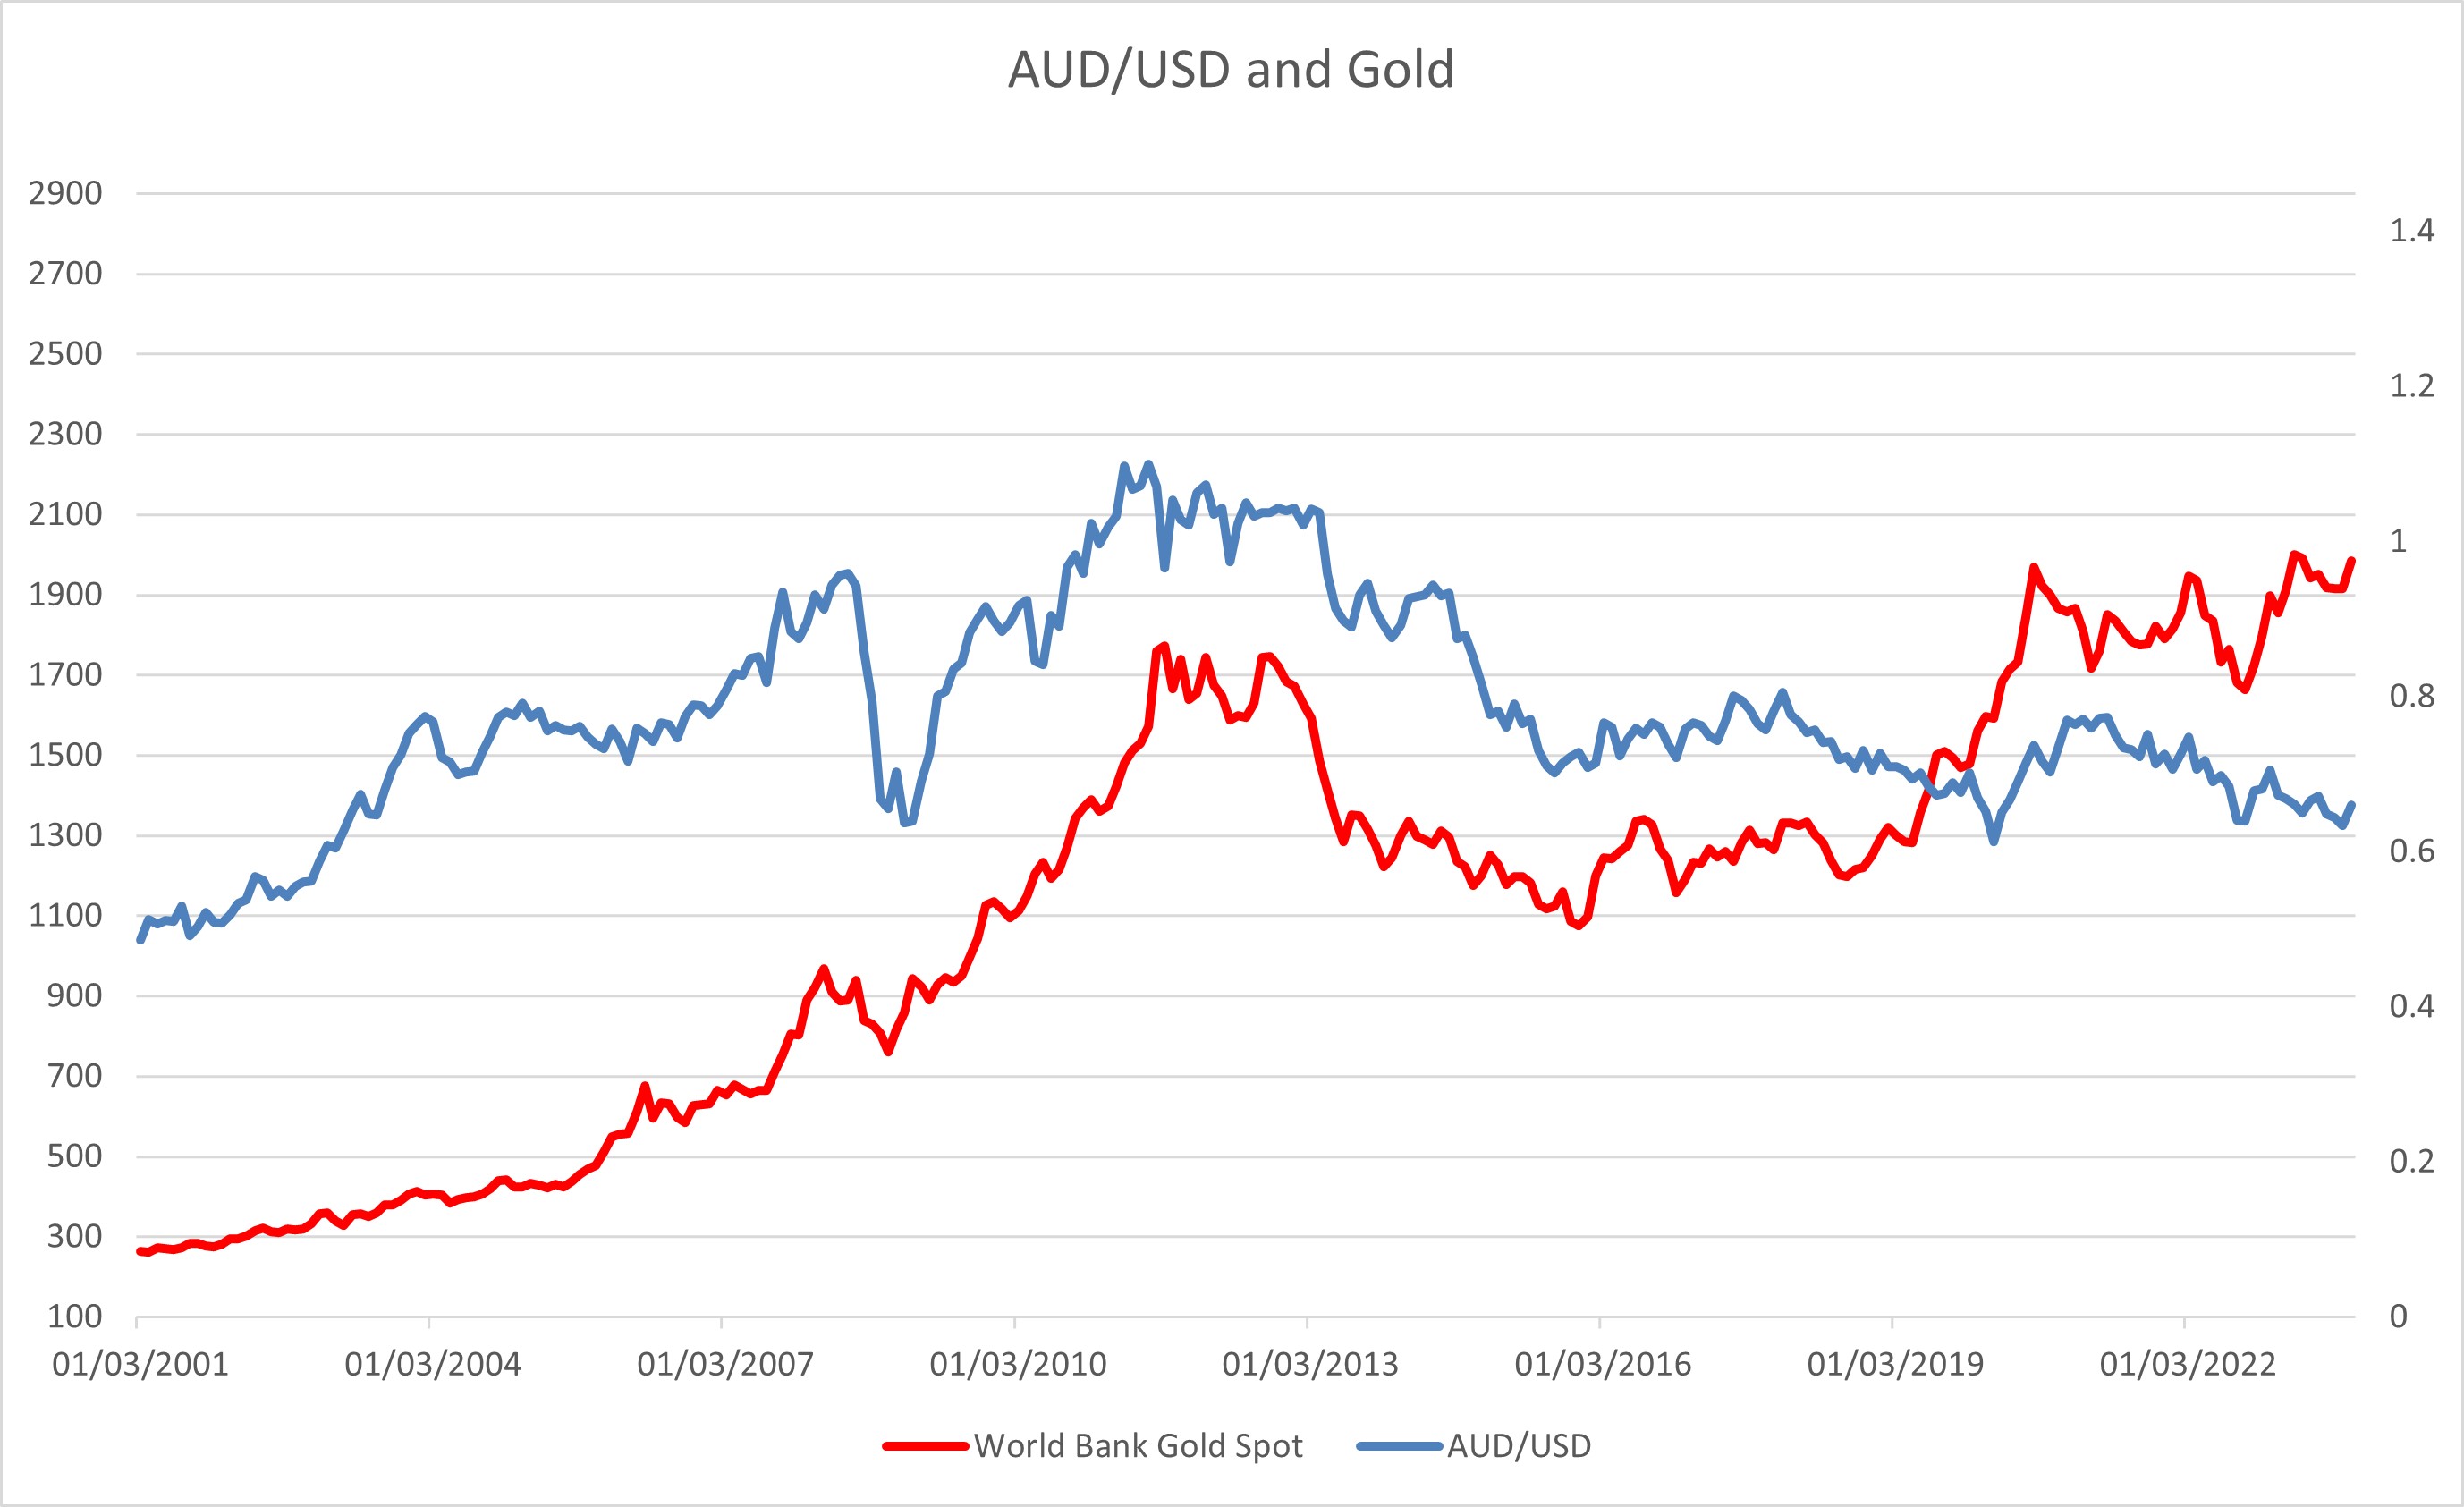
Figure 5 showed how the AUD/USD perform against the spot price of gold. Australia exported AUD 2.3b gold in 2022-2023. Gold export has been steady for the recent years.
Gold has been in an overall uptrend for the past twenty years. The only years gold treads lower are 2013-2016. This is an interesting read as we see the trend is almost identical but not proportionate till 2018. There is a multi-year long rally in gold while AUD/USD stays depressed for most part of it. From which we can see the correlation between the performance in AUD/USD and Gold may only exist in broadly similar trend (before 2018) but one could not say they closely track each other given the magnitude of volatility and gold price appreciates throughout the past twenty years when AUD/USD only appreciate in the first half.
Figure 6: AUD/USD Performance with reference to wheat
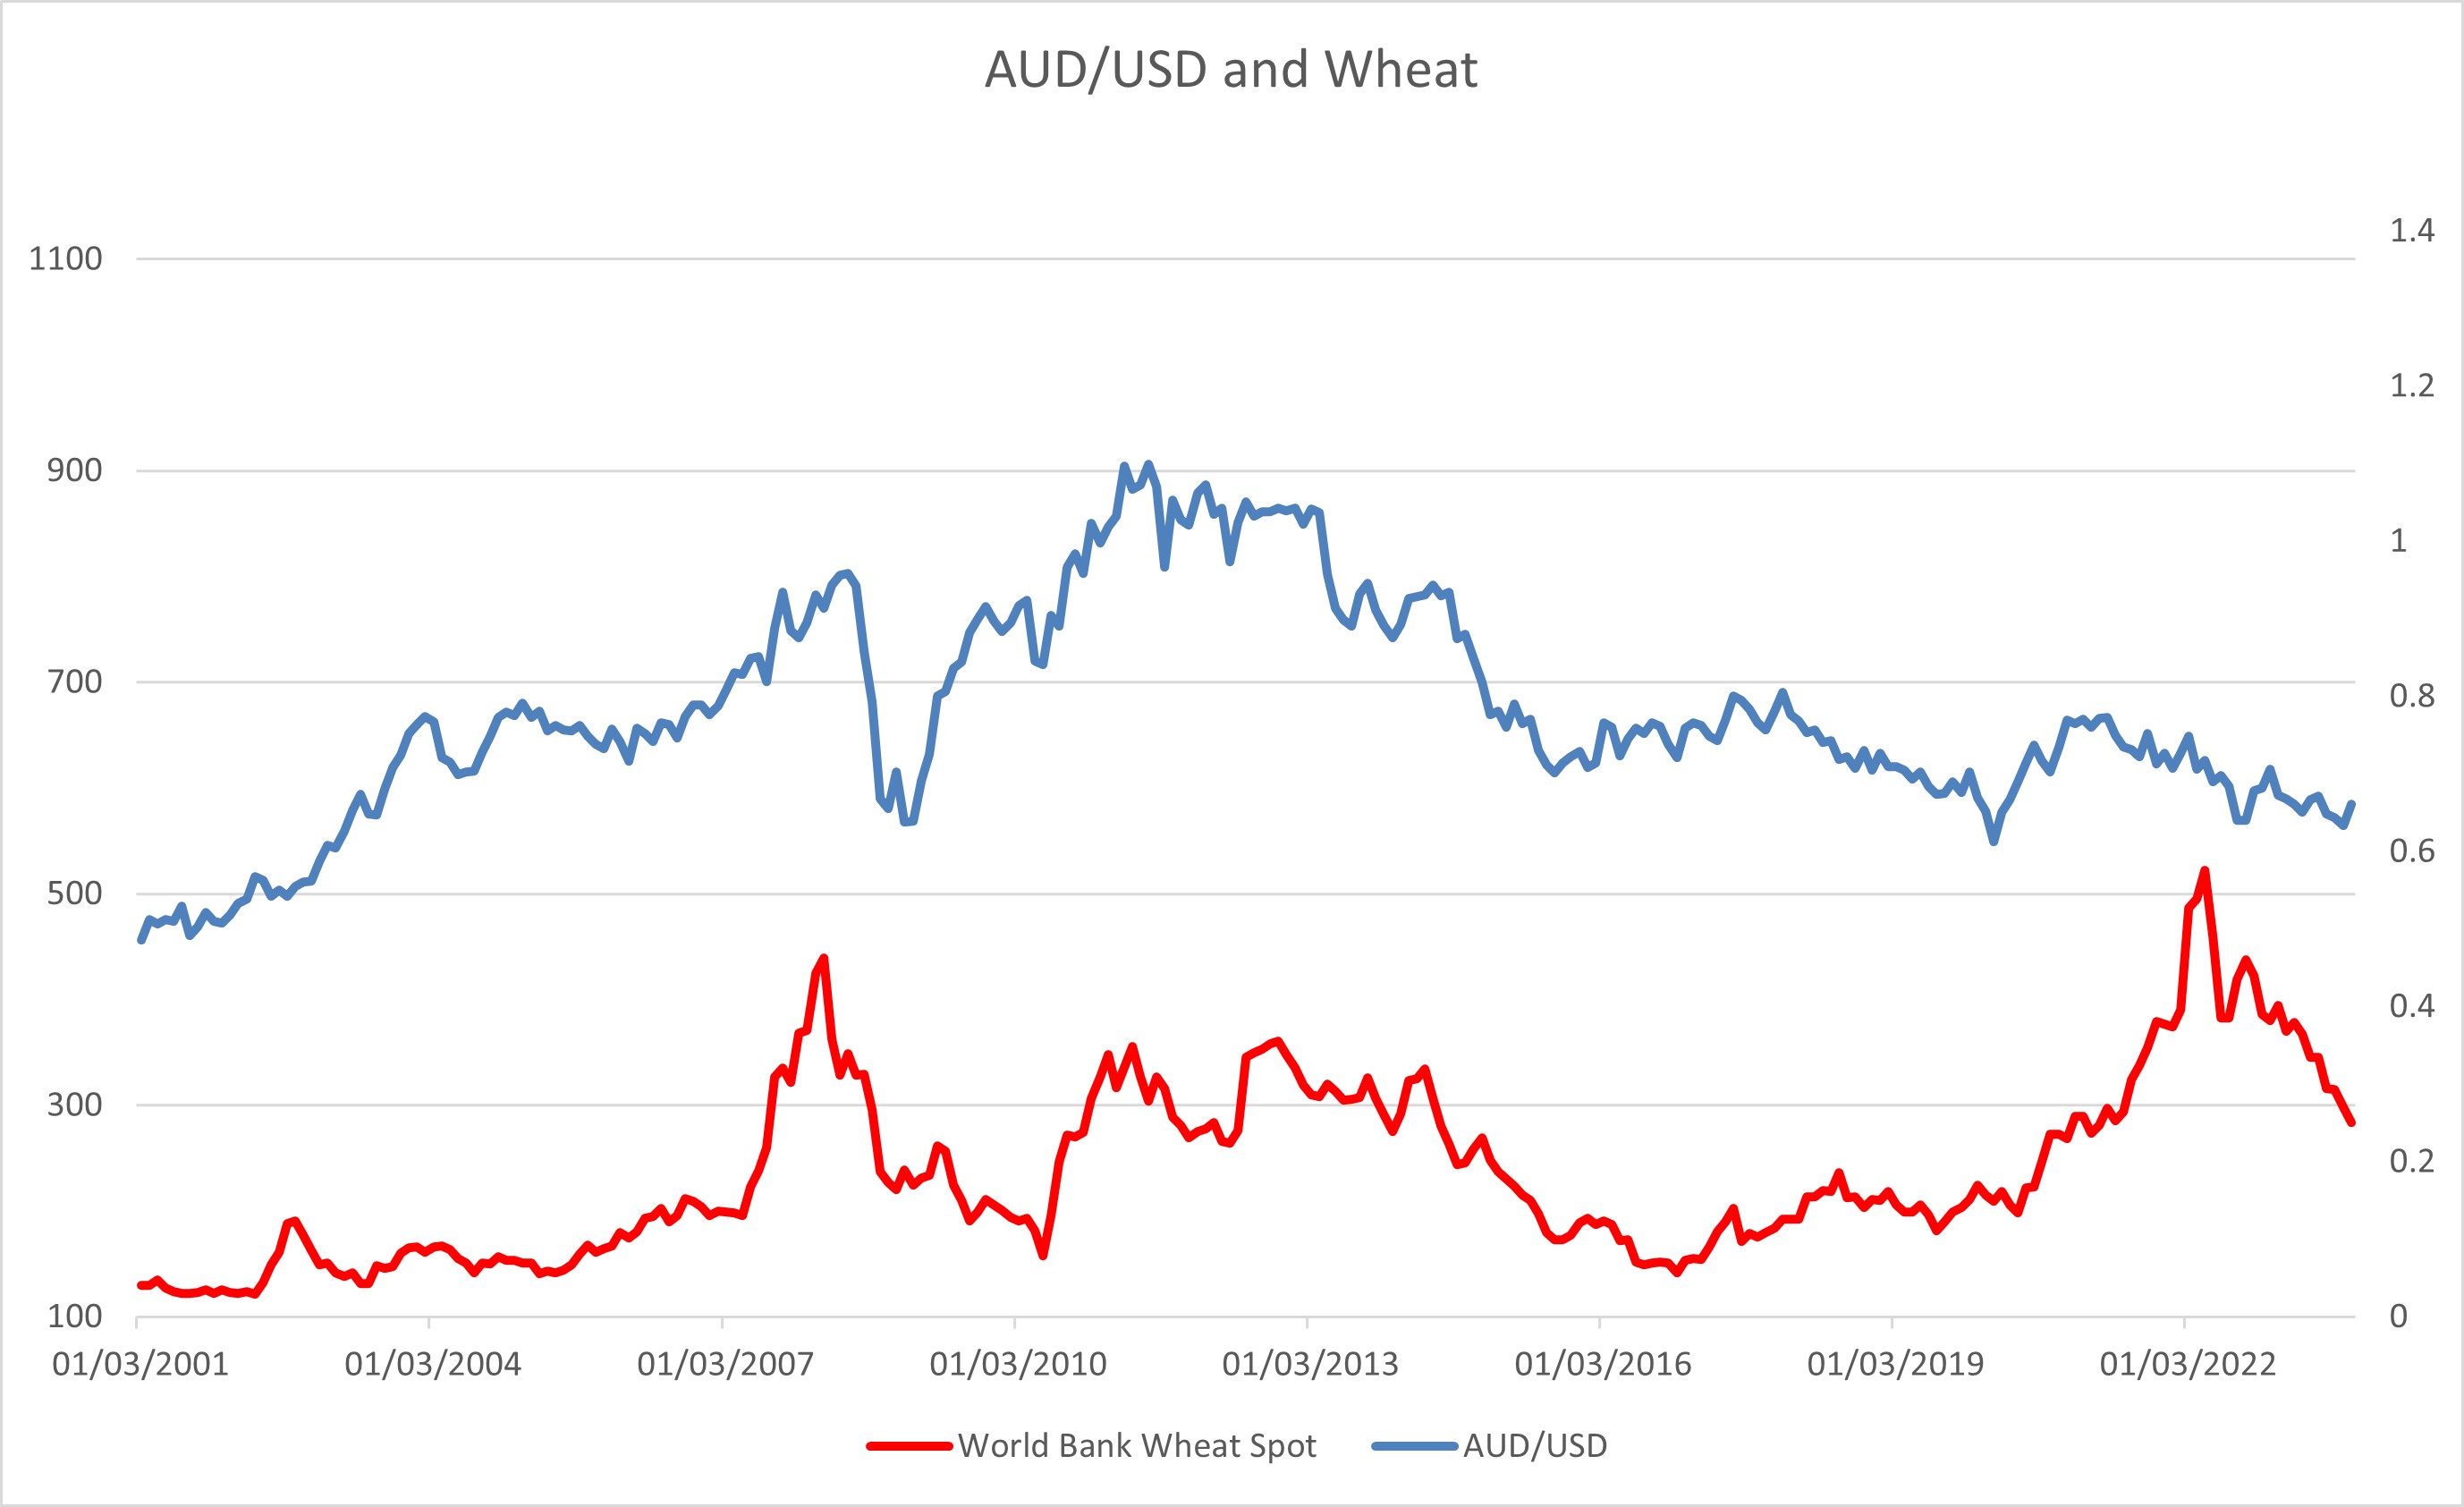
Figure 6 showed how the AUD/USD perform against the spot price of wheat. Australia exported AUD 1.4b of wheat in 2022-2023. Australian wheat export has jumped from AUD 0.3b in 2020-2021 to AUD 0.9b in 2021-2022 before reaching 1.4b of wheat in 2022-2023. This would suggest wheat prices will have a smaller, if any, impact towards AUD/USD performance realistically.
Wheat prices increased steadily in 2001-2007 (spike in 2002-2003), jumped and reversed in 2007-2010, rise again and consolidate throughout 2010-2014 before the downtrend in 2014-2017 and uptrend in 2017-2022. Wheat price corrected from the high price in 2022 till the present. There is not a strong correlation between wheat price and AUD/USD from 2001-2011 as we see the volatile moves in 2007-2010 are not tracked. Similar medium term movements are similar from 2012-present but the correlation is not strong for the sharp movements in wheat does not result in strong volatility in AUD/USD.
From this chapter, we could see the performance of Aussie is indeed correlated and could be tracked by commodities but the level of correlation varies. The AUD/USD is the most closely tracked by the broad commodity index instead of one single commodity. Iron ore and coal price, from a single commodity aspect, tracks the AUD/USD well since 2007-2019 but has since decreased its correlation (potential because of geopolitical event leading to spike in such commodity price, instead of a healthy growth in global share). Further data analytics will be illustrated in the final chapter.