Commodities Outlook: The War in Action
Oil markets in 2026 have been extremely volatile due to the conflict in Iran and disruptions in the Strait of Hormuz. Under our baseline scenario of a 4-8 week war (here), we project WTI to average between USD 65 and 70 by year-end. In an alternative scenario of a prolonged multi-month conflict, prices could surge toward USD 120-180 during Q2 2026 before gradually easing. Higher oil prices may feed into inflation and moderate global demand in H2 2026. Looking ahead to 2027, calmer geopolitical conditions, lower inflation and a weaker USD should support consumption, but production will likely be sufficient to bring WTI to USD 55 by year end.
Copper markets in 2026 remain shaped by U.S. trade policy, mine disruptions, and China’s uneven demand, while structural support comes from electrification, renewable energy, EVs, and data center growth. Tariff uncertainty has triggered inventory build-ups, creating short-term volatility, while recurring operational incidents at major mines have reinforced perceptions of supply tightness, though inventories suggest no immediate shortage. Developments in China will continue to drive demand, with investment in infrastructure and high-tech manufacturing partially offsetting softer domestic consumption. We continue forecasting copper at USD 12,000 by end-2026 and USD 13,000 by end-2027.
Gold had benefited from robust central bank demand, strong ETF inflows, easier U.S. monetary conditions, and a softer USD, before the Iran war prompted risk off profit-taking by speculators. Central banks continue to accumulate reserves, though at a moderate pace, and investors are gradually rebuilding strategic allocations. The metal’s traditional safe-haven response has been tempered by liquidity preferences, portfolio rebalancing, and higher oil prices impacting inflation and monetary policy/bond yields. We forecast gold at USD 4,500 by end-2026 and USD 4,600 by end-2027. Key risks include slower central bank demand, retail liquidation, and a more prolonged Iran war than our 4–8-week baseline.
Oil: All Eyes on The Strait of Hormuz
The first quarter of 2026 has been one of the most volatile periods for oil markets. The escalation of the conflict involving Iran has triggered significant supply disruptions and pushed prices sharply higher as traders reassess the availability of crude from the Gulf region. Much of this volatility has been driven by the disruption to shipping through the Strait of Hormuz, which normally handles close to one-fifth of global oil flows. The International Energy Agency (IEA) has described the resulting shock as potentially the largest supply disruption in the history of the global oil market, underscoring the scale of the risk facing energy markets since the start of the conflict.
Oil has been particularly sensitive to developments in the Strait of Hormuz because of the large volumes that normally transit through the waterway. Around 20 mb/d of crude oil and refined products pass through the strait under normal conditions, making it a critical corridor for exports from major Gulf producers. Although some countries, particularly Saudi Arabia and the UAE, can redirect part of their exports through alternative pipeline routes, these channels can only accommodate a modest share of the volumes normally shipped through Hormuz. As a result, the prolonged restriction maritime transit, combined with rising storage constraints, has already forced some producers, including Iraq, the UAE and Kuwait, to reduce output. At the same time, the conflict has involved attacks on refineries, pipelines and energy infrastructure across the region, as well as attempted strikes against oil fields. These developments have increased the risk that part of the disruption will extend beyond the closure of shipping routes.
The international community has attempted to stabilize the market but these actions have had limited impact, given the cumulative shortfall even over a 1-month period. For instance, member countries of the IEA have already agreed to release approximately 400 million barrels from strategic reserves (out of their 1.2 billion total barrels in reserves), which had entered the market gradually since the second half of March. While this measure temporarily calmed the market with the announcement, this is only a relatively moderate measure, especially if the conflict extends beyond March. China is estimated to have 1.2-1.3 billion of commercial and strategic reserves, but has been slower to release reserves. Another measure, led by the Trump administration, is the proposal to secure the transit of commercial vessels through the Strait of Hormuz, but military strategists question the effectiveness of such a navel escort (NATO allies also seem reluctant to join this effort) and ships do not have certainty and security to pass through the strait. Finally, OPEC has indicated that it would increase production beyond planned in an attempt to stabilize the market amid the conflict; however, OPEC’s capability to raise output in the short term remains uncertain given the disruption in the strait; we believe that the production increase may prove difficult to implement in the near term as the strait remains closed.
We now evaluate the trajectory of oil under two possible scenarios, which we discuss further (here). The first one is our baseline scenario, which consists of a 4-8 week conflict, while the alternative scenario is a 2-6 month war. As of the writing of this article, WTI prices stand at around USD 92 per barrel.
Baseline scenario: 4-8 week war (65%)
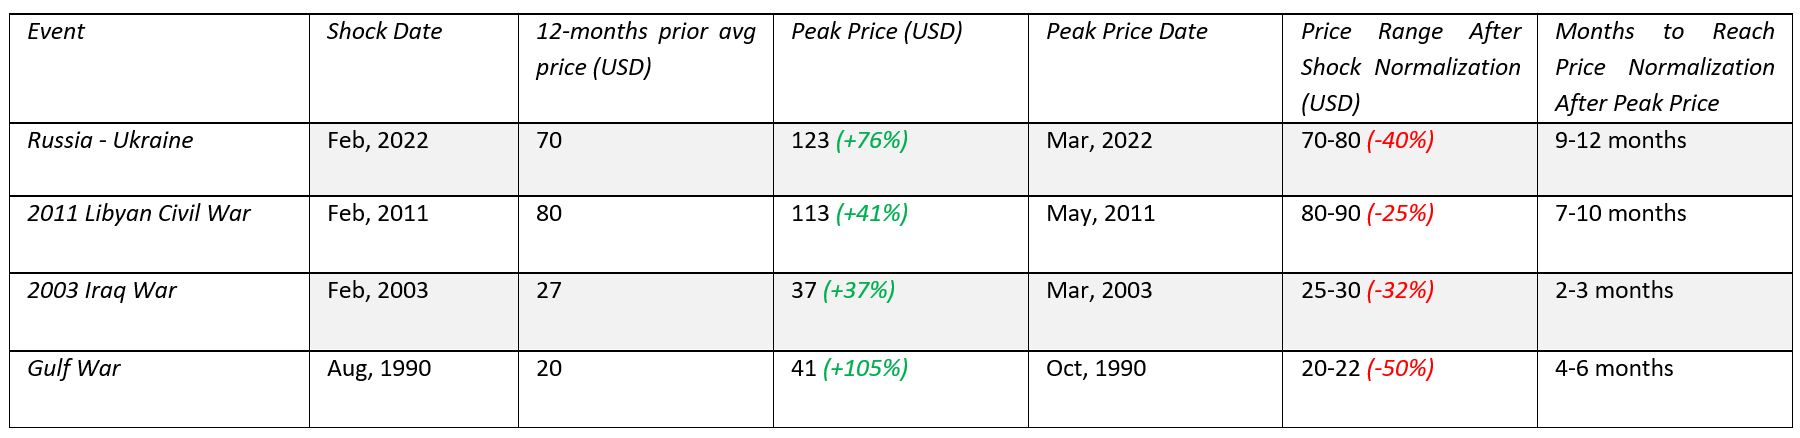
Under our baseline scenario, the conflict remains relatively short, given Trump bias against long wars and high gasoline prices. A formal ceasefire is unlikely, as Trump wants the PR of victory. However, some informal understanding on the Straits of Hormuz could allow most shipping to resume. The fragile nature of the agreement and the possibility of renewed tensions mean that prices would be unlikely to return immediately to their pre-conflict levels in the USD 50s. Historically, when geopolitical shocks have pushed oil prices higher, the subsequent correction has tended to occur gradually. Price retracements of roughly 25–50% have typically taken place over a period of three to twelve months (Table 1). In this context, the announcement of a ceasefire would likely remove only a portion of the current risk premium. Assuming that shipping through the Strait of Hormuz gradually resumes throughout Q2 2026, we estimate that roughly 15–20% of the premium could dissipate initially, bringing WTI prices to around USD 80–75 by the end of Q2. As conditions gradually stabilize, the additional risk premium could unwind over the remainder of the year. Under this scenario, WTI prices would likely average around USD 75–70 during Q3 before easing toward the USD 70–65 range by Q4. Looking ahead to 2027, as geopolitical tensions fade and supply disruptions dissipate, prices would increasingly reflect underlying market fundamentals and could gradually move back toward the USD 60–50 range.
Table 1: Price Movements After Shocks in the Oil Market
Alternative scenario: 2-6 month war (30%)
In an alternative scenario where the conflict persists for 2-6 months (here) and shipping through the Strait of Hormuz remains heavily restricted, the oil market would face a significantly more severe supply shock. Strategic reserve releases by the IEA and China would provide only temporary relief, particularly if a large share of Gulf exports remains disrupted. At the same time, some producers could be forced to reduce (or stop) production as storage facilities fill, while a prolonged conflict would increase the risk of damage to oil infrastructure across the region. As the impact of reserve releases diminishes and supply disruptions persist, prices could rise toward the USD 120–180 range during Q2 2026 and destroy demand; the range depends on duration of the war and extra damage in this alternative scenario. If a ceasefire is reached in early Q3, oil markets would likely follow a similar adjustment path to that described in the baseline scenario, with prices gradually declining as geopolitical tensions ease (Figure 1).
Assuming our baseline scenario, and as long as the strait remains closed, OPEC production hikes are set to have little to no impact on the market. Once the strait reopens, we believe OPEC production increases will continue and put downward pressure to the oil market, alongside output from non-OPEC producers; a similar trend to the one seen prior to the conflict. We expect this behavior to extend into 2027.
Prior to the escalation of the conflict, global oil demand had proven more resilient than expected, helping support prices despite growing supply from non-OPEC producers. However, the current supply shock introduces new uncertainty to the demand outlook. Higher oil prices are likely to feed into inflation, which could delay monetary easing. In such an environment, global demand growth could moderate during the second half of the year as higher energy costs and restrictive policy weigh on economic activity. This dynamic could place downward pressure on prices once the geopolitical risk premium begins to fade. However, the post war environment could boost demand for inventories on a temporary basis, if the risk of the Strait of Hormuz being closed again is moderate to high probability.
Looking ahead to 2027, a more stable macroeconomic environment, together with lower inflation and easing inflation expectations following the conflict, should provide greater support to global oil demand. In addition, a more accommodative monetary policy stance, alongside a weaker USD, is likely to reinforce this trend. Based on the scenario outlined, we forecast WTI at 68 USD by the end of 2026 and at 55 USD by the end of 2027.
Figure 1: WTI Forecasts Baseline vs Alternative Scenario (USD)
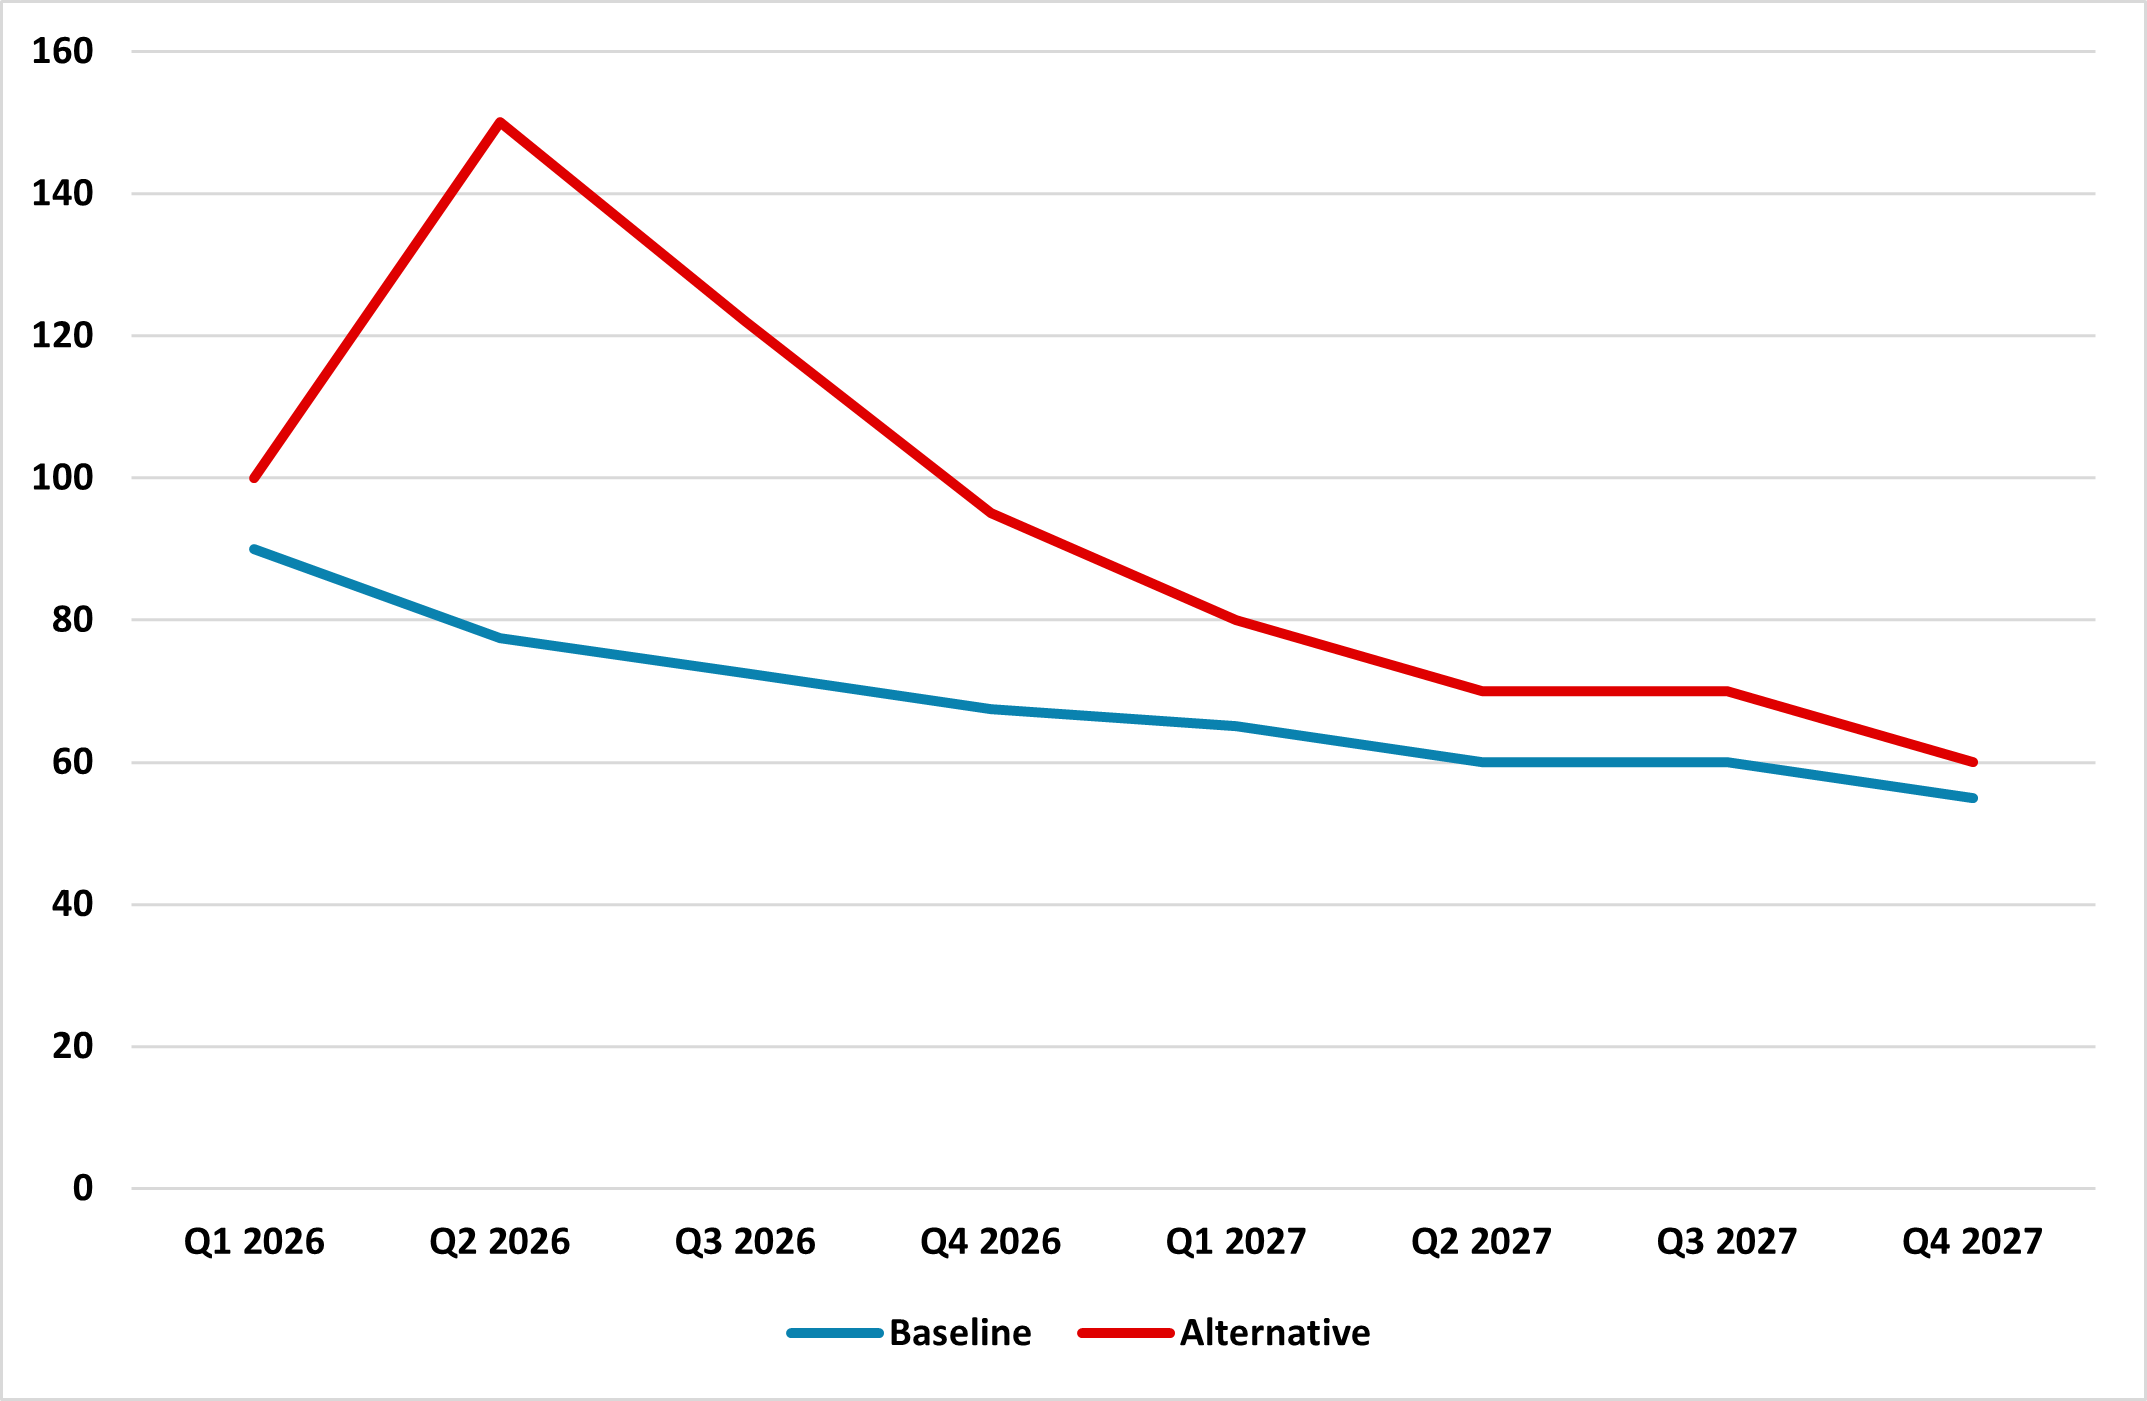
Source: Continuum Economics
Copper: Uncertainty Today, Tightness Tomorrow
Copper has delivered a strong performance over the past year, rising more than 30% since March 2025 as markets responded to persistent policy uncertainty. Much of the rally reflected concerns about potential U.S. trade measures, recurring disruptions at mining operations and evolving demand conditions in China. These developments supported prices throughout 2025 and will continue to influence the market in the years ahead. At the same time, the balance of drivers is gradually evolving. In addition to the traditional supply and demand dynamics, geopolitical developments have become a factor worth monitoring. In particular, rising tensions involving Iran could affect copper indirectly through their impact on energy prices, global inflation and monetary policy expectations, adding another layer of uncertainty to the 2026 outlook.
Policy uncertainty in the U.S. has played a particularly important role in shaping market behavior. During 2025, President Trump announced tariffs on copper but excluded refined copper from the measures, a decision that initially provided relief to markets. However, the administration later indicated that it would revisit the question of tariffs on refined copper in June 2026. This announcement triggered a buildup of inventories across major exchanges (Figure 2), including COMEX, the London Metal Exchange and the Shanghai Futures Exchange, as traders and manufacturers positioned for the possibility of new trade restrictions. The accumulation of inventories contributed to upward pressure on prices throughout 2025 and into early 2026.
Figure 2: Copper Inventories (Tons)
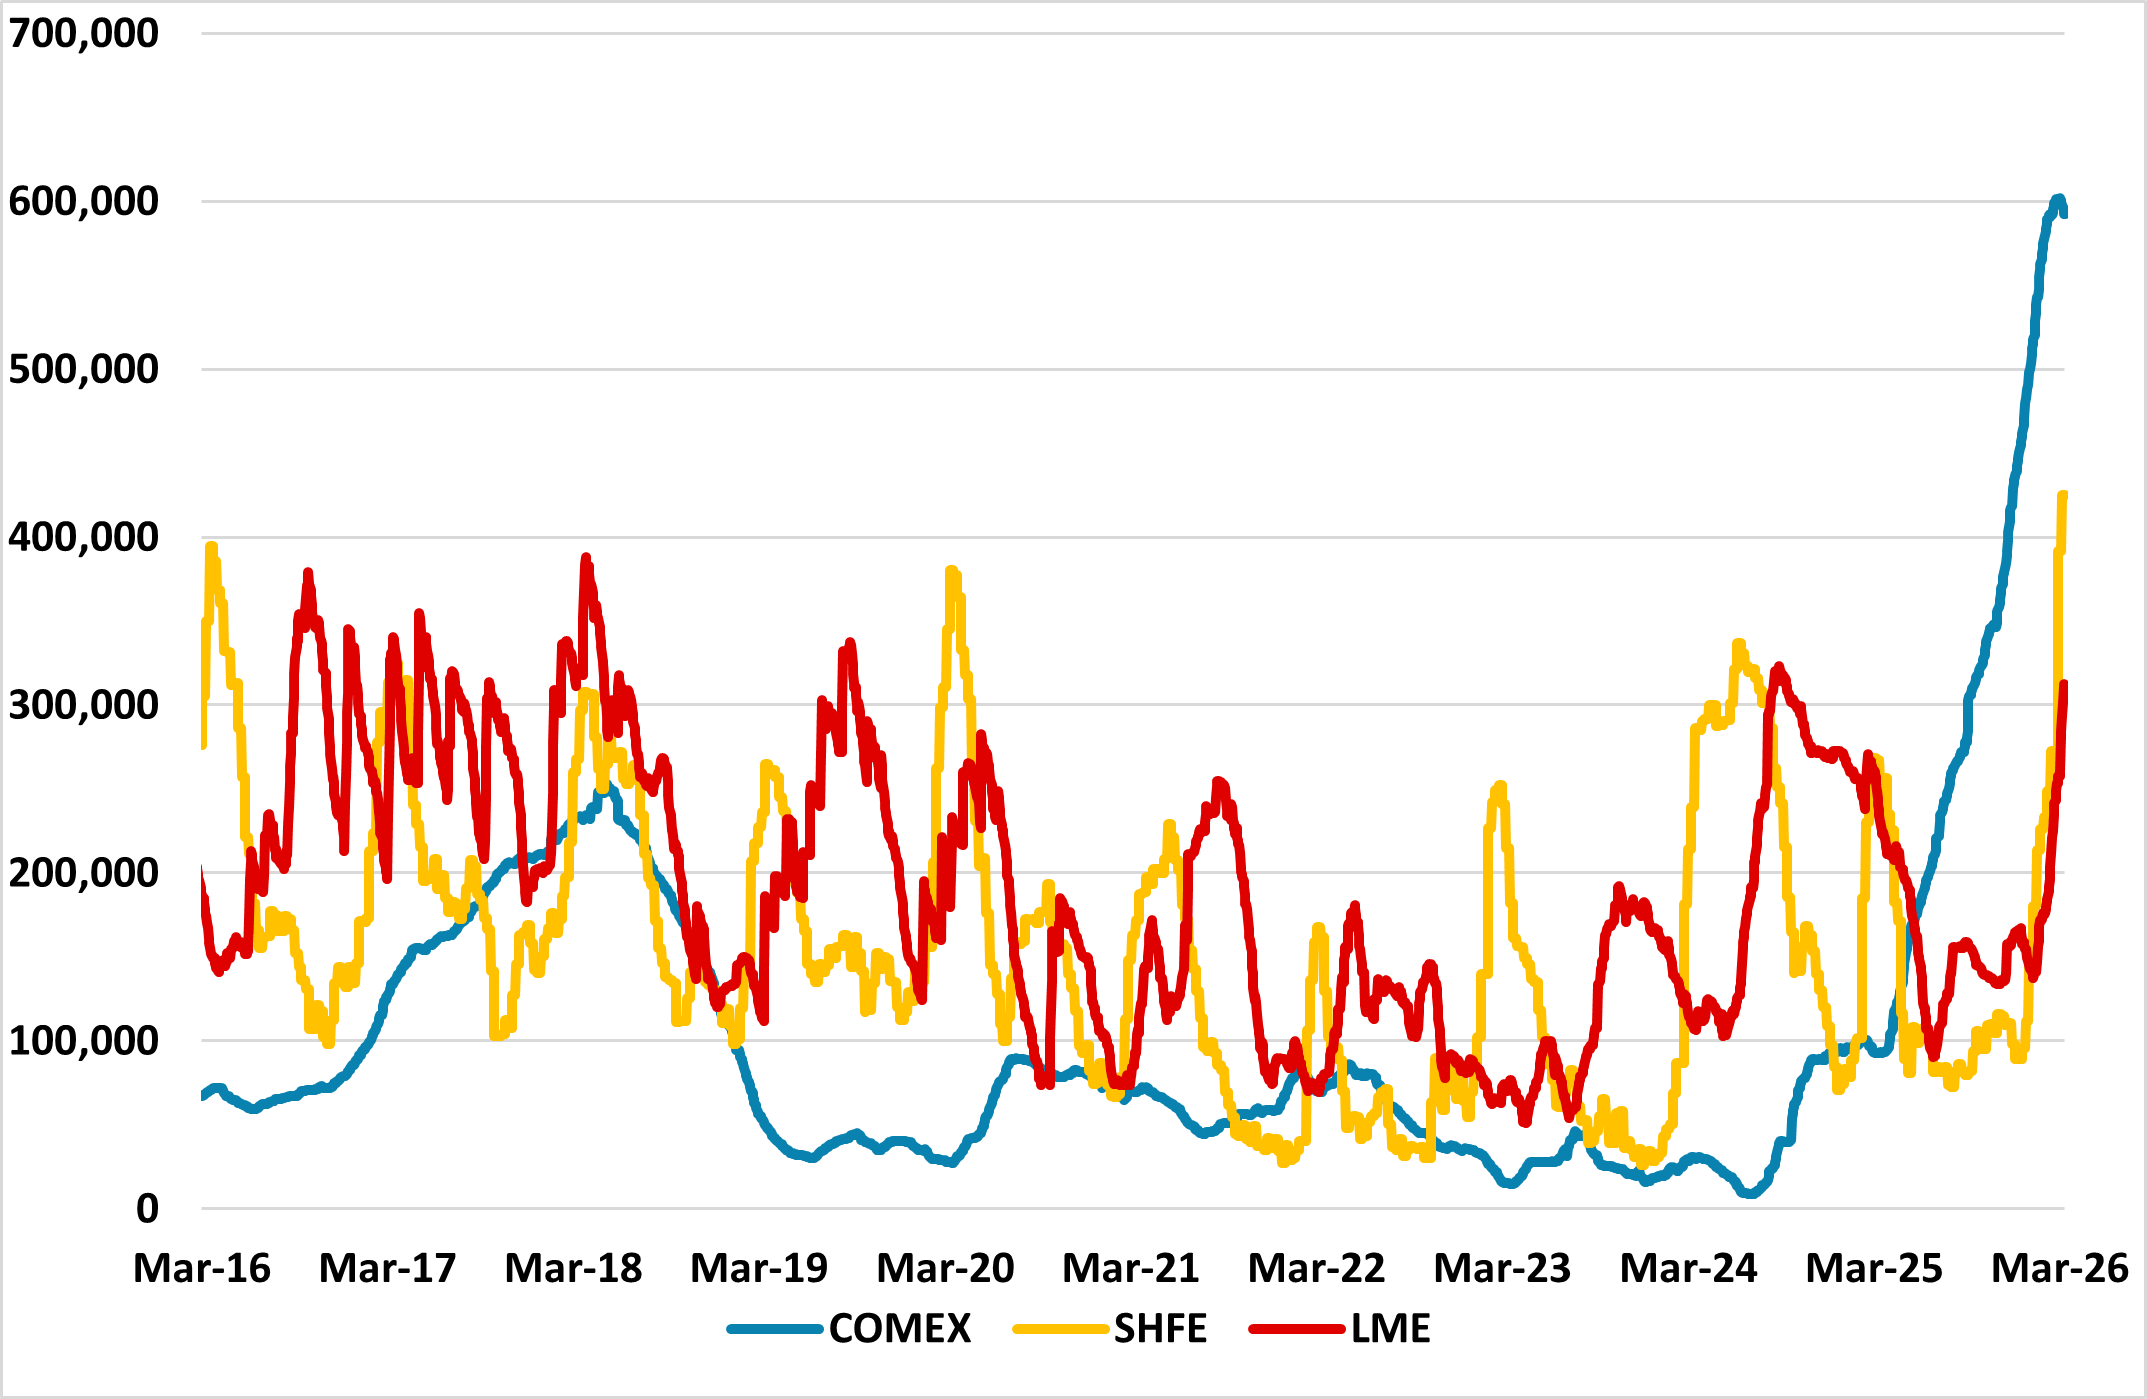
Source: Continuum Economics / Datastream
In our December outlook, we considered the introduction of tariffs on refined copper as our baseline scenario, while acknowledging that the decision remained uncertain. Developments during Q1 2026 now lead us to revise this view. We believe the Trump administration is less likely to impose additional tariffs for several reasons. First, the U.S. has already managed to secure a substantial volume of copper inventories through the threat of tariffs, which supports its objective of strengthening energy and industrial supply security. Second, rising geopolitical tensions in Iran have contributed to higher oil prices and increased inflationary pressures. Introducing tariffs under these conditions would risk exacerbating the U.S. cost of living tensions at a politically sensitive moment. Finally, the administration has recently shown a preference for negotiation rather than tariffs. A Section 232 investigation into processed critical minerals concluded that imports could threaten U.S. national security, but instead of imposing tariffs, the government initiated 180-day negotiations with trading partners aimed at securing supply chains and potentially establishing price floors. This approach could also be used for copper.
We believe the market is increasingly anticipating that new tariffs on copper will not be introduced. If tariffs are not introduced, the market reaction could prove neutral-to-bearish. The inventories accumulated in anticipation of trade restrictions would likely begin to unwind, and part of the material stockpiled could flow back into the global market, placing downward pressure on prices. If new tariffs are introduced, however, two outcomes appear possible. The first is that given the inventory buildup that has already taken place, attention could shift toward the negative effects that higher input costs could have on downstream demand, which could ultimately weigh on copper prices. The second possibility is that, since the tariffs would apply gradually starting at 15% in 2027 and increasing to 30% in 2028, market participants could continue accumulating inventories ahead of the higher tariff phases, temporarily boosting demand and extending the rally.
Beyond trade policy, another factor supporting bullish sentiment in recent months has been the prospect of a structural copper shortage. Demand for the metal is expected to continue rising as long-term trends such as electrification, renewable energy expansion, electric vehicles and the growth of data centers gain momentum. However, we do not expect demand to outpace supply in the immediate term, and current inventory levels suggest that the market is not yet facing a material shortage even though the market has faced intermittent disruptions across several major producing regions. Despite these challenges, global mine supply is still expected to expand moderately in 2026 as new projects and capacity expansions come online and a structural deficit is more likely to emerge later in the decade rather than in the near term.
Developments in China remain critical. As the world’s largest consumer of the metal, shifts in the country’s economic momentum continue to shape global demand. Copper consumption should remain supported by investment in electricity grids, renewable energy infrastructure and the expansion of high-tech manufacturing linked to AI and electrification. However, domestic demand conditions remain more restrained. As discussed in our China chapter, household consumption growth is only modest as wage growth and employment gains have slowed since the pandemic; while policy efforts to stimulate spending remain relatively modest. The property sector, a historically important source of copper demand, also continues to weigh on sentiment. Furthermore, industrial demand has softened as the sharp rise in prices has reduced the incentive for some buyers to maintain earlier purchasing levels, a dynamic that began to emerge toward the end of 2025 as the effects of previous policy stimulus gradually faded.
Taken together, trade policy uncertainty, supply constraints and the evolution of Chinese demand will remain the key determinants of copper prices over the coming year and we forecast copper to end 2026 at USD 12,000. Looking ahead to 2027, the outlook remains constructive for several reasons. First, economic activity in China could improve, supporting stronger demand for industrial metals. Second, there could be greater clarity regarding the direction of U.S. tariff policy, reducing some of the uncertainty that has weighed on the market. Third, structural demand drivers linked to the energy transition and the expansion of data centers are likely to reassert themselves. Fourth, demand growth could begin placing more visible pressure on supply, bringing the narrative of a tighter copper market closer to reality. Finally, a weaker USD would provide an additional tailwind for prices. Under these conditions, we forecast copper at USD 13,000 by the end of 2027.
One element to monitor closely relates to the indirect effects of the conflict in the Middle East, which has already introduced additional uncertainty into the market and could continue to do so. Our baseline scenario assumes a conflict lasting 4-8 weeks, which would mainly delay the timing of monetary easing and therefore postpone the expected weakening of the USD. If the conflict were to persist for longer, however, higher oil prices could translate into stronger inflationary pressures. This could make central banks more cautious in easing monetary policy and keep interest rates elevated for longer. Under such conditions the USD would likely remain stronger, which typically weighs on copper prices by making the metal more expensive for buyers using other currencies. In addition, tighter financial conditions could slow global industrial activity and dampen demand growth for the metal.
Gold: The Paradox
Gold prices had been supported by both structural drivers and short-term market forces, before the Iran war profit-taking. The most influential have been strong central bank demand and sustained inflows into gold ETFs. The rally had also been supported by easier monetary conditions in the U.S., a weaker USD and an uncertain macroeconomic environment. Furthermore, as with oil and copper, the metal has also been affected by the conflict involving Iran and the broader geopolitical uncertainty it has generated.
Data from the World Gold Council (WGC) suggests that central bank demand moderated at the start of the year, with purchases in January 2026 representing only around 20% of the 2025 monthly average. Nevertheless, the report indicates that a broader set of central banks continue to add to their reserves. In previous outlooks we argued that the pace of accumulation, while still robust, would likely slow from the extraordinary levels observed in 2022 and 2023, and the January figures appear consistent with that view. We therefore continue to expect central banks will likely remain net buyers of gold, although not at the same pace seen during those peak years. At the same time, we do not interpret the January slowdown as the beginning of a sustained decline. The underlying motivations behind this stream of demand, including reserve diversification and de-dollarization, remain in place. For example, the PBOC resumed purchases in February, extending its buying streak to 16 months and suggesting that the recent moderation may partly reflect temporary factors such as price volatility or seasonal effects.
Investment demand has also contributed to the strength in gold prices. According to the WGC, physically backed gold ETFs recorded inflows of USD 5.3 billion in February, extending the recent run of positive flows and resulting in the strongest start to a year on record. The steady increase in ETF holdings suggests that investors are gradually rebuilding strategic allocations to gold as geopolitical risks remain elevated and the global macroeconomic environment continues to evolve. Additionally, we feel market expectations of DM rate hikes are overdone, given economic slack. Indeed, in our view, expectations of monetary easing later in the year could rebuild and help bond yields fall. Specifically, we anticipate the Fed will implement two rate cuts in H2 2026, potentially encouraging further investment into gold. Later in the year, subdued real yields and a softer USD are likely to reinforce a favorable environment for the metal.
Like other commodities, gold has also been influenced by the conflict involving Iran, although the price reaction has not followed the traditional safe haven pattern. Several macro financial forces have shaped investor behavior during this episode. Periods of heightened uncertainty often lead investors to prioritize liquidity, which can result in increased allocations to highly liquid USD assets such as short-term Treasury securities rather than a shift primarily into gold. In addition, speculators/portfolio managers facing losses in other asset classes may reduce positions that have performed well in order to rebalance portfolios, which can include selling gold holdings. This dynamic tends to support the USD while placing downward pressure on gold prices, since the metal becomes more expensive for buyers using other currencies. At the same time, the conflict has contributed to higher oil prices, raising concerns about renewed inflation and increasing the likelihood that central banks maintain restrictive monetary policies for longer. Higher interest rates reduce the relative attractiveness of gold given that the metal does not generate yield. Finally, the strong rally observed prior to the escalation of tensions also created incentives for investors to lock in profits as volatility increased. Together, these factors have limited the traditional safe haven response of gold.
The extent to which the conflict ultimately affects gold prices will depend on its duration. Under our baseline scenario, the conflict lasts 4-to-8 weeks. In this case, the geopolitical risk premium embedded in gold prices could fade relatively quickly. However, easing inflation expectations would increase the likelihood of a more accommodative U.S. monetary policy and a weaker USD, both of which would support gold prices. In an alternative scenario where the conflict extends for 2-6 months, the geopolitical risk premium could increase further. At the same time, persistently high oil prices could strengthen inflationary pressures and lead central banks to maintain tighter monetary policy for longer. This would likely keep the USD stronger and limit the upside for gold. In such an environment, the pattern observed so far could continue, with investors prioritizing liquidity and reducing gold positions in order to offset losses in other parts of their portfolios. Gold could hit USD 4000 in this scenario.
We forecast gold at USD 4,500 by end-2026. For 2027, we anticipate the Fed will maintain the Federal Funds Rate at 3.00-3.25%, a scenario that may weaken ETF inflows. Central bank purchases are expected to continue their gradual normalization rather than revert to the rapid accumulation seen in 2021-2023. Meanwhile, easing geopolitical tensions and a more stable global trade backdrop could reduce support for gold. Under these conditions, we project the metal at USD 4,600 by end-2027.