Chart USD/ZAR Update: Further consolidation - daily studies under pressure

Little change, as mixed intraday studies keep near-term sentiment cautious
| Level | Comment | Level | Comment | |||||
|---|---|---|---|---|---|---|---|---|
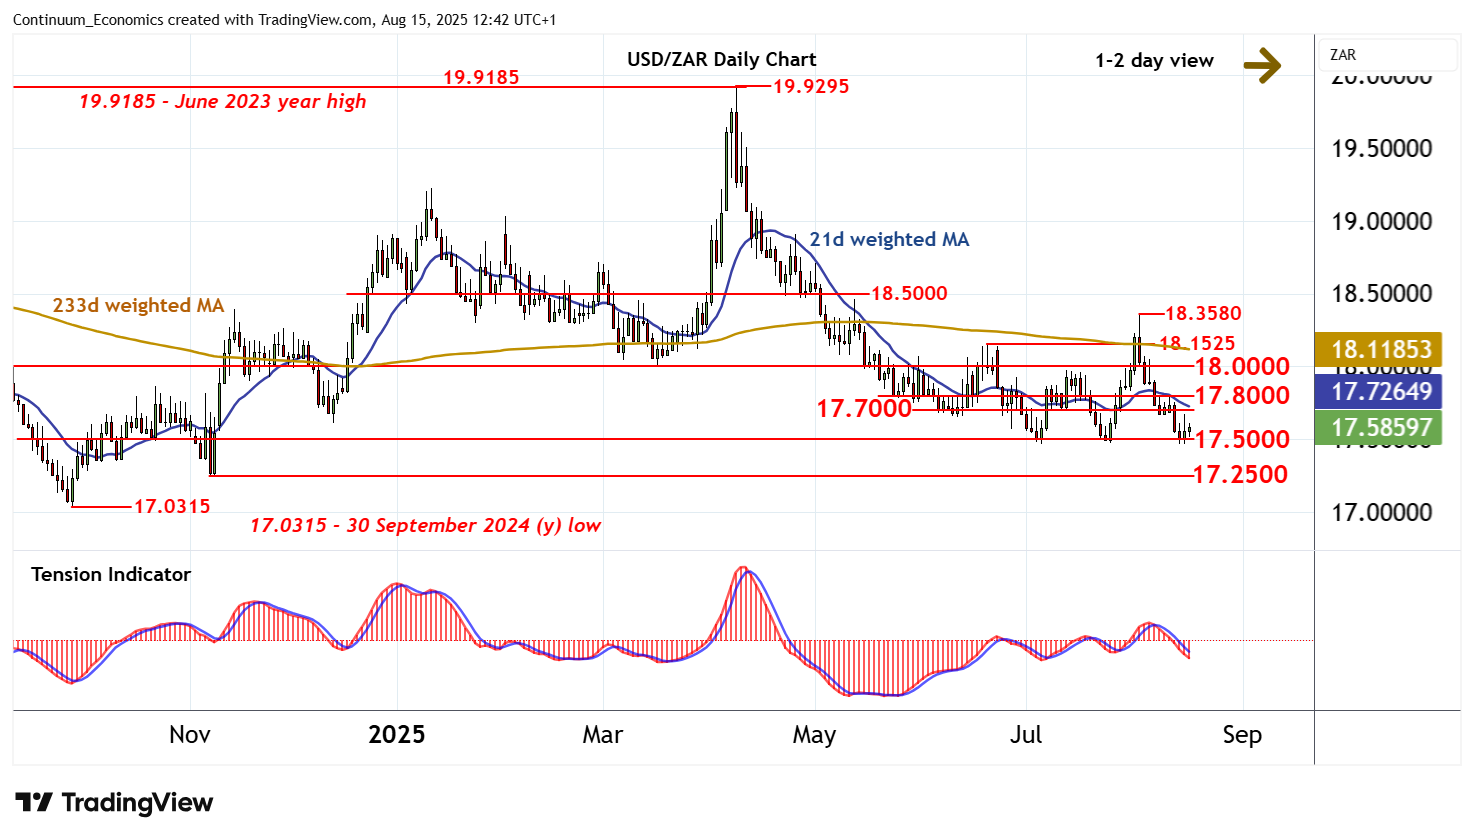
| R4 | 18.1525 | ** | 19 Jun (m) high | S1 | 17.5000 | ** | congestion | |
| R3 | 18.0000 | ** | congestion | S2 | 17.4690 | ** | 4 Jul YTD low | |
| R2 | 17.8000 | * | congestion | S3 | 17.2500 | ** | 7 Nov (m) low | |
| R1 | 17.7000 | * | congestion | S4 | 17.0315 | ** | 30 Sep 2024 (y) low |
Asterisk denotes strength of level
11:55 BST - Little change, as mixed intraday studies keep near-term sentiment cautious and extend consolidation above congestion support at 17.5000. Oversold daily stochastics are turning up, suggesting potential for further sideways trade. But the daily Tension Indicator is negative and rising weekly charts are flattening, suggesting a deterioration in sentiment and room for fresh losses in the coming sessions. A break below 17.5000 will open up the 17.4690 current year low of 4 July, with a further close beneath here extending April losses towards the 17.2500 monthly low of 7 November. Meanwhile, resistance is at congestion around 17.7000 and extends to further congestion around 17.8000. This range should cap any immediate tests higher.