This week's five highlights
U.S. July CPI a marginal disappointment
This Week's Fed Speakers
RBA Cut 25bps as expected
Job Concerns Growing for Norges Bank
Fresh Upside Growth Surprise for UK GDP
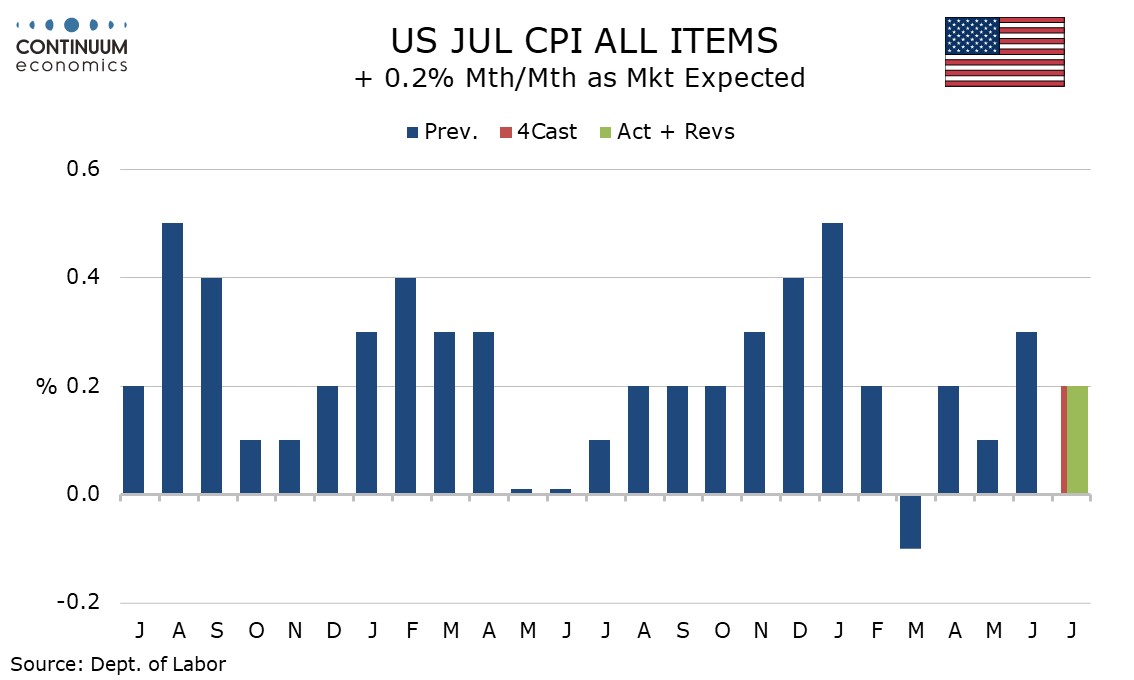
July’s CPI is in line with consensus at 0.2% overall, 0.3% ex food and energy, but the core rate of 0.322% before rounding is a little high for comfort. The detail shows the acceleration from June was more in services than goods, so the story is not a simple one of tariffs. Overall CPI rose by 0.197% before rounding, and the overall yr/yr pace was unchanged at 2.7%, marginally lower than expected, while the core rate of 3.1% yr/yr from 2.9% was higher than expected and the highest since February.
Energy fell by 1.1% led by a 2.2% fall in gasoline while food was surprisingly subdued at unchanged. Commodities less food and energy rose by 0.2%, matching June’s increase which was stronger than previous trend, though with used autos up by 0.5% after a 0.7% June decline and new autos unchanged after a flat June the data was slower ex autos than in June. Apparel rose by only 0.1% after a 0.4% June rise reverse a 0.4% May decline. This sector, seen as sensitive to tariffs, has seen limited gains so far. Household furnishings and supplies, up 0.7% after a 1.0% rise in June, appear to be seeing a lift, though the impact of tariffs remains moderate. We do suspect that August CPI may see a stronger impact, with the tariff picture starting to look clearer.
Services less energy services rose by 0.4% after a 0.3% rise in June and a 0.2% rise in April, so led July’s acceleration. This is problematic for Fed doves who have been arguing that a tariff boost to goods should be overlooked as a one-time boost. Strength in services is harder to dismiss. The most notable area of strength in services was a 4.0% incase in air fares, which can be seen as a correction from recent weakness. This led a 0.8% rise in transportation services. Medical care services were also firm with a rise of 0.8%. Shelter was relatively subdued at 0.2% restrained by a 1.0% fall in lodging away from home. Owner’s equivalent rent saw a third straight rise of 0.3%.
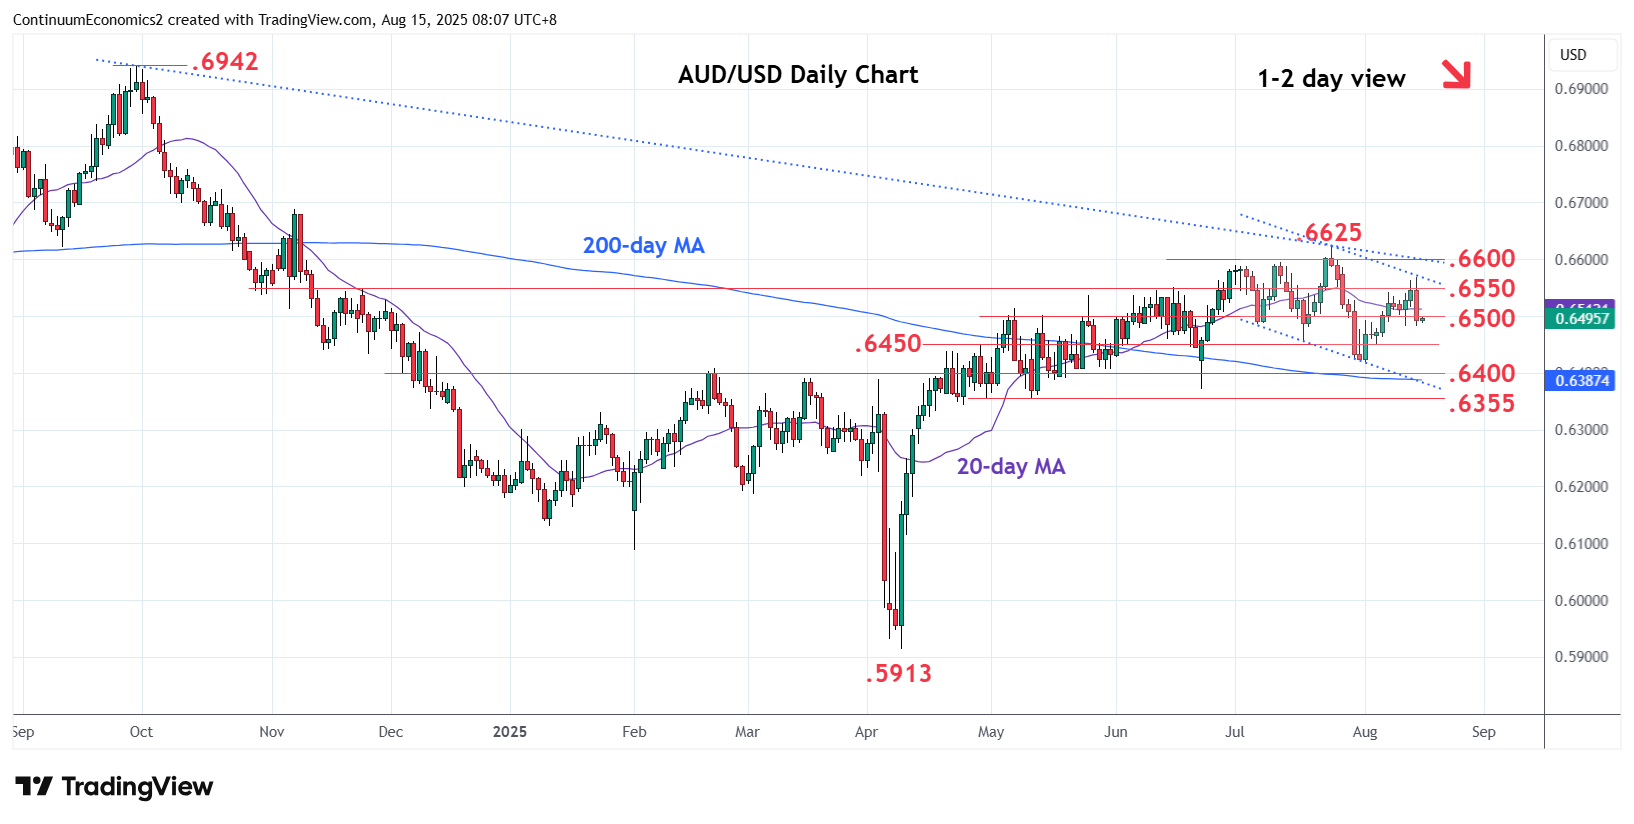
The RBA has cut the cash rate to 3.6% in the August 12th meeting as the current inflationary pressure eases. The combination of lagged effect of easing and uncertainty in inflationary dynamics has kept the RBA from aggressive cutting. With current inflationary dynamic (headline 2.1% and trimmed 2.7% y/y), the RBA forecast underlying inflation to continue its moderation and thus they are more comfortable to cut. Their forward guidance "The Board will be attentive to the data and the evolving assessment of risks to guide its decisions." continues to point towards data dependency and suggest another cut coming soon.
We continue to see one more 25bps cut in 2025 before a final cut in Q1 2026. The timing of the 2025 cut will likely be the November meeting, to give RBA sufficient time to assess the impact of easing and Trump's tariff policy.
Figure: Unemployment on the Rise
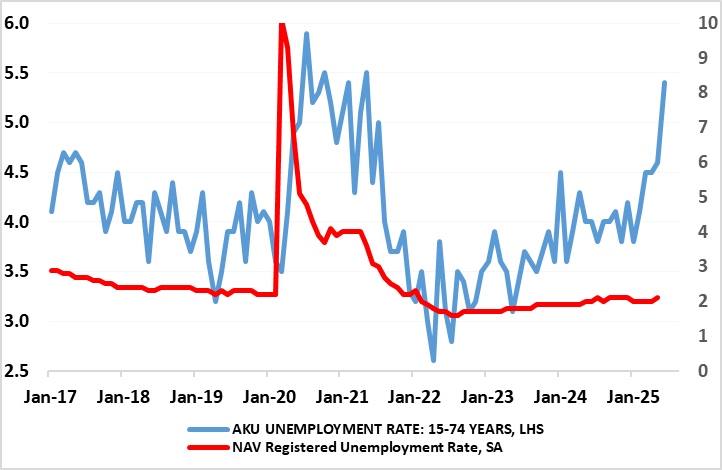
After the surprise 25 bp rate cut in June, it was back to humdrum predictability with the widely expected stable policy decision at 4.25%. Regardless, the Board could be attacked for plagiarism given the manner in which the updated press release mimics that seen in June, save for the fact that both are the production of a still cautious and hawkish Norges Board. As we have said before, we thought the Norges Bank’s unexpected easing in June was very much warranted, as are the further cuts being flagged in the Monetary Policy Report (MPR) that came alongside – ie up to two more such moves by end year. Partly given weaker labor market signs (Figure), we actually envisage up to three more moves this year and around a full ppt more in 2026, but accept that the Board may not deliver such moves, especially if the fresh weakness in the currency since that surprise cut persists.
This is in spite of more downside inflation surprises and a rise in unemployment (Figure 1) that was implicitly recognized by the Board as being somewhat unexpected – admittedly the two alternative joblessness measures offer diverging pictures. However, with no formal forecast updates at this month’s decision, in which the tariff threat could be better assessed, other considerations for markets to ruminate over remain unclarified, not least just how restrictive the current policy rate actually is, something we discuss again at this juncture (Figure 2). The Norges Bank was the first DM central bank to start hiking and is now the last to have started easing.
Figure: GDP Growing Solidly?
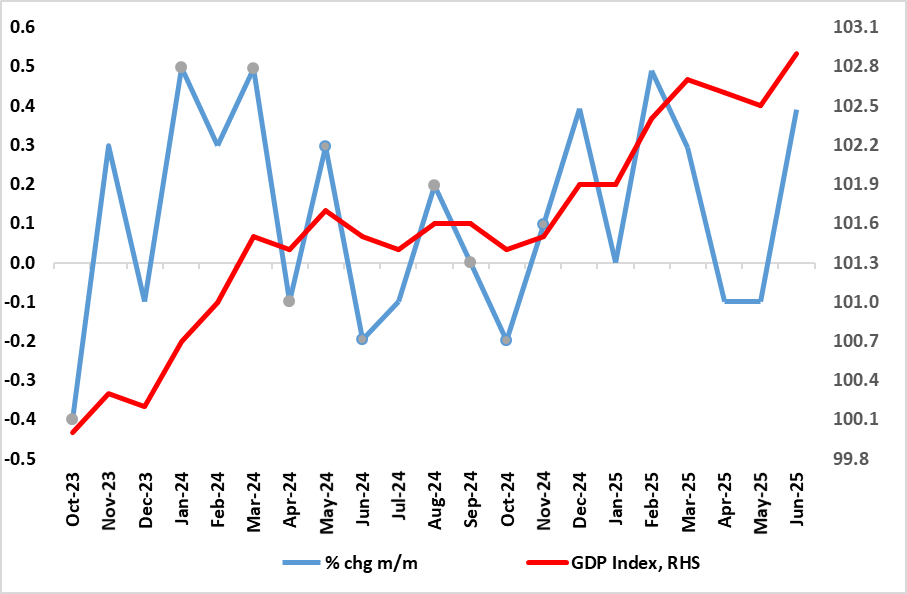
To what extent better in June GDP, not least it having been the warmest even such month in England, lay behind the fresh upside surprise that saw the economy grow 0.4%, twice generally expected and with the falls of the two previous months pared back so that a clearer uptrend has emerged (Figure 1). The result was that the economy grew by 0.3% q/q in Q2 also higher than expected. Admittedly, this rise was based almost solely around a fresh rise in government spending and equally a further build in inventories as well as net trade that failed to turn negative after the distorted Q1 jump. This means that GDP growth this year may be around 1.1% (previous estimate sub-1%) but where more ominous signs not least fiscal policy and international trade worries continue to weigh on economic activity suggest a) that the underlying economy has been growing far less appreciably and b) where downside risks still persist for H2 and into next year, this highlighted by fresh news today of an ailing housing market.
As will many others, we are surprised by the June and Q2 outcomes, even with slightly better property and retail signals for the month. However, such an outcome, while a contrast to the two successive declines in the previous months, hardly alters what is at best a feeble real activity backdrop that may actually be weaker than the near flat underlying picture seen by the BoE. The GDP data are also volatile.