Continuum Economics
  • Search
  • About Us
  • Buy
  • Invite A Friend
  • My Basket
  • Articles
  • Calendar
  • Forecasts
  • Events
  • Data
  • Newsletters
  • My Alerts
  • Community
  • Directory
  • About Us
  • Buy
  • Invite A Friend
  • My Basket
  • Articles
    • All
    • Thematic
    • Tactical
    • Asia
    • EMEA
    • Americas
    • Newsletters
    • Freemium
    • Editor's Choice
    • Most Viewed
    • Most Shared
    • Most Liked
  • Calendar
    • Interactive
      • China
      • United States
      • Eurozone
      • United Kingdom
    • Month Ahead
    • Reviews
    • Previews
  • Forecasts
    • Forecasts
    • Key Views
  • Events
    • Media
    • Conference Calls
  • Data
    • Country Insights
    • Shadow Credit Ratings
    • Full CI Data Download
  • Newsletters
  • My Alerts
  • Community
    • FX
    • Fixed Income
    • Macro Strategy
    • Credit Markets
    • Equities
    • Commodities
    • Precious Metals
    • Renewables
  • Directory
  • My Account
  • Notifications Setup
  • Account Details
  • Recent Devices
  • Distribution Lists
  • Shared Free Trials
  • Saved Articles
  • Shared Alerts
  • My Posts
Published: 2025-07-23T16:21:02.000Z

Preview: Due July 24 - U.S. June New Home Sales - In the lower end of the recent range

byDave Sloan

Senior Economist , North America
1

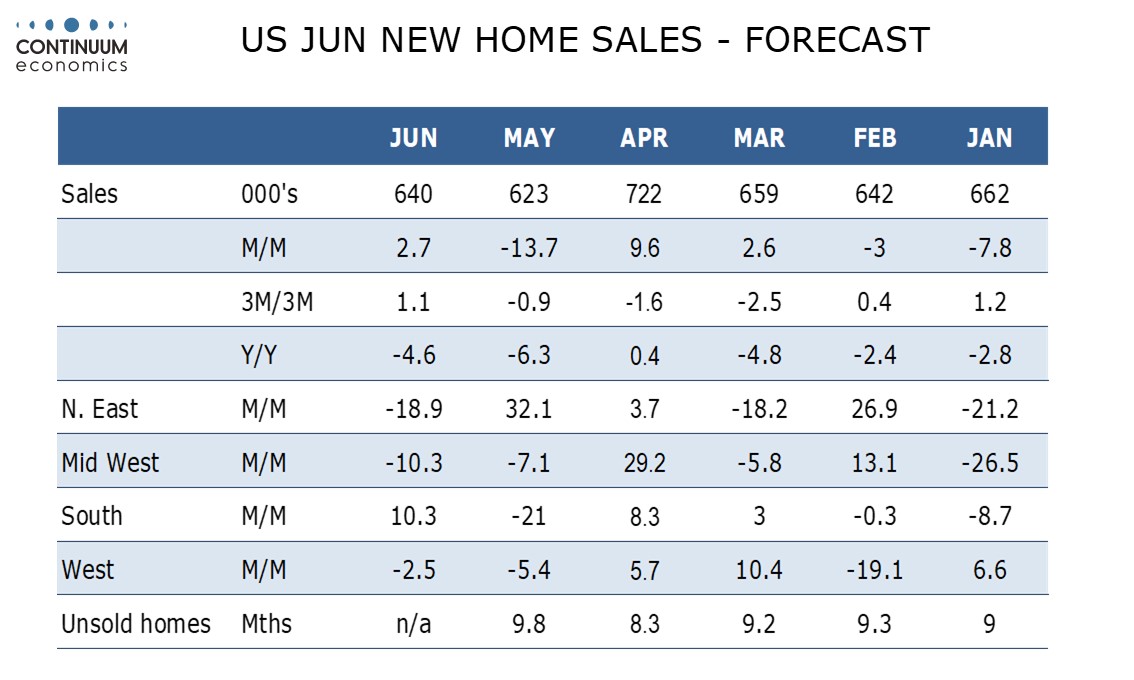
We expect a June new home sales level of 640k, which would be a 2.7% increase if May’s 13.7% decline to 623k, which followed a 9.6% increase to 722k in April, is unrevised. Trend in new home sales has no clear direction but the NAHB homebuilders’ survey suggested a weakening picture in June, which saw only a partial correction in July.

April’s level was the highest since February 2022 but only marginally above the 2024 high of 719k, which also came in April. May’s level was only marginally above the 2024 low of 621k seen in October and that was a month in which hurricanes acted as a short term negative.

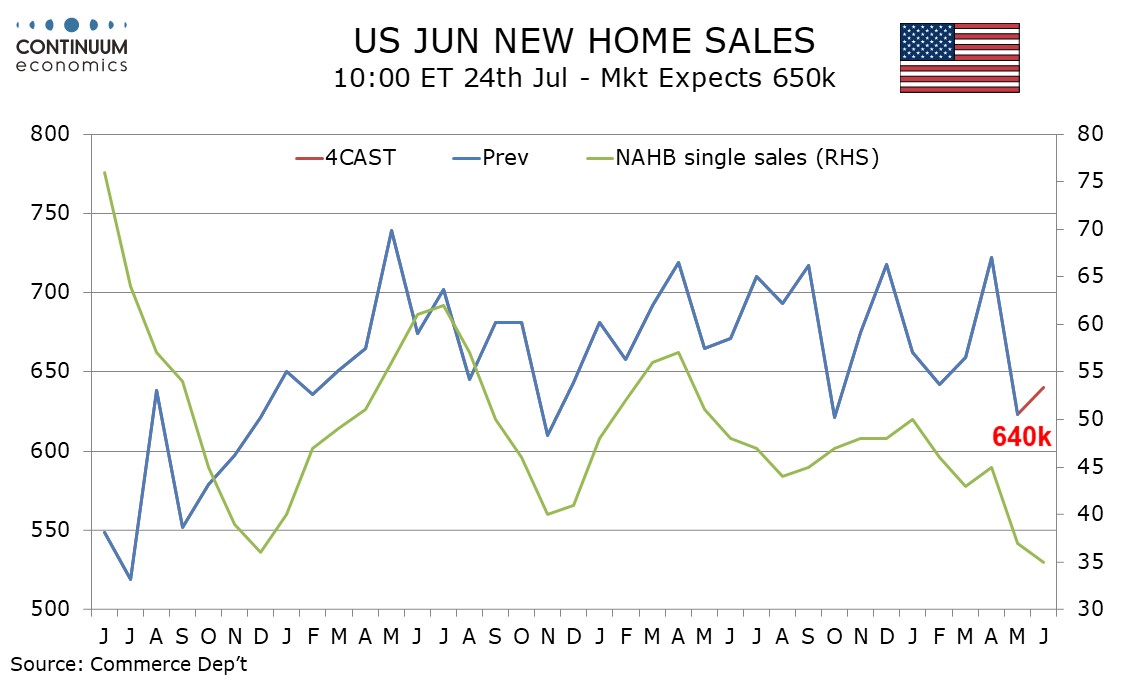
Given weakness in the NAHB survey we expect June data to come in closer to the lower end of the range than the upper, though not all surveys are as weak as the NAHB’s. The MBA’s house purchase index actually saw a marginal increase in June. June’s gain is likely to be led by the South, which is the largest region and significantly underperformed in May with a fall of 21.0%.

We expect the median price to fall by 3.0% on the month after a 3.7% May increase and the average price to fall by 2.5% on the month after a 2.2% May increase. This would leave yr/yr data unchanged for the median, down from a 3.0% May increase that was the first positive since December, and at a still positive 2.7% for the average, down from 4.6% in May, though this would mean three straight positives in Q2 after three straight negatives in Q1. 

Continue to read the article for free
Login

or

or

Topics
Foreign Exchange
Data
Data Previews

GENERAL

  • Home
  • About Us
  • Our Team
  • Careers

LEGAL

  • Terms and Conditions
  • Privacy Policy
  • Compliance
  • GDPR

GET IN TOUCH

  • Contact Us
Continuum Economics
The Technical Analyst Awards Winner 2021
The Technical Analyst Awards Finalist 2020
image