FX Daily Strategy: Asia, March 27th
Geopolitical Tension in the Centre
Cautious trade in DXY
USD/JPY May Retest High and Challenge 160
Figure : Iran War Scenarios and Oil Prices
| Baseline—65% | Upside—30% | |
| 4-8 week war | 2-6 month war | |
| Summary | U.S. declares victory due to high gasoline prices and Trump loathing of long wars. A formal ceasefire is unlikely, as Trump wants the PR of victory. However, some informal understanding on the Straits of Hormuz could allow most shipping to resume. Israel would likely cease military action against Iran at the same time as the U.S.
Shipping could recover and energy flows/strategic oil reserve release help to reduce the oil risk premium by mid-year. We would see WTI at USD75-80 by June and USD65-70 by end December.
A limited formal ceasefire would help restore energy flows quickly and help easy oil prices. | Iran fights on against U.S./Israel targets in the region, as U.S. reluctant to make concessions to Iran which wants to force agreement on no future wars. Iran could use drones for many months to cause mid-level problems around the region and effectively close the Straits of Hormuz. Could see escalation with U.S. invasion of Kharg island and Iran attacking more energy facilities in the region.
Strategic oil reserve release work for a 4-8 week war, but not a 2-6 month war and effective closure of the Straits of Hormuz. Oil prices would thus have to rise to cause some demand destruction around the world. We would see WTI at USD120-180 by April/May depending on the length of the war and USD80-110 by end December, as imbalance would spill over the whole of 2026.
|
Source: Continuum Economics. Other scenarios are less than 5% e.g. Collapse of regime/Civil War and move towards free election or IRGC overthrowing clergy.
Our central scenario remains a 4-8 week war in Iran. Trump’s loathing of long wars and high gasoline prices will likely prompts the U.S. to declare victory. A formal ceasefire is unlikely, but the end of hostilities could see an informal understanding of the Straits of Hormuz for most shipping, though conditions will remain fragile. Shipping could recover and energy flows help to reduce the oil risk premium by mid-year. We would see WTI at USD75-80 by end June and USD65-70 by end December. The main alternative scenario is a 2-6 month war, which could squeeze WTI oil prices up to USD120-180.
We are fine tuning our Iran war scenarios (Figure 1). The U.S. on balance is heavily biased towards a 4-8 week war, both as high gasoline/diesel prices risk the GOP losing the Senate as well as the House in November mid-term elections and as Trump strong bias is against long wars. Trump threat March 21 to bomb Iran’s power plants and then subsequent decision to postpone for at least 5 days is consistent with this 4-8 week war view. The one issue is that Trump does not like the image of him losing and so any end to fighting will be declared a victory for PR spin. Israel would likely stop attacks on Iran with the U.S. end of military strikes. Israel could have an election as early as May and Netanyahu claims Iran nuclear capabilities is crippled. However, Israel has signalled it would likely continue the war with Hezbollah. Iran is the key swing factor between a 4-8 week war and 2-6 month war. Iran is asking for U.S. and Israel commitment against future attacks or they will continue the asymmetric war against energy and effective closure of the Straits of Hormuz. However, Iran has suffered severe damage to conventional military offense and defence and is vulnerable to its shipping/exports being stopped e.g. Blockade or invasion of Kharg island. On balance, Iran will likely accept an end to hostilities rather than fighting on. We thus feel that a 4-8 week war is the highest probability, but this is unlikely to see a formal ceasefire with concessions (see below). The scale of energy infrastructure damage is also a further consideration for future energy prices and economic effects. We highlight below the two main scenarios that could occur, with some broad estimate of probability – with the understanding that these will likely change based on decisions in Iran/U.S. and Israel.
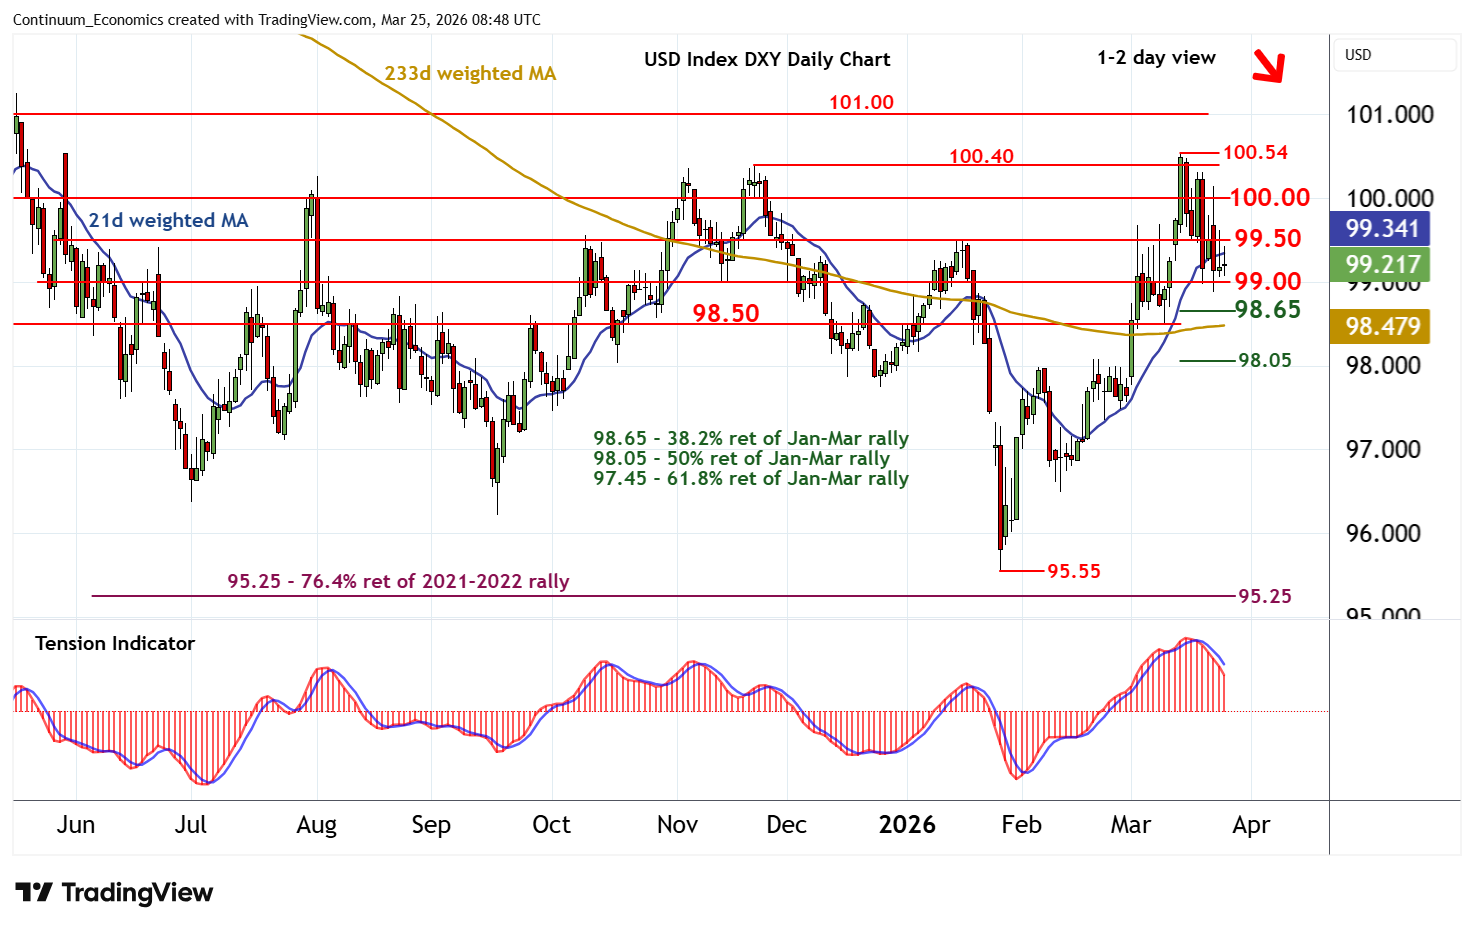
The choppy trade in DXY will likely give in when we hear any determined breakthrough in the geopolitical front. For now, it looks like Trump is doing things both the diplomatic and military way. With much uncertainty around, it seems Trump is gauging the pros and cons of striking Iran. The inflationary pressure from energy price, subsequent shock to the equities market are what we believe in Trump's mind. We do not think there is clear call but Trump should be more tilted to take an exit if he can get Iran to reopen the Strait of Hormuz.
On the chart, mixed intraday studies keep near-term sentiment cautious and extend consolidation above congestion support at 99.00. Daily readings are under pressure, highlighting room for a fresh test beneath here. But already oversold daily stochastics and rising weekly charts should limit initial scope in short-covering/consolidation within support at congestion around 98.50 and the 98.65 Fibonacci retracement. Meanwhile, resistance remains at congestion around 99.50. Any immediate tests above here should meet renewed selling interest beneath 100.00.
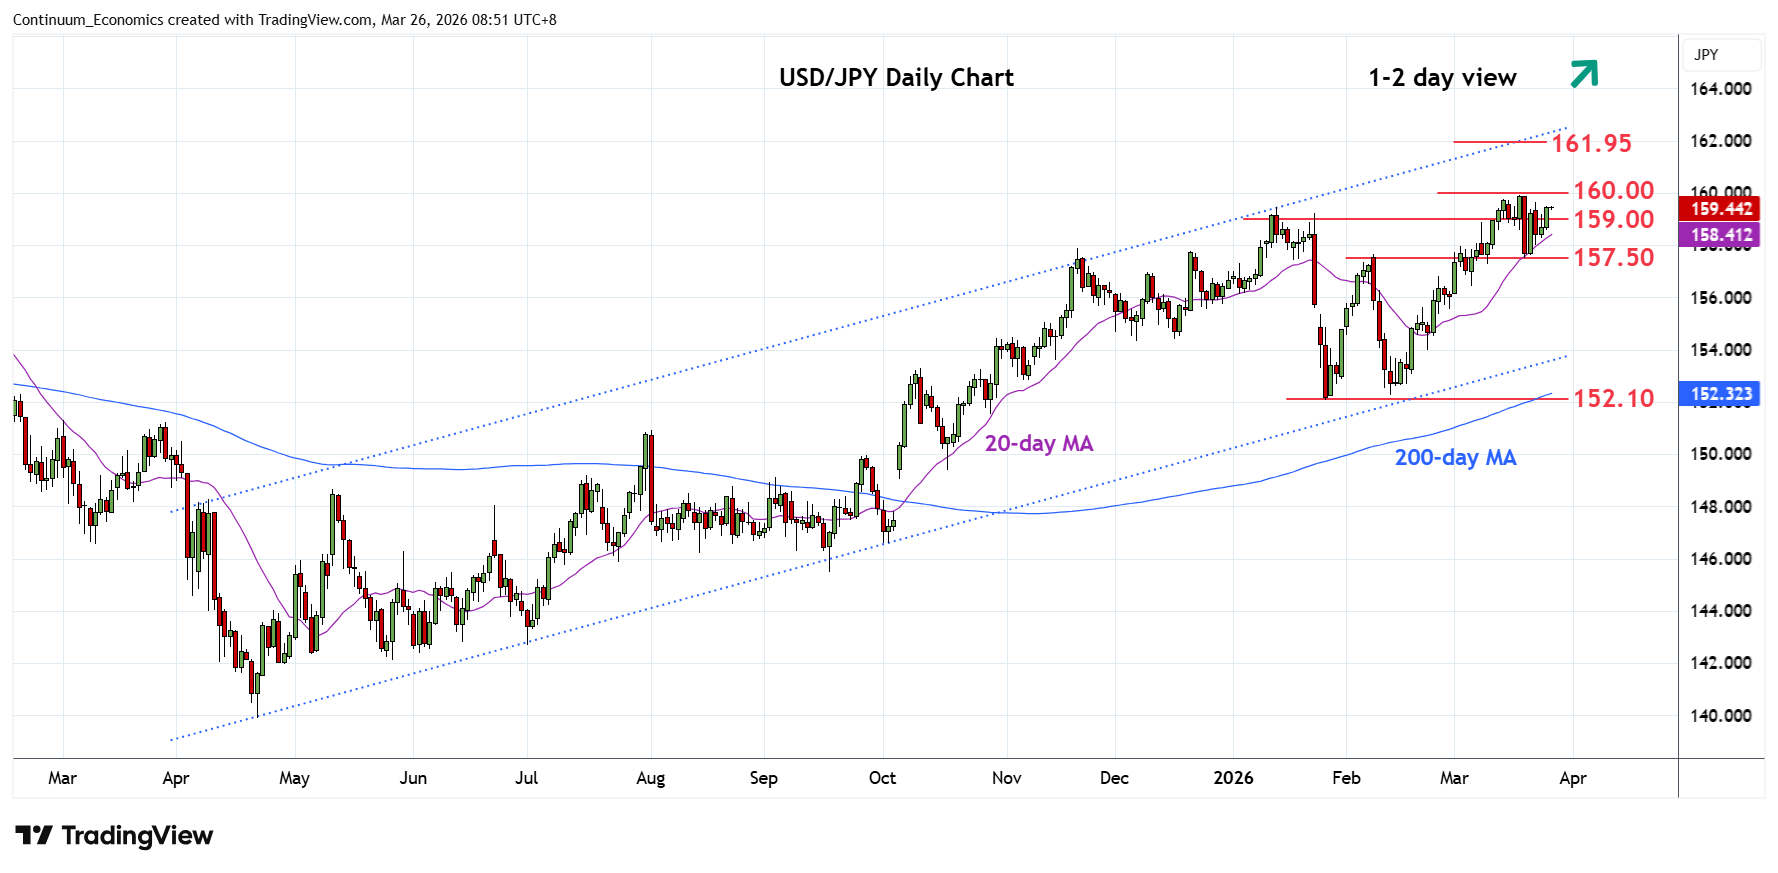
While USD is dominating the market, USD/JPY is the pair to watch out for. The pair is quickly approaching the 160 figure and only 1/2 figures away from historical level. Despite the recent pace of JPY weakening isn't rapid, the historical weakness will draw the Japanese officials attention and may see intervention. Moreover, if geopolitical tension worsens, we could see market participants rotate out of USD and choose JPY as their haven choice after crowding into the greenback.
On the chart, the bounce from the 157.50 low of last week to regain the 159.00 level has seen gains to retest the 159.45, January high. Daily studies remains mixed but bullish momentum from the February low suggest scope for break here will see room to retest the 159.90, 18 March current year high. Break here, if seen, will turn focus to the 161.00 level then the 161.95, July 2024 multi-year high. Meanwhile, support at the 158.00/157.50 congestion and low of last week should now underpin and sustain bullish gains from the 152.27, February low.