FX Daily Strategy: Asia, April 1st
Short vs Long Iran War
U.S. March Weekly ADP data rising modestly
U.S. February Autos and gasoline Retail Sales to rise
DXY Approaching strong resistance
Figure: Iran War Scenarios and WTI Oil Price Projections
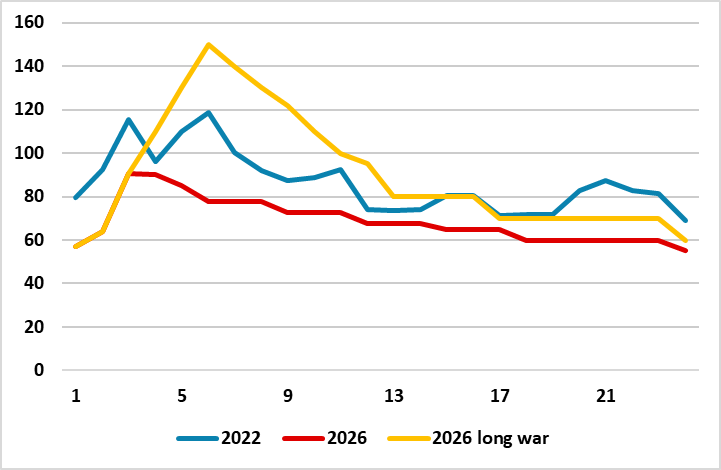
For a 4-8 week war and 3-4 quarters of energy price normalisation, we see a 10% U.S. equity market correction in H1 2026 driven by the current Iran war and/or consumption slowing due to lower (real) wage growth, alongside still stretched valuations in equity and equity-bond terms. Then we see this being followed by a H2 2026 rebound on Fed easing that brings the S&P500 to 7200 by year-end 2026. 10yr U.S. Treasury yields down to 4.0% by end 2026 and EUR/USD at 1.24.
For a 2-6 month war scenario a number of issues impact the macro and policy outlook. Firstly, whether the post war period could involve limited/partial or full Straits of Hormuz shipping. Issues 2-5 are labor market tightness/global supply pressures/consumption patterns and new fiscal support and stimulus. We feel that all four of these in either scenario would be less than during the 2022 Ukraine war and could dampen rather than amplifying inflation pressures. This could restrict DM 2026 policy tightening in this scenario and mean 2027 rate cuts!
U.S. equities would see a stagflationary hit via pressure on corporate earnings/valuations and the Fed not being able to cut initially. This could produce a deeper correction to 5500-6000. However, genuine fears of a mild recession would be needed for larger multiple deratings and more prolonged selloff. 10yr U.S. Treasury yields could reach 4.50-4.75% with USD150 oil prices. However, U.S. real yields are reasonable and this should be a restraint to the scale of a U.S. yield rise. Any more aggressive U.S. equity selloff, plus signs of a hard landing, would likely fuel a rush into U.S. Treasuries. If the Fed shows sensitivity to the slowing economy, then this could drive 10yr yields down to 3.50%. USD could initially go higher on USD150 oil prices, but then get whipsawed if U.S. equities see a deep pullback/bear market and the Fed eases on the economy. Higher yielding AUD and NOK are our favourite safe havens.
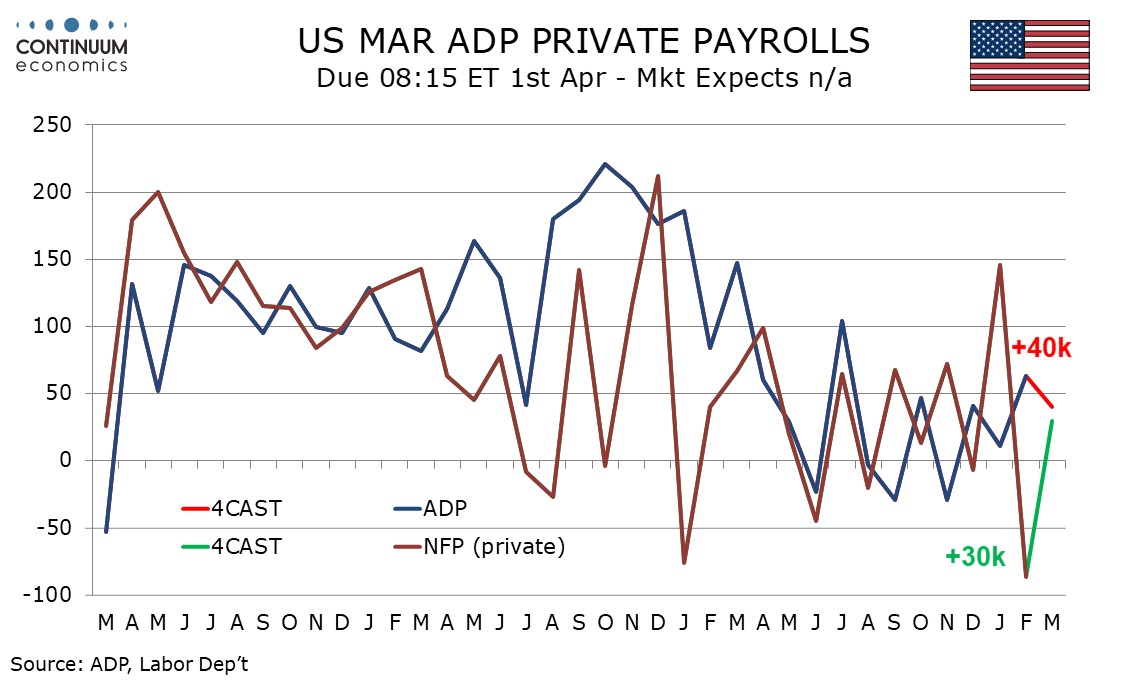
We expect a 40k increase in March’s ADP estimate for private sector employment, which would be consistent with a 4-week average of 10k in the weekly ADP employment report for the weeks to March 7. That was the week before the monthly data was surveyed. There may be some upside risk in the survey week given milder than usual weather and a fall in initial claims in that week. We expect the ADP data to marginally outperform a 30k increase in private sector non-farm payrolls, while we expect overall payrolls excluding government to increase by 20k.
ADP data did not prove a reliable guide to payrolls in the last two months, though a sharp ADP underperformance in January was fully offset by an ADP outperformance in February.
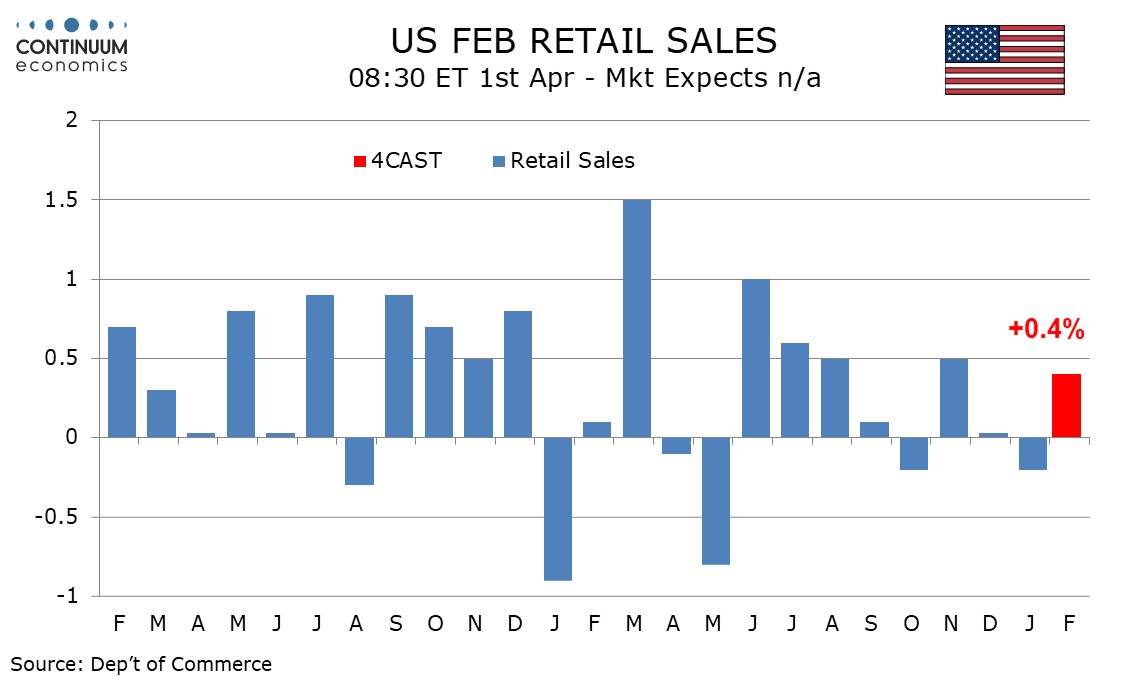
We expect February retail sales to see a modest bounce of 0.4% after a 0.2% decline in January, with sales ex auto increasing by 0.3% after two straight unchanged months. Ex autos and gasoline however we expect a rise of only 0.2%, down from 0.3% in January, keeping trend subdued.
Data from the auto industry shows sales reversing most of a January dip while gasoline prices saw a partial correction of a dip seen in January. Gasoline prices look sure to surge in March.
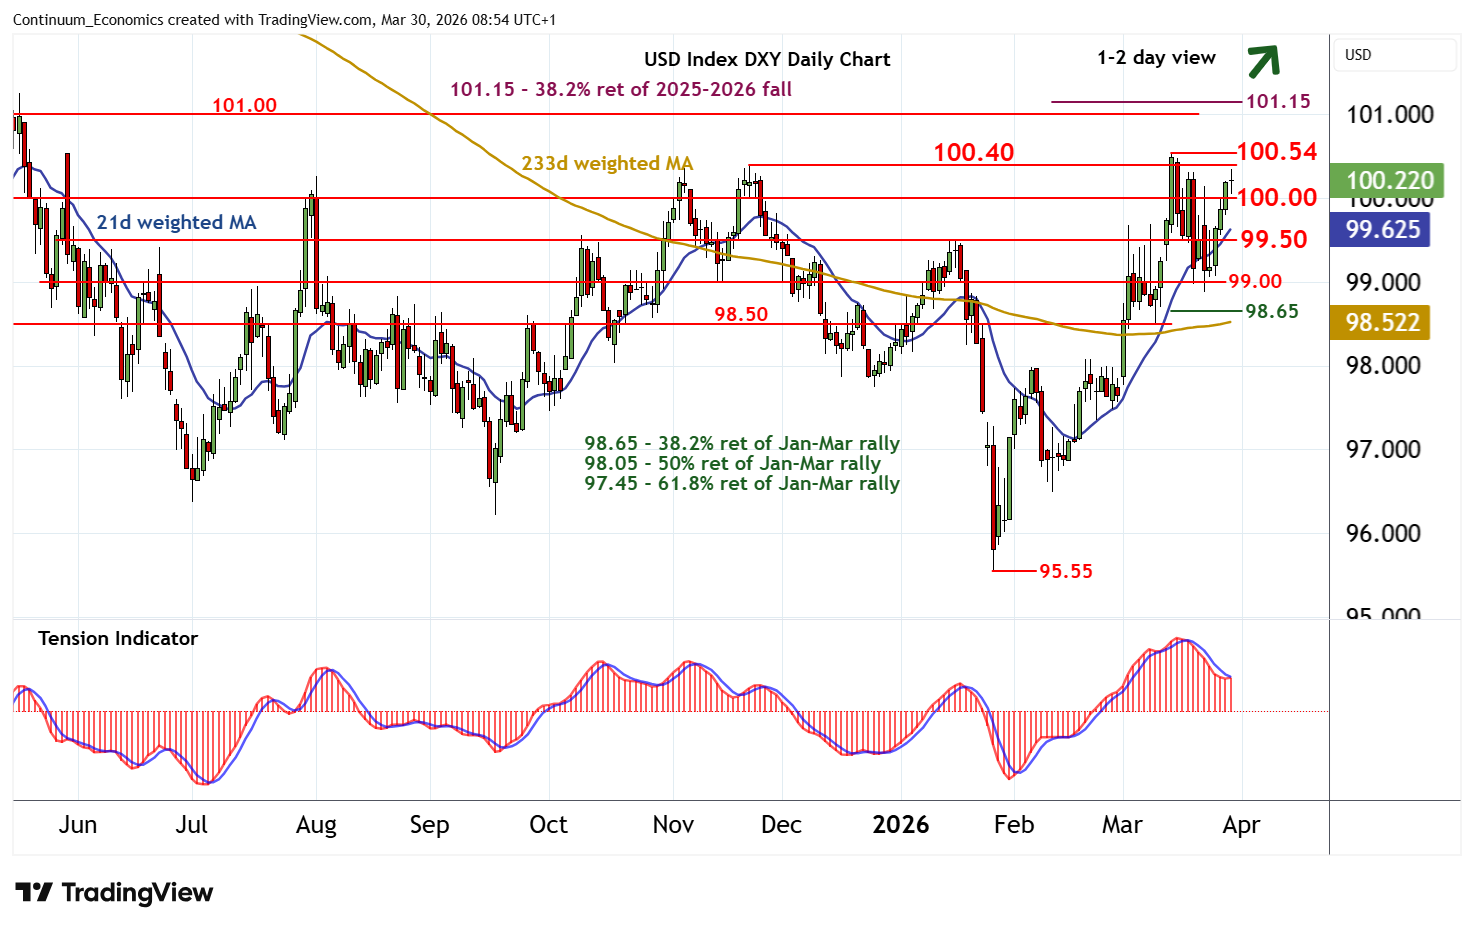
The greenback will remain in the spotlight as long as the geopolitical tension persists. While one can expect some sell off in the USD once haven bids fade, the ebbs and flows in the meantime will keep market participants from building major position.
On the chart, the anticipated break above 100.00 is giving way to consolidation beneath strong resistance at 100.40/54, as positive intraday studies flatten. Daily readings continue to improve, highlighting room for a later break above here and extension of late-January gains towards strong resistance at 101.00/15. But a tick lower in overbought weekly stochastics could limit any initial tests of this range in fresh consolidation, before the rising weekly Tension Indicator extends gains still further. Meanwhile, a close back below 100.00, if seen, would stabilise sentiment and prompt consolidation above congestion around 99.50.