FX Daily Strategy: Europe, February 4th
NZ Labor Market Data Unlikely to Sway RBNZ
U.S. January ADP Employment To slow, and underperform payrolls
A partial correction from December's bounce in ISM Services
EZ HICP Services Inflation Less Resilient as Headline to Slip Further
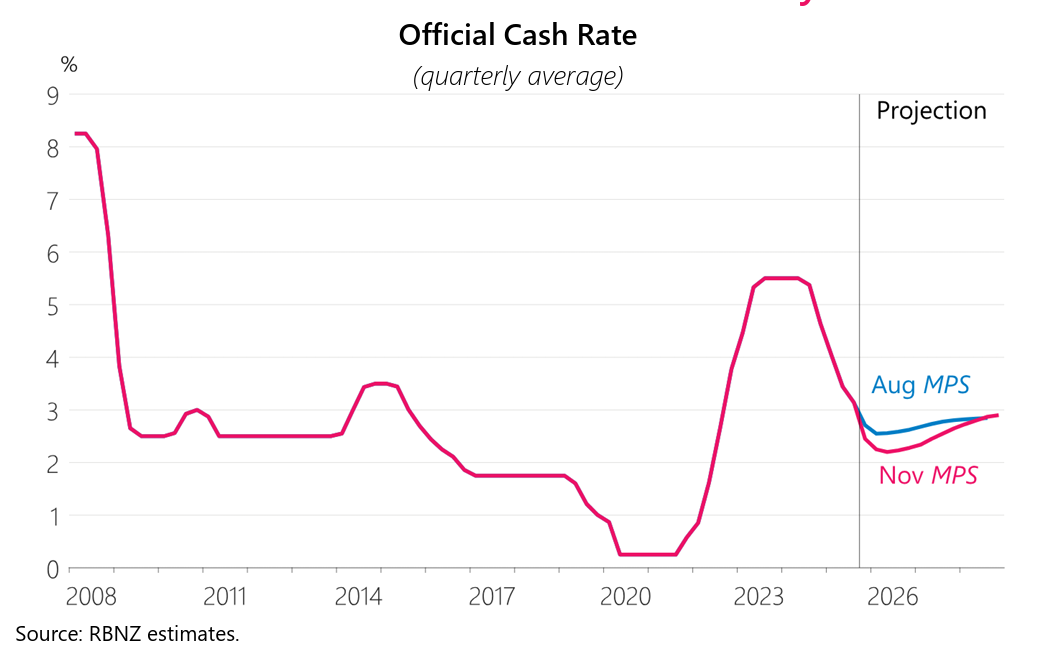
The Q4 Labor data will be released for NZ in late New York session. With little expectation to see a significant hawkish/dovish surprise, the data should not have a sustainable impact towards the Kiwi. Afterall, the RBNZ OCR forecast is seeing no more rate cut from the current 2.25% and first rate hike in late 2026. CPI is also downplayed by attributing the spike in inflation to "higher tradables inflation along with high inflation in household energy costs and local council rates", factors that are deemed to ease in 2026. Their forecast see inflation to moderate towards the mid point of target range in 2026.
The Q4 NZ jobs report came in mixed with a headline miss on unemployment rate but stronger participation. More importantly, labor cost grew by 0.5% as expected with higher employment change. While overall it is a decent report in the details, it is insufficient to sway the RBNZ.
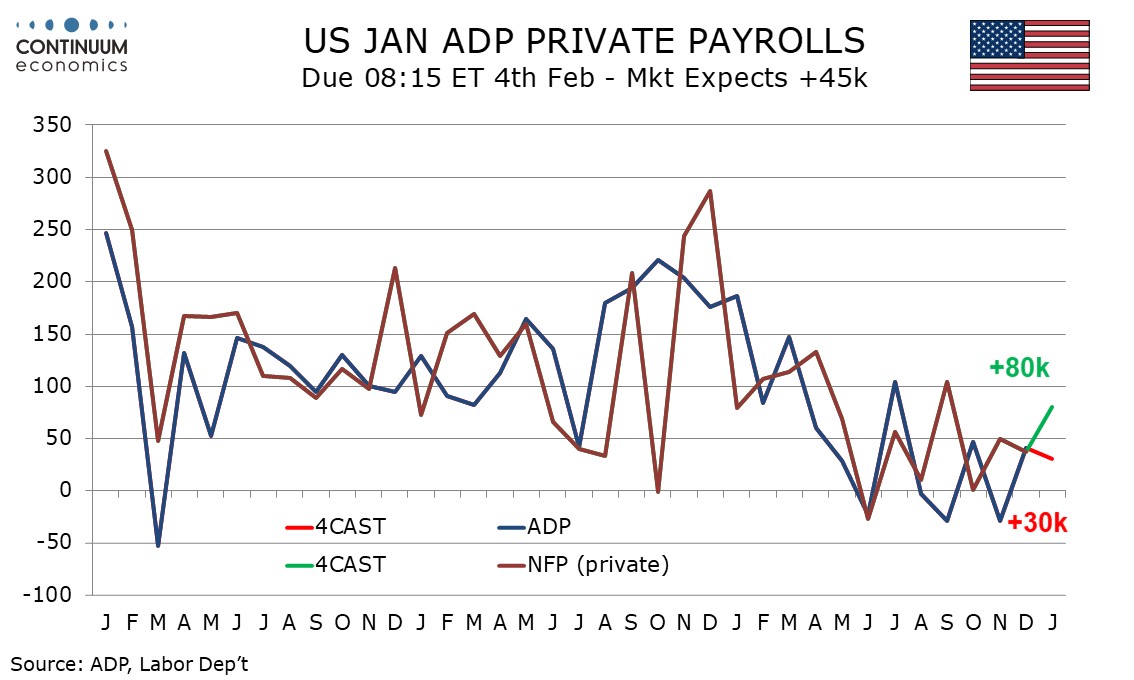
We expect a 30k increase in January’s ADP estimate for private sector employment, which would be a slowing from 41k in December. We expect the ADP report to significantly underperform January’s non-farm payroll, where we expect a rise of 80k in the private sector, and 85k overall. Weekly ADP data, showing an average weekly job increase of 7.75k in the four weeks to January 3 looks to be on a slowing trend, with the four weeks to December 13, December’s payroll survey week, showing an average gain of 10.5k, which was consistent with December’s 41k ADP outcome. The latest weekly data is still two weeks prior to the survey week for January’s monthly data, and low initial claims suggest no further deterioration, while bad weather in late January came after the survey week. However it is likely that January’s ADP data will show a slower rise than December’s.
December’s ADP data was close to consistent with December’s non-farm payroll but the recent tendency has been for ADP data to underperform, with the average ADP underperformance over the last six months being 22k. We expect a 50k underperformance in January, still a narrower gap than seen in September and November. Payrolls in January look due for a rebound from recent weakness in retail, which is less of a risk in the ADP data. We expect January’s ADP detail to show a modest improvement in goods, led by construction, but a slowing in services, after December’s ADP report showed the strongest rise in services since July. It is in services where the recent tendency for ADP data to underperform payrolls has most visible. Most prominent in the contrast has been education and health, though the gap narrowed in January, leaving the two series more consistent, but it is too soon to conclude that this will become a trend.
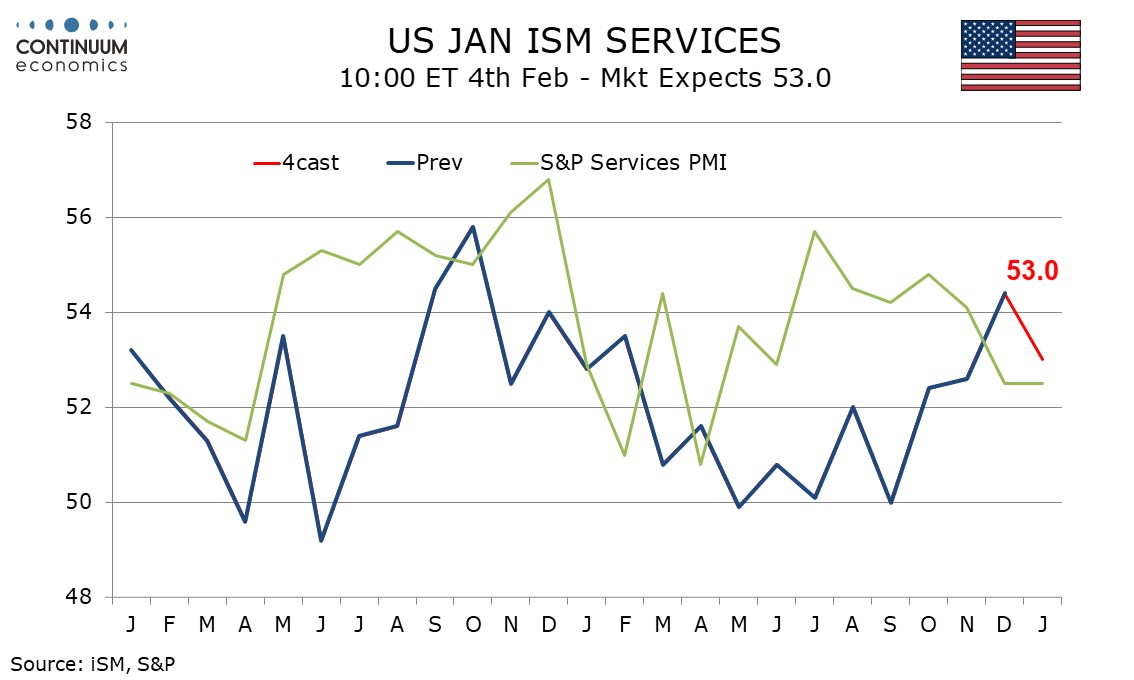
We expect January’s ISM services index to correct lower to 53.0 after a surprisingly strong December index of 54.4 that contrasted a slower S and P services PMI of 52.5 in December. January’s S and P services index did not rebound, remaining at 52.5. While we expect a less positive ISM services index, Fed services sector surveys from the Philly, Richmond, Dallas and Kansas City Feds, as well as the Empire State, were all improved from December, though none were strongly positive and three remained negative. We do not look for a full reversal of December’s ISM services improvement. 53.0 would be the strongest reading, bar December’s, since February 2025.
We expect January’s detail to show business activity and new orders both at 55.0, both down from December’s respective 56.0 and 57.9, but above November’s 54.5 and 52.9. We see employment at 50.0, down from December’s 52.0 which followed six straight below neutral readings. For the final component of the composite, delivery times, we expect a January reading of 52.0, little changed from December’s 51.8 but well below November’s 54.1. Prices paid do not contribute to the composite and here we expect a marginal increase to 65.0 from 64.3 led by energy prices, but still leaving the last three months softer than the preceding six, which peaked at 70.0 in October. This suggests that the lift from tariffs has peaked.
Figure: Headline and Services To Edge Lower
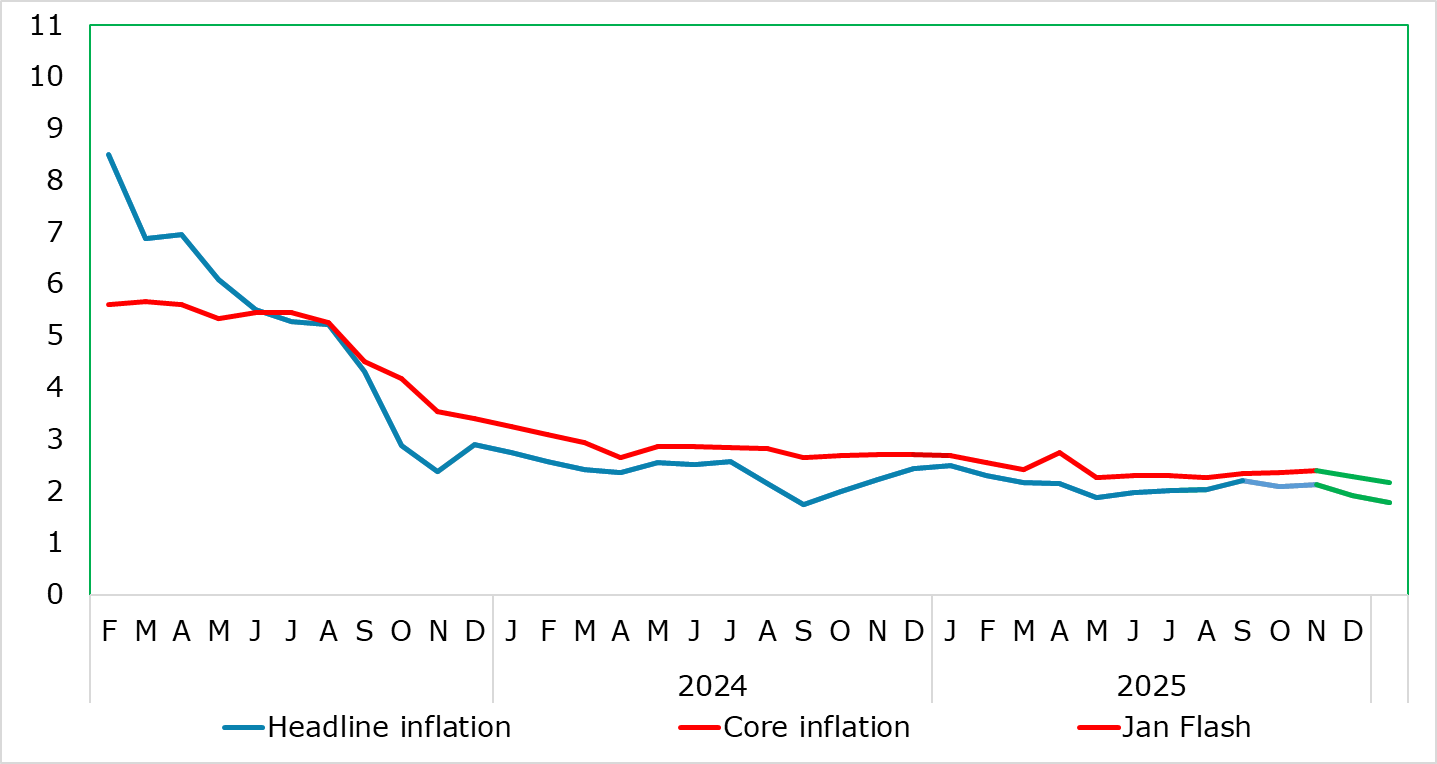
HICP inflation had been range bound for some 5-6 months between 2.0% and 2.2% with the November and October numbers in the middle of that range. And it seemingly stayed in that range falling to 2.0% in the December flash numbers, only to be revised down a further notch to 1.9% in the final HICP figure and thus to an eight-mth low. We see this as the start of a fresh but what may be a short-lived fall toward 1.5% in the current quarter, with a fall to 1.8% in the January flash – a fall to the cycle low of 1.7% last seen in Sep 24 is also possible. Much of this of this January drop will be energy related but a 0.2 ppt correction back in services last month is on the cards but probably not enough to pull the core down any further from its current cycle low of 2.3%. There are risks posed by the usual annual changes to the makeup and weighting of the HICP and perhaps form a further fall in non-energy industrial goods (NEIG) inflation, this possibly an increasing sign of softer import prices possibly related to Chinese export dumping.
As of this month’s numbers, several methodological changes will take effect in the HICP. Over and beyond the usual annual reweighting of the components, he index will be also now be compiled according to the new classification. Games of chance will be included in the HICP under the division of recreation, sport and culture. The index reference period will also be updated to 2025=100. What is clear is that with (relatively resilience) services having seen an increase in its weighting in the last three years this has acted to push up recorded overall inflation.
Regardless, the diehard hawks at the ECB will have focused on the recent rise in services inflation to a seven month high of 3.4%, a shift higher far less echoed by less favourable, but still target-consistent, adjusted m/m data. Even so, this seems to have reverberated within the ECB and seemingly prompted the upward revisions to the 2026 HICP outlook. Even so, the fresh fall back to 3.2% which we envisage (seemingly very much transport price driven) will not placate the hawks. What may do so is the other component of core inflation.
Even so, any further fall in non-energy industrial goods inflation from its 15-mth low of 0.4% may increasing be seen as increasing evidence of softer import prices possibly related to Chinese export dumping – ie such evidence is echoed by the clear fall in overall import price numbers of late. The question is whether what may be more than a cyclical fall in core goods inflation will offset any further (but not expected) resilience in services, should the latter not succumb to lower wage pressures as we think will be the case. Instead, core inflation may see a two-pronged downward push in the coming year, something already evident in m/m adjusted core and services data (Figure 2). This may be a major issue for the ECB, even if it goes against the worries and thinking of the hawks.