FX Weekly Strategy: Asia, April 20-24th
UK CPI Being Fueled But Watch Financial Conditions?
Canada March CPI Higher on energy but core rates seen close to stable
U.S. April S&P PMIs Slightly firmer despite Middle East risk
U.S. March Retail Sales Surge on gasoline prices
Figure: Headline Stable But Core Higher
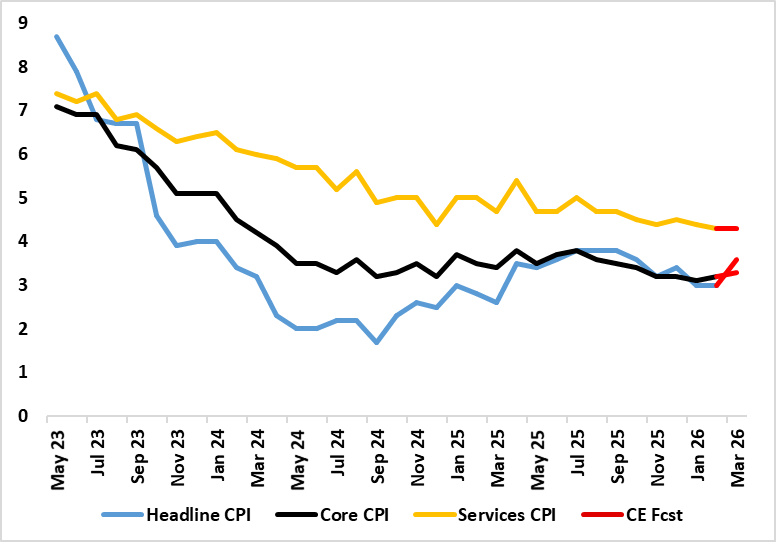
The stormy weather inflation wise is now very evident, most notably in UK fuel prices surging. Thus after a stable 3.0% (a 10-mth low) February’s headline – matching both consensus and BoE projections we see it jumping to 3.5% in March. Services, however, may stay at 4.3% which was a four-year low (Figure) but the core could edge back up a notch due to higher non-energy good inflation (Figure). The markedly and relatively greater surge in diesel relative to unleaded fuel warrants a hardly surprising upgrade to the price outlook for the rest of the year. On the basis of our baseline 4-8 week war thinking, we see the headline CPI falling back for in April before moving back higher in May in Q4 but then dropping back to end the year to 2027 at just over 2.5% but with the 2027 picture little changed, not least as tightening financial condition bite.
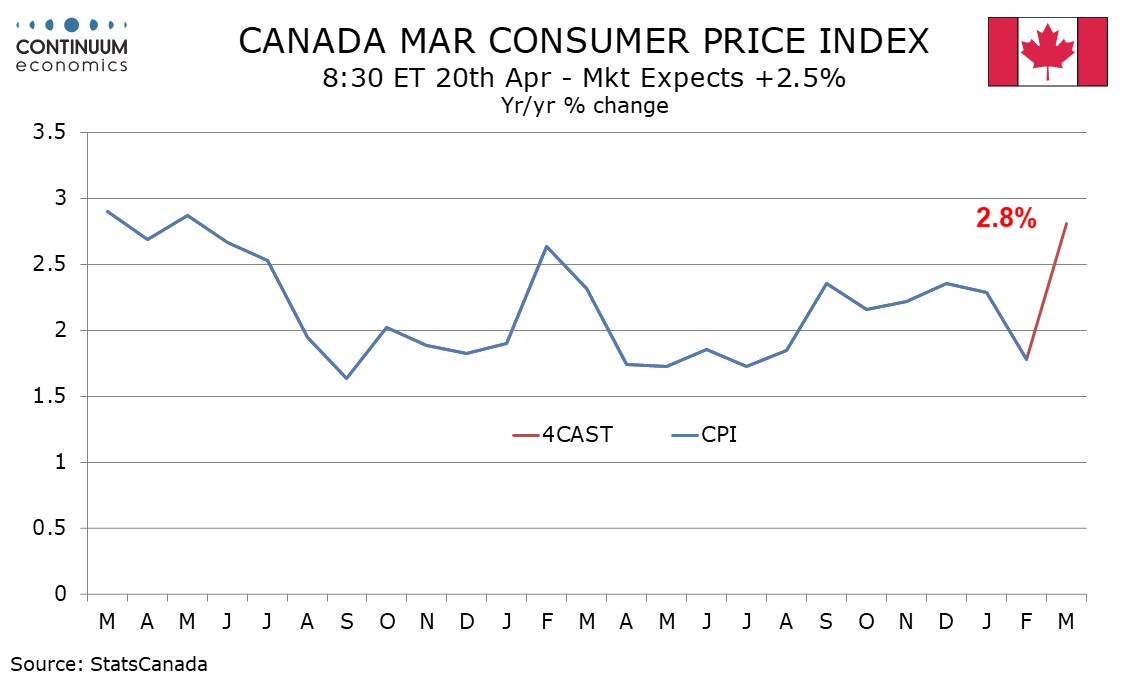
We expect March Canadian CPI to bounce to 2.8% yr/yr from 1.8% in February, reaching its highest since May 2024. We expect ex food and energy CPI to also pick up, to 2.3% yr/yr from 2.0%, but we expect the Bank of Canada’s three core rates to be close to stable, still slightly above the 2.0% target. Gasoline prices surged around 25% on the month, similar to gains seen in the US, and will lead the rise in CPI. On the month we expect a 1.0% increase seasonally adjusted and a 1.3% increase before seasonal adjustment. Ex food and energy we expect a 0.3% rise seasonally adjusted and a 0.5% increase before seasonal adjustment. Before rounding we expect yr/yr growth of 2.81% overall and 2.28% ex food and energy.
In the last ten months seasonally adjusted ex food and energy CPI has seen four gains of 0.1%, three of 0.2% and three of 0.3%, with each of the 0.3% gains being only marginally above 0.25% and each of the 0.2% gains being marginally below 0.2% before rounding. While the feed through from energy prices to core CPI is likely to be marginal in March, even a small impact may be enough to move the seasonally adjusted increase to 0.3% before rounding.
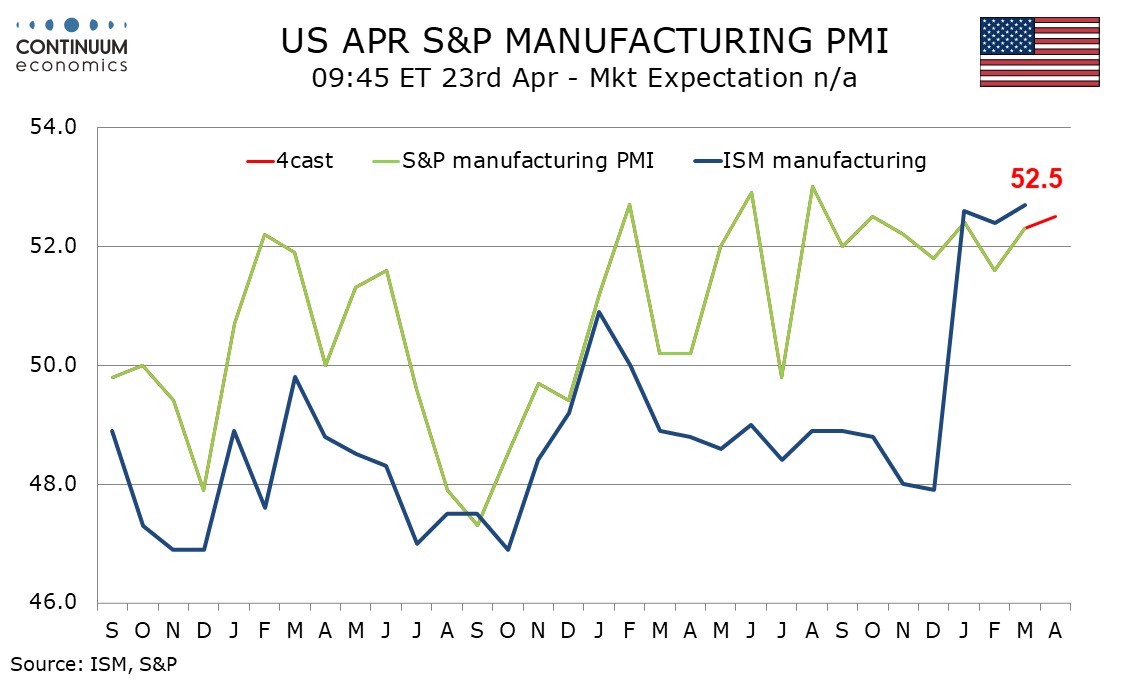
We expect modest increases in April’s S and P PMIs, manufacturing to a healthy 52.5 from 52.3 and services to a neutral 50.0 after March’s 49.8 fell below neutral for the first time since January 2023. Improved Empire State and Philly Fed manufacturing surveys in April are positive signals for S and P manufacturing, though March manufacturing output lost a little momentum, contrasting strong ISM data. The scale of the ISM’s Q1 improvement may be a little overstated, but the S and P’s manufacturing index has been stable at a healthy level for significantly longer, and looks set to remain solid in April despite the risks coming from the Middle East.
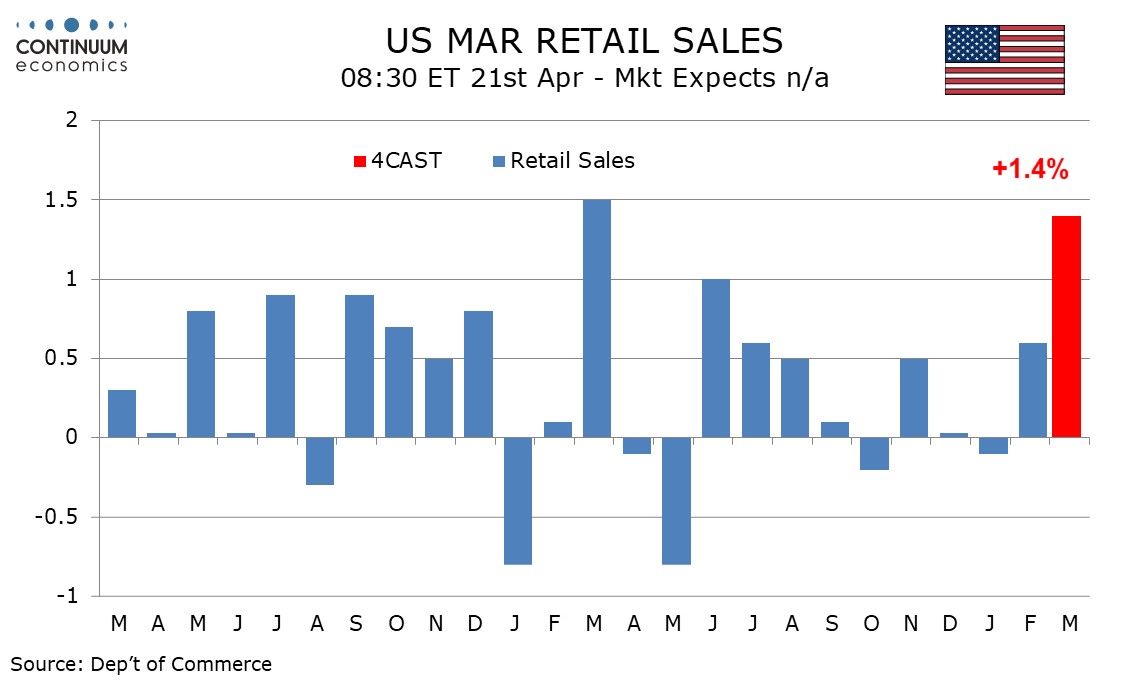
We expect March retail sales to surge by 1.4% largely on surging gasoline prices, with sales ex auto and gasoline even stronger at 1.6%. Ex autos and gasoline we expect a rise of only 0.2%, on the weak side of a trend that has recently lost momentum. Most of the rise in sales will come from a surge in gasoline prices. Industry data suggests a rise in auto sales, we expect by 0.7% after a 1.2% increase in February, but this will not match the ex-auto increase, leaving overall sales underperforming the ex-auto gains.
For the Week Ahead
UK
After what may be softer Rightmove housing data (Mon), the coming week sees several important economic updates looming, most notably the CPI (Wed). The stormy weather inflation wise is now very evident, most notably in UK fuel prices surging. Thus after a stable 3.0% (a 10-mth low) February’s headline –we see it jumping to 3.5%-3.6% in March. Services, however, may stay at 4.3% which was a four-year low (Figure 1) but the core could edge back up a notch due to higher non-energy good inflation.
There is also the ever-more important labor market numbers the softening in which even arch BoE hawks admit could tame second-round effects. But this data release (still pre-Iran War), now encompassing updates not just from the long-standing ONS but also real time figures from the HMRC (which we suggest are more authoritative data and are now officially accredited) is likely to see little further drops in the official earnings data, less so for private sector regular earnings than the overall, but with both at just over 3% they would be consistent with the BoE inflation remit Otherwise, the HMRC numbers are likely to show that employment is continuing to contract and maybe more broadly so as far as the private sector is concerned, while its pay data may suggest a fresh slowing. Thursday sees monthly public borrowing numbers which are running slightly below year-before levels.
The same day also sees CBI industry survey numbers. But it is the April PMI flashes (Thu) that take precedence at least in market eyes, as these will show a second month’s impact from the Middle East conflict. In March, at 50.3, down from 53.7 in February, the Composite PMI signalled only a marginal overall increase in private sector output. Sector data signalled a loss of growth momentum in the service economy and a renewed downturn in manufacturing production, while input costs at UK private sector firms rose to the greatest extent since February 2023. We see a further clear slide.
Otherwise, war-induced worries should feature again and possibly more strongly in the GfK consumer confidence numbers (Fri) arriving on the same day as we expect a similarly-driven correction in March retail sales figures, although the early Easter may rescue the data as footfall data suggest. There is little from the BoE in terms of MPC appearances, but there is the Decision Makers’ survey (Thu) and the Agents survey (Fri).
Eurozone
Still suggesting weakness even before the Iran War started, construction output data (Mon) may show further softness. But offering a further and possibly broader glimpse of how the economy may be faring since the war started, many eyes will be on the German ZEW survey (Tue), and EU/EZ consumer confidence (Wed) but the focus will be on the flash April PMI data (Thu). The question being how much of a further correction occurs. Indeed, in March the Composite PMI fell to 50.2, from February's 51.9., the lowest since May last year. Demand for EZ services apparently decreased in March for the first time since July 2025. A broad halt to hiring coincided with a marked fall in business confidence as expectations sank to a 10-month low. Cost pressures intensified in March, accelerating to a 34-month high. The latter may jump even more in April causing the composite to fall below 50 – possibly well below Other survey data also dominate this week with what may be weaker IFO numbers (Fri), INSEE figures (Thu). But the week also sees ECB President Lagarde speak in London (Wed) before the Council go into pre-meeting purdah.
Rest of Western Europe
There are few key events in Sweden, with Riksbank Board speeches (Mon & Tue). In Switzerland, Friday sees comments from the SNB president who speaks at the AGM. Norway see the Norges Bank Marketing Seminar (Tue) but where any policy hints will be kept to a minimum if at all. Thursday sees jobless data and industrial confidence numbers.
USA
The US calendar is fairly quiet, though Tuesday’s release of March retail sales will be a significant one. We expect surging gasoline prices to lead a 1.4% increase overall with a 1.6% rise ex auto, though ex autos and gasoline we expect a subdued rise of only 0.2%. Tuesday also sees March pending home sales. Senate hearings for Fed Chair nominee Warsh are now tentatively scheduled for Tuesday but with Trump continuing to make threats towards current Chair Powell when the Senate will conduct the hearings remains uncertain. Current Fed officials will be quiet ahead of the April 29 rates decision. Thursday’s weekly initial claims cover the survey week for April’s non-farm payroll. Also on Thursday we expect modest increases in April’s S and P PMIs, manufacturing to 52.5 from 52.3 and services to 50.0 from 49.8. The final April Michigan CSI is due on Friday. The preliminary reading of 47.6 was a record low.
CANADA
Canada’s key release will be March CPI on Monday, where we expect an increase to 2.8% yr/yr from 1.8% but little change in the Bank of Canada’s core rates. Monday also sees the BoC’sQ1 business outlook survey. March’s IPPI and RMPI are due on Thursday. Friday sees February retail sales. A preliminary estimate for a 0.9% increase was made with January data.
JP
National CPI on Friday remains critical. While headline figure has fallen below target range with core & core-core metrics following the down trend. It is mostly masked by the extension of energy rebates, underlying inflation remains strong with higher wage growth and the oil shock. It will be a hawkish surprise to see stimulus unable to cushion the energy spike. Japan will also be releasing their trade balance on Wednesday, though it will be carrying less weight.
AU
Another empty calendar week. Only PMIs on Thursday.
NZ
CPI on late Monday and Trade Balance on late Sunday, with the first being more important. The RBNZ has begun to rotate away from their dovish stance after the recent energy spike. If we see stronger CPI above 3.5%, their forward guidance may change in the coming meeting and change market pricing in terms of expected rate change.
Recap of the Week
Iran Blockade and What Next?
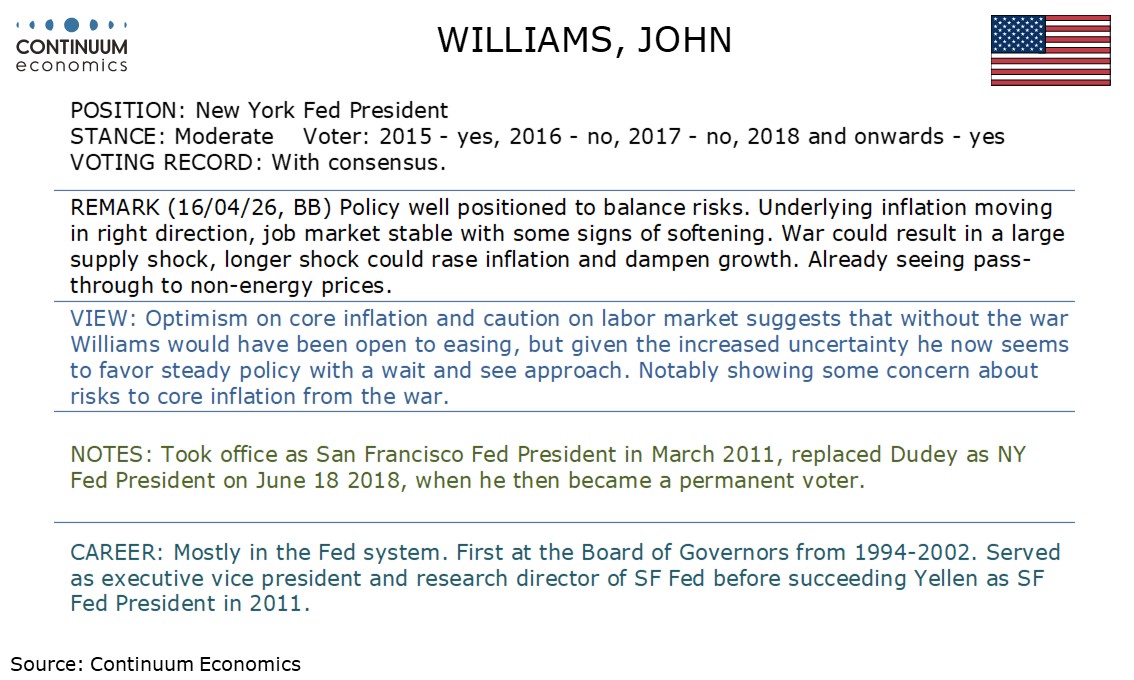
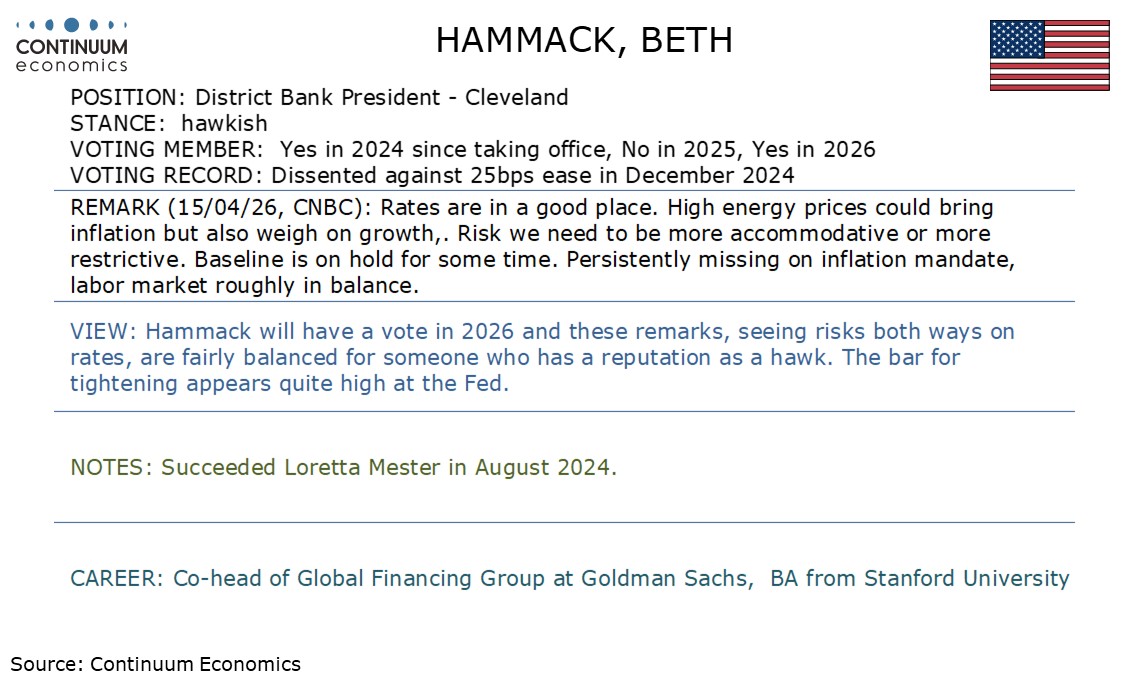
This Week's Fed Speakers
DXY Limited tests higher
UK GDP Fresh But Fleeting Momentum Before the War
China GDP Beat, But Domestic Demand Weak
Figure 1: Iran/Iraq Tanker War 1987-88
| Incident | Comments | |
| USS Stark | May 17 1987 Iraq aircraft attacks USS Stark by mistake | 29 U.S. servicemen killed. Ship has severe list, but avoided sinking and sails to Bahrain. Iraq apologises as they thought it was an Iranian ship. |
| Bridgeton oil tanker | July 24 1987 oil tanker hit by Iran contact mine | Modest damage to huge tanker, but U.S. Navy ships had to follow Bridgeton into Kuwait due to risk of other mines. |
| USS Samuel Roberts | April 18 1988 Iran contact mine hits US frigate | 10 U.S. serviceman injured. Ship keel snapped, but did not sink due to emergency repair work. U.S. launches retaliation attack on Iranian gulf oil platforms 4 days later. |
Source: US Navy/Continuum Economics
Though the U.S. is introducing a blockade on Iran oil exports, we think the U.S. and Iran remain reluctant to restart the war. How Iran responds to the U.S. blockade is important. It could choose to respond by attacking Gulf energy installations before or after the 2-week ceasefire ends on April 22. Alternatively, Iran could seek a path to deescalate, such as not hitting back/extending the ceasefire/a goodwill gesture of allow some shipping through the Straits of Hormuz/setting tolls for all ships to pass through the Straits. This week needs to be watched closely to anticipate the next chapter in the conflict.
Trump administration’s decision to blockade makes sense from a military standpoint, as it achieves the same objective as seizing Kharg Island without boots on the ground – we feel invasion is a very low probability. However, it hurts the GOP and Trump before the mid-terms. It extends the period of military tension, and more importantly keeps gasoline and diesel prices very elevated – the April University of Michigan consumer survey on Friday shows that this is hitting consumer confidence badly. Therefore, we believe the Trump administration could try a 2nd round of negotiations to reach a deal to reopen the Straits of Hormuz. This could also involve extending the 2-week ceasefire. Further talks are feasible but both sides would need to compromise to reach an agreement and the odds remain against a deal. Iran's nuclear ambitions and the volatile status of the Strait of Hormuz remain critical points of contention
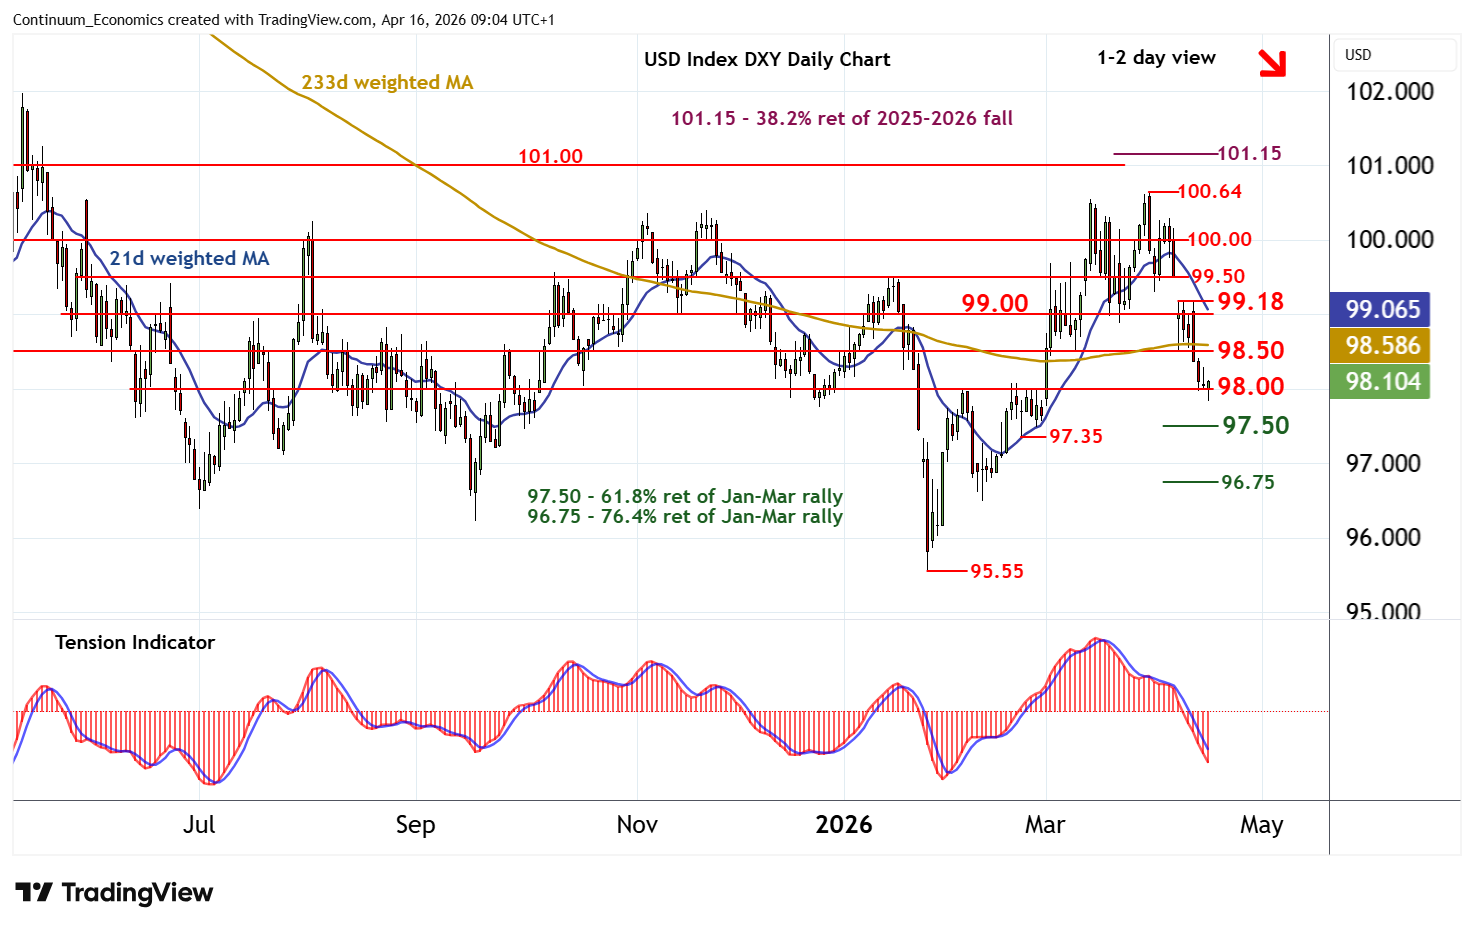
On the chart, consolidation above 98.00 has given way to a test beneath here, with prices reaching 97.83 before bouncing back above 98.00. Rising intraday studies and flat oversold daily stochastics highlight room for a minor bounce. But the negative daily Tension Indicator and bearish weekly charts should limit scope in renewed selling interest beneath congestion resistance at 98.50. Following cautious/corrective trade, fresh losses are looked for. A close below 98.00 will add weight to sentiment and extend late-March losses towards 97.50.
Figure: GDP Growth Hardly Strong and With Increasing Downside Risks Ahead?
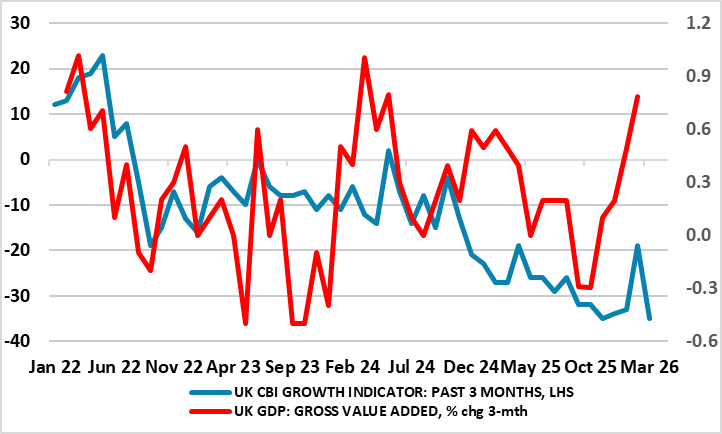
Without the outbreak of the Iran War there was already a split within the MPC about the policy outlook and that such divisions may have been accentuated by this latest GDP update which showed a very much above consensus m/m rise of 0.5%, the strongest in 14 months. But of course, the conflict has changed everything (Figure), seemingly shifting the policy debate from the size and speed of further easing to what extent policy needs to be tightened to dampen any second round effects from the current energy prices surge. Notably, Governor Bailey has just suggested the BoE will be in no rush to hike, all the more notable as his comments seem to suggest that he is speaking on behalf of the MPC as a whole or at least a large majority. We very much side with Bailey’s thinking, noting that even with the surprise momentum the UK may have had ahead of the conflict, it is still very modest compared to that seen four years ago when the Ukraine War precipitated the last energy price surge. This is especially so in regard to the consumer with clear implications for inflation risks.
Instead, and as the IMF this week underlined the real economy fall-out the UK may face could be the most sizeable for any major economy. This is very much evident already in business survey data, perhaps best seen in the aggregated numbers produced by the CBI which chime with the GDP data in suggesting some improvement in February but which also suggest that such a pick-up was very short-lived.
Figure: Industrial production and Retail Sales (Yr/Yr %)
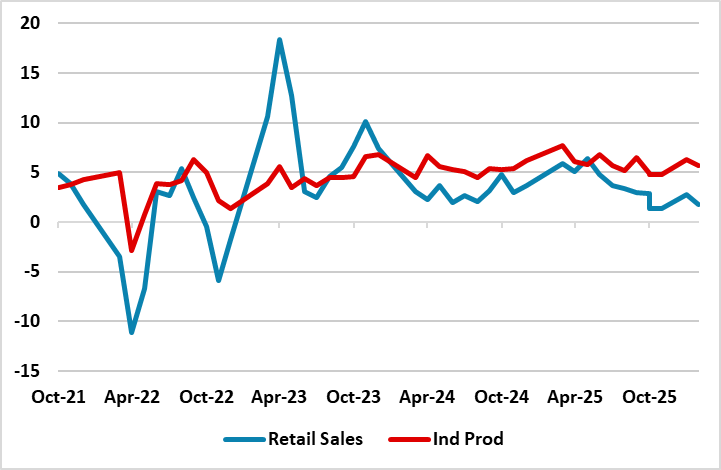
Q1 GDP beat expectations helped by Industrial production, but the domestic demand picture remains weak with soft consumption and the ongoing negative drag from the residential property sector. We still feel that the economy remains too dependent on high tech manufacturing and modest consumption will act as a drag on GDP growth, while the Iran war will have an adverse impact on exports and production from Q2. Additionally, China’s authorities remain reluctant to be aggressive in policy stimulus. We stick with 4.2% GDP growth for 2026.
The Q1 GDP at 5.0% Yr/Yr was better than expected, which was also the case with the March Industrial production data at 5.7% v 5.3% Yr/Yr. The production side of the economy likely accounts for the GDP surprise, as other areas were soft in Q1 except government investment. However, the industrial production buoyance is ahead of domestic demand and we feel that exports are unlikely to fill the gap like 2025. Thus we see industrial production slowing through 2026. One example is automobiles, where production at +7.5% Yr/Yr is way ahead of car sales at -11.8% Yr/Yr.