FX Daily Strategy: Asia, March 24th
Australia CPI More Relevant Than Ever
UK CPI The Calm Before the Storm?
U.S. Q4 Current Account Correction from record pre-tariff deficit
The Australia February CPI will be released on Wednesday Asia session and more relevant than before. Market participants are widely expecting at least one more 25bps rate hike from the RBA and are speculating another one in early May. The consensus is seeing February CPI to be at similar level of January while we are expecting the heat to cool slightly, yet remain well above 3%. April seems to be a good time for the RBA to hike rates as the geopolitical tension persists. The RBA will likely do a pre-emptive hike to tackle the above target inflation.
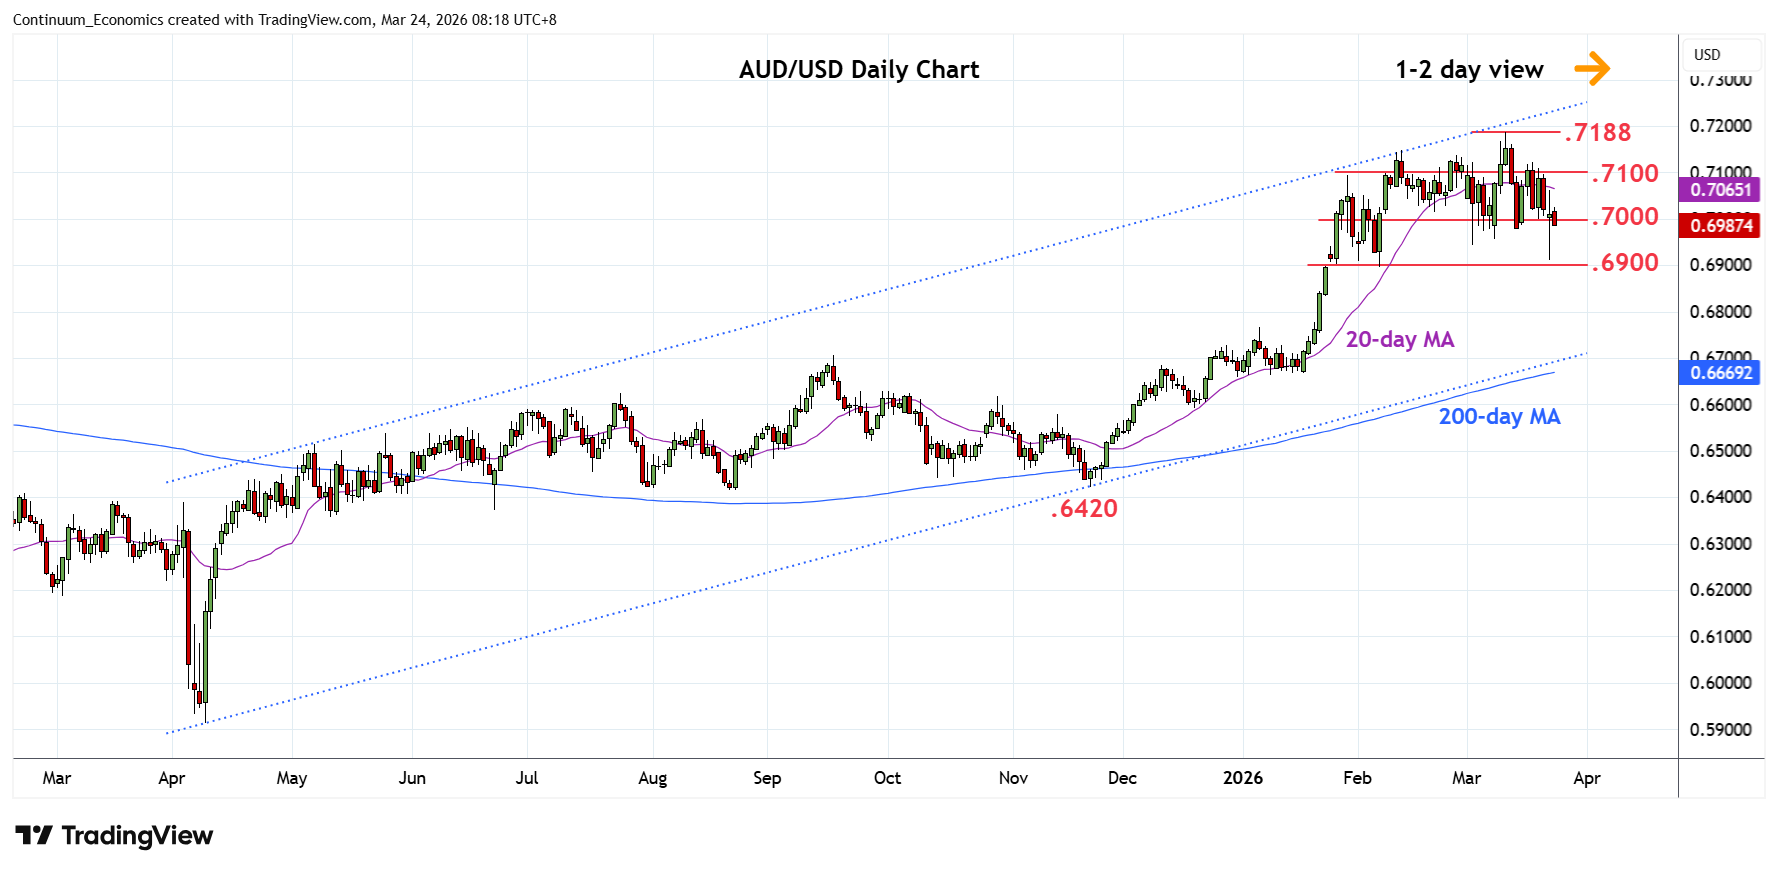
On the chart, volatile trade has seen spike to .6910 low ahead of rebound to consolidate at the .7000 level. Further choppy trade can be expected with bias to the downside and retest of the .6910 low and .6900/.6895, support and 38.2% Fibonacci level cannot be ruled out. Meanwhile, resistance remains at the .7050/.7100 congestion which is expected to cap. Would need to regain this to fade the downside pressure and open up the .7147 and .7188 highs to retest.
Figure: Headline Moves Sideways?
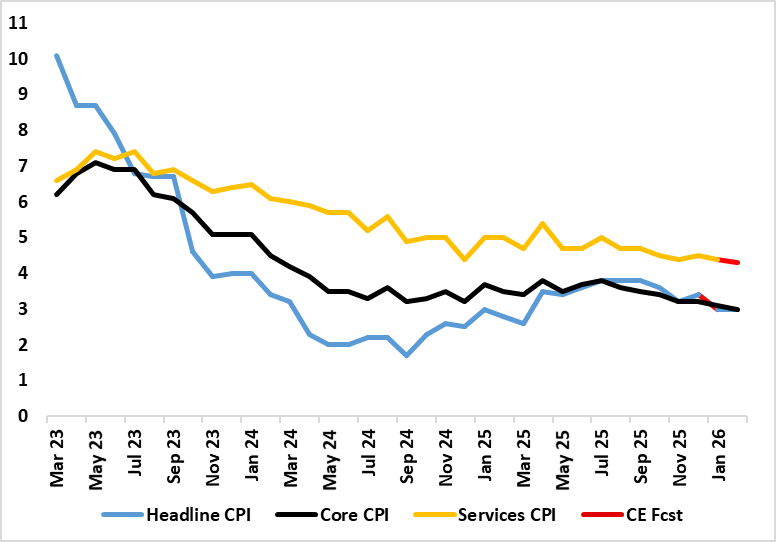
Although most aspects of the January CPI came in a notch above BoE thinking, there was still a clear fall even in the core rate. Indeed, the headline CPI rate fell from December’s 3.4% to 3.0% (a 10-mth low) and we see it staying there is February’s numbers - as do BoE projections. Services and the core rate fell both 0.1 ppt to 4.4% and a new cycle low of 3.1% for the latter and both may edge down further in the next set of data. They will be offset by higher fuel prices, thereby a foretaste of what is to come in coming months as the Middle East conflict spills over. This is all the more notable as declines, if not broad(er) disinflation had been signalled for some time by adjusted m/m data.
Admittedly, not all aspects of the CPI data were reassuring, with a further rise in catering services inflation, often seen as an indicator of price persistence given that the sector’s cost base is very much wage related. Even so, the evidence on this is mixed with HMRC pay data very clearly showing a slowing in wage inflation for accommodation and food services. Regardless there are very clearly reassuring aspects most notable in even lower rental inflation which at just over 3% has more than halved in the last year, surely an added sign that the housing market is in the doldrums. There was also a further slowing in non-energy goods inflation which probably reflects both weak global demand and dumping of goods by China once destined for the U.S. But the February data will be considered to be old, if not irrelevant, news. But will after the calmer numbers of late provide something of a glimpse of the energy storm ahead, with a jump in in fuel inflation
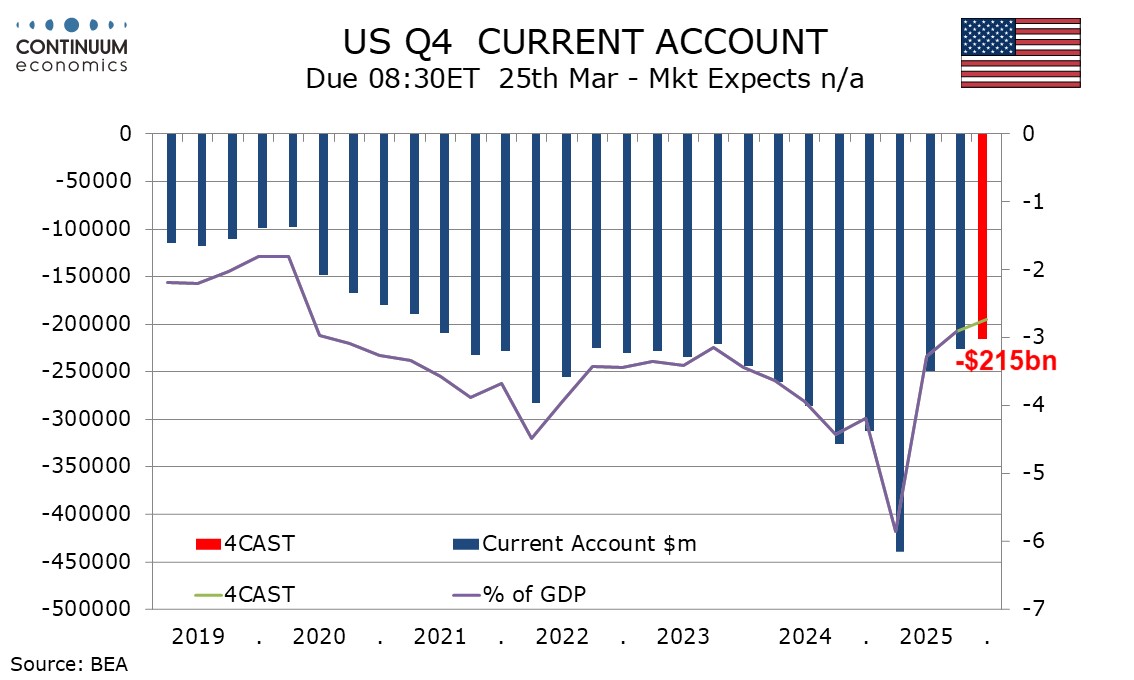
We expect a Q4 US current account deficit of $215bn, down from $226.4bn in Q3 and the narrowest since Q1 2021. As a proportion of GDP the deficit would be 2.7%, down from 2.9% in Q3 and the narrowest since Q1 2020. The correction from the record $439.8bn pre-tariff deficit in Q1 continues. Monthly trade data on goods and services has already been released through January. The Q4 goods deficit fell to $241.5bn from $265.9bn (revised from $267.4bn in the Q3 current account release). The Q4 services surplus fell to $81.4bn from $86.5bn (revised from $89.1bn in the original Q3 data).
Still to be released are data on primary (investment) income and secondary (unilateral transfers) income. Fed flow of funds data however suggests the former will move back into deficit after a return to surplus in Q3, outweighing a modest narrowing of the deficit in the latter. Still, overall the current account deficit is likely to narrow due to a narrowing of the deficit in goods trade.