FX Weekly Strategy: Asia, March 23th-27th
UK CPI The Calm Before the Storm?
U.S. Q4 Current Account Correction from record pre-tariff deficit extending further
U.S. March S&P PMIs Shows Middle East bringing downside risk
DXY To Remain in Geopolitical Spotlight
For the week ahead
Figure: Headline Moves Sideways?
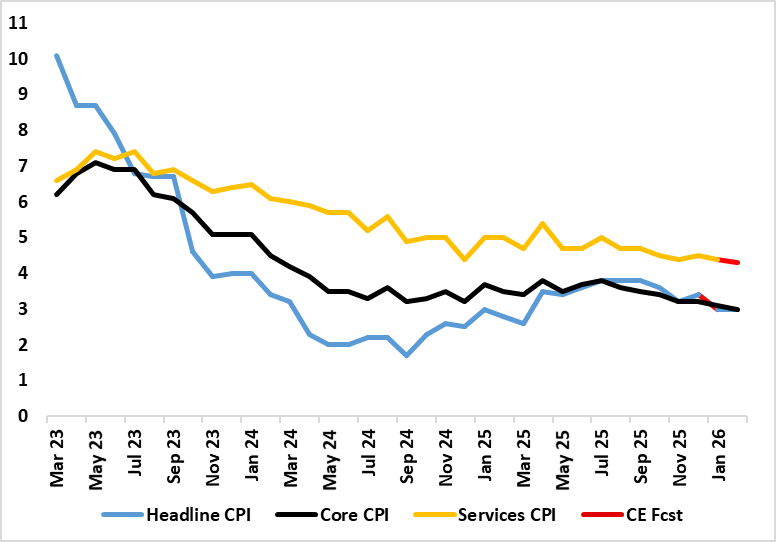
Although most aspects of the January CPI came in a notch above BoE thinking, there was still a clear fall even in the core rate. Indeed, the headline CPI rate fell from December’s 3.4% to 3.0% (a 10-mth low) and we see it staying there is February’s numbers - as do BoE projections. Services and the core rate fell both 0.1 ppt to 4.4% and a new cycle low of 3.1% for the latter and both may edge down further in the next set of data. They will be offset by higher fuel prices, thereby a foretaste of what is to come in coming months as the Middle East conflict spills over. This is all the more notable as declines, if not broad(er) disinflation had been signalled for some time by adjusted m/m data.
Admittedly, not all aspects of the CPI data were reassuring, with a further rise in catering services inflation, often seen as an indicator of price persistence given that the sector’s cost base is very much wage related. Even so, the evidence on this is mixed with HMRC pay data very clearly showing a slowing in wage inflation for accommodation and food services. Regardless there are very clearly reassuring aspects most notable in even lower rental inflation which at just over 3% has more than halved in the last year, surely an added sign that the housing market is in the doldrums. There was also a further slowing in non-energy goods inflation which probably reflects both weak global demand and dumping of goods by China once destined for the U.S.
But the February data will be considered to be old, if not irrelevant, news. But will after the calmer numbers of late provide something of a glimpse of the energy storm ahead, with a jump in in fuel inflation
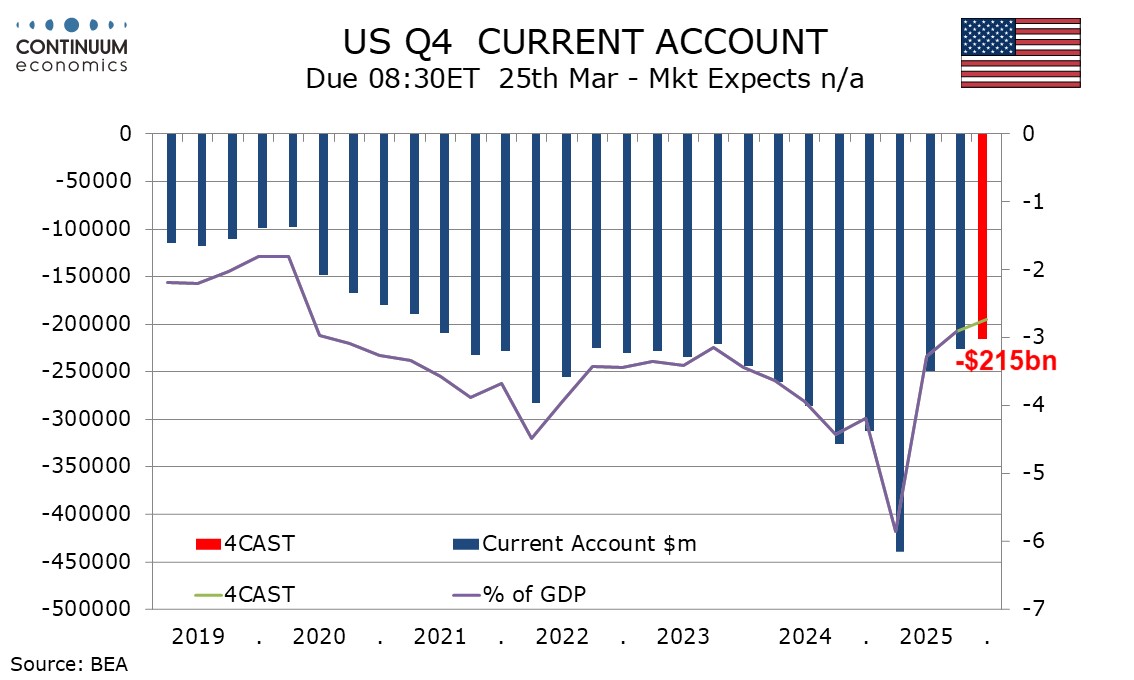
We expect a Q4 US current account deficit of $215bn, down from $226.4bn in Q3 and the narrowest since Q1 2021. As a proportion of GDP the deficit would be 2.7%, down from 2.9% in Q3 and the narrowest since Q1 2020. The correction from the record $439.8bn pre-tariff deficit in Q1 continues. Monthly trade data on goods and services has already been released through January. The Q4 goods deficit fell to $241.5bn from $265.9bn (revised from $267.4bn in the Q3 current account release). The Q4 services surplus fell to $81.4bn from $86.5bn (revised from $89.1bn in the original Q3 data).
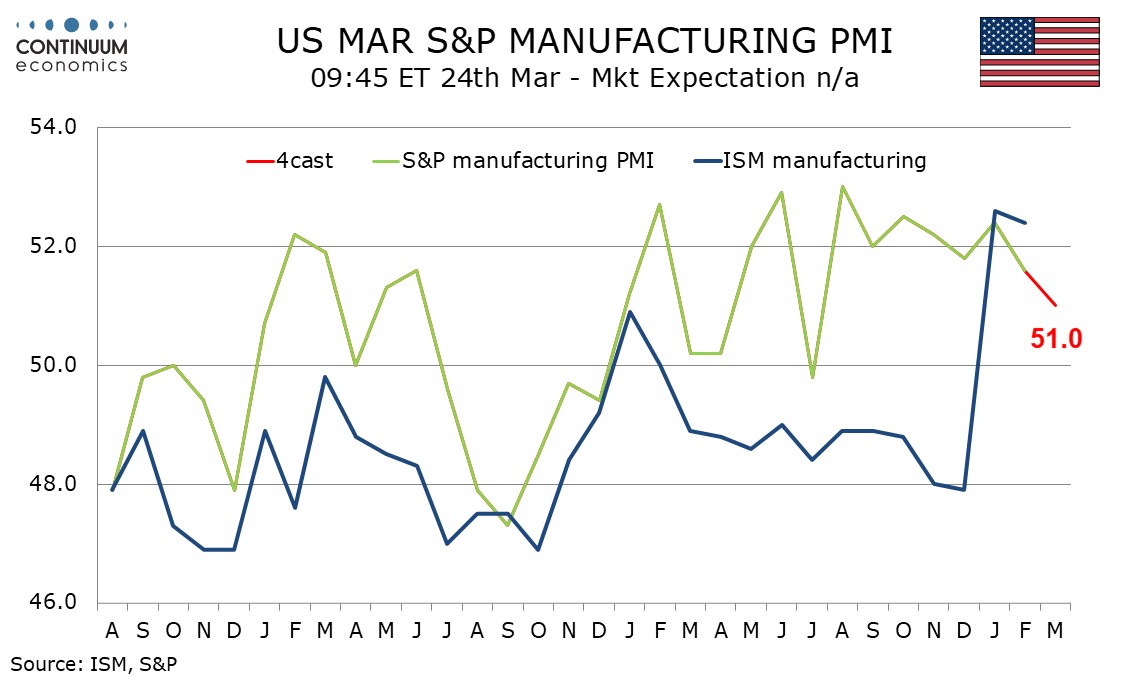
We expect slippage in March’s S&P PMIs, with manufacturing and services both falling to a marginally positive 51.0, from 51.6 and 51.7 respectively in February. The S&P manufacturing index was positive through most of 2025 but may now be peaking. The situation in the Middle East is a downside risk though signals are mixed, with the Empire State index slipping in March but the Philly Fed’s increasingly strong. January and February both saw preliminary indices weaker than the final, which also hints at downside risk for preliminary March data.
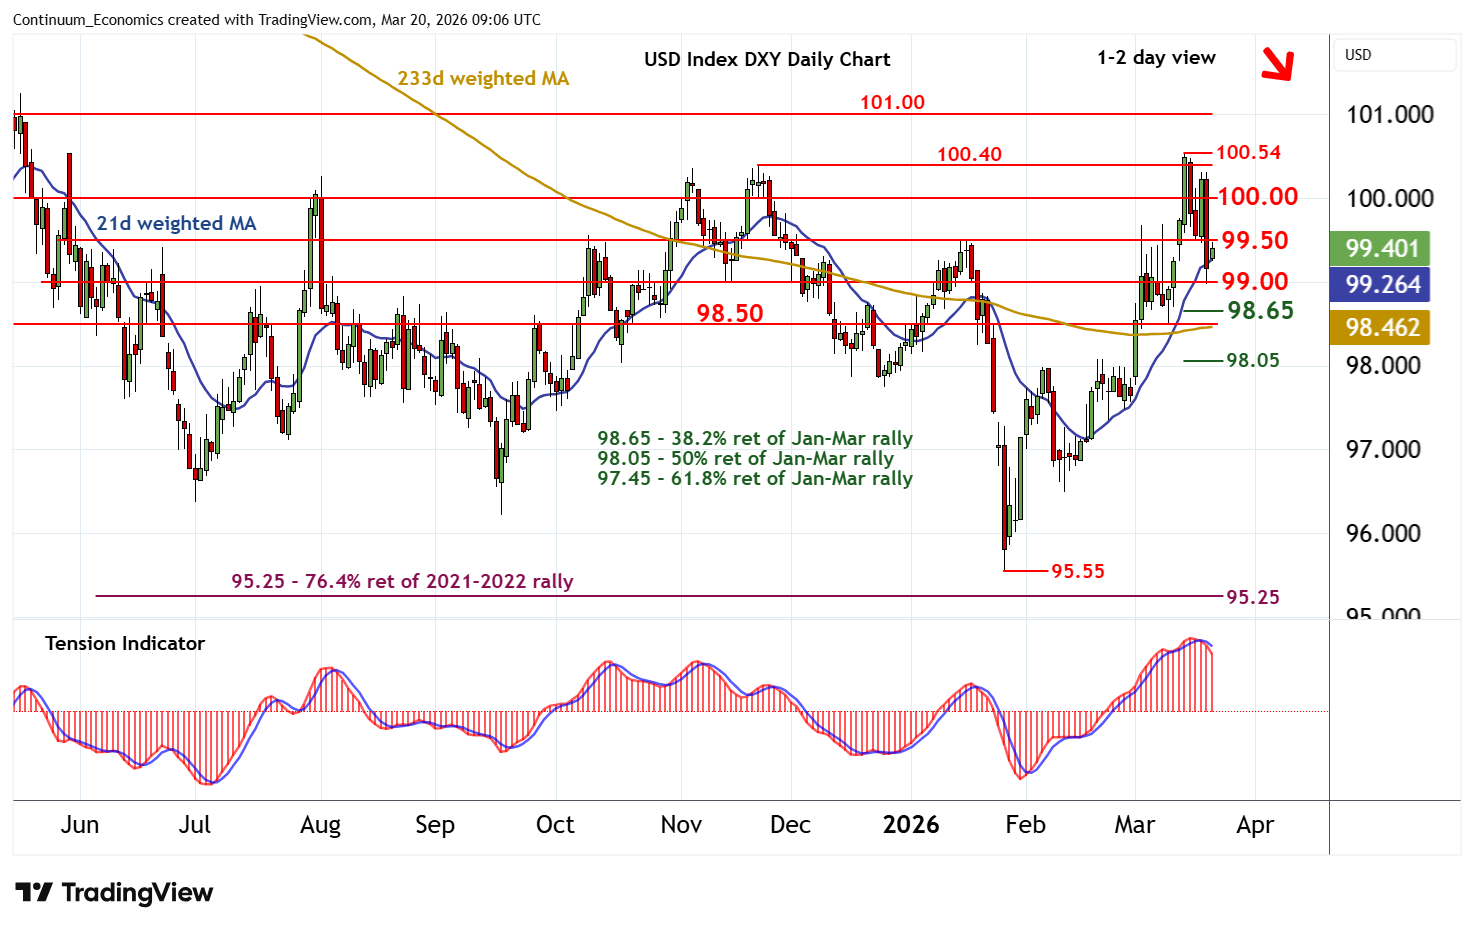
Geopolitical tension will likely remain in the spotlight for next week, if not coming weeks. And the haven bids for USD will be as well. The ebbs and flow of haven bids/offers have seen the USD being more volatile than normal and dominate in major FX pairs. It is hard to see it act differently in the new week but one can be ensured no one would like to be caught wrong footed, thus position maybe shallow.
On the chart, cautious trade around 100.00 has given way to a sharp fall, with steady selling interest reaching congestion support at 99.00 before settling into consolidation within the 99.00 - 99.50 range. Daily readings have turned down, highlighting room for continuation beneath 99.00. But rising weekly charts should limit initial scope in short-covering/consolidation towards strong support within further congestion around 98.50 and the 98.65 Fibonacci retracement. Meanwhile, resistance is lowered to congestion around 99.50. A close above here, if seen, would help to stabilise sentiment and prompt consolidation beneath further congestion around 100.00.
Recap for the week
Slate of Central Banks
Figure: Fed March Summary of Economic Projections (SEP)
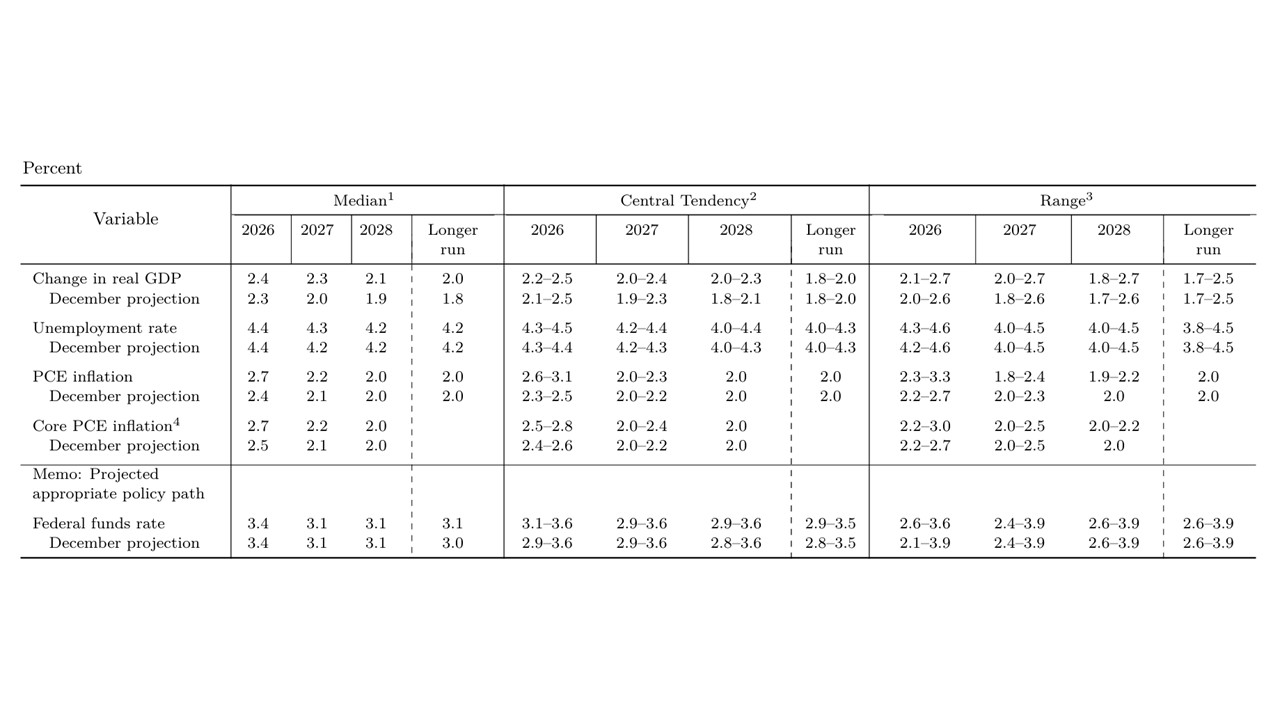
The FOMC dots still pointed towards further rate cuts and Powell left the door open – noting it was too early to make judgement on the economic effects of the Iran war. We feel that the Fed is too optimistic about consumption and thus GDP, given that employment growth is close to zero and aggregate wage growth for the economy will be modest. On the Iran war our baseline remains for a 4-6 week war followed by a decline in WTI towards USD65-70 by end 2026. This can allow the Fed to look through the temporary impact of oil prices in March-April and deliver 25bps cut in September. Fed Warsh will also argue that current productivity is high and can argue for lower medium-term inflation and allow rate cuts and on the margin can be enough to help deliver the 2nd cut in December rather than Q1 2027. We would then see a pause throughout 2027.
Figure: Bank Rate and Financial Conditions Diverge (% and level)
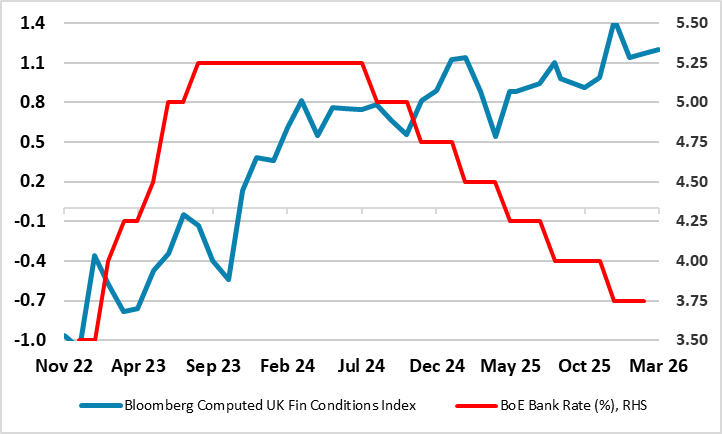
Very clearly, the BoE kept rates on hold with no dissents as it understandably waits for more information about the length, breadth and repercussions of the Iran war. The individual MPC member statements (as expected) showed diverging views as to the extent and reaction of what are now unfolding risks. But the MPC at least put to one side, the previous easing bias which pointed to further easing, instead reviving a more neutral stance, being ‘ready to act as necessary to ensure that CPI inflation remains on track to meet the 2% target in the medium term’. The MPC minutes made clear that this is symmetric that policy may have to be more or less restrictive depending on the economic impact. What is notable is that this energy shock is justifiably viewed as being different to that of 2022, occurring at a point when the economy is operating with a margin of spare capacity. We think this very much reduces the chances of second round effects.
Figure: ECB Projections Revisions
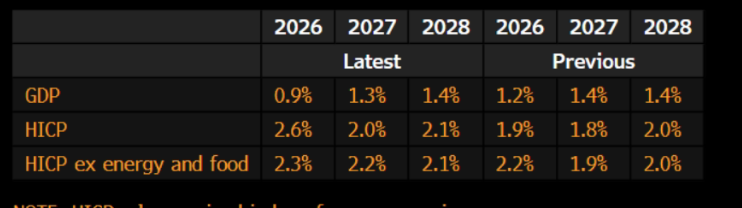
With no change in policy expected and this being delivered unanimously, the ECB underlined its determination to ensure that inflation stabilises at the 2% target in the medium term. Unsurprisingly, it stressed how the Middle East conflict has made the outlook significantly more uncertain, creating upside risks for inflation and downside risks for economic growth. But is seemed to put more stress on there being a material impact on inflation through higher energy prices in the near-term but the medium-term implications depend both on the intensity and duration of the conflict. It did provide updated forecasts based on market thinking up to Mar 11 which we think are too pessimistic about inflation and too optimistic about growth. But given an updated profile in which its underlying focus on core inflation gradually eases back to target we think market rate hike thinking is very overblown. After all, it has eased policy for some time with the core rate much higher!
Figure: Riksbank Alternative Scenarios
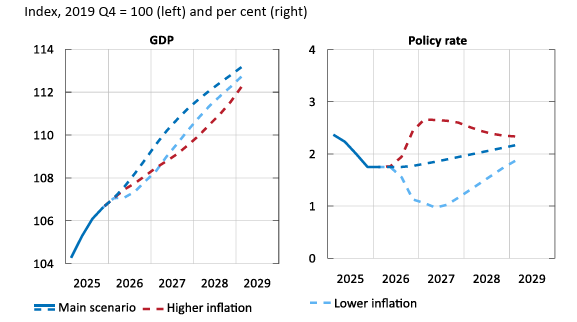
Surprising hardly anyone, the Riksbank (again) kept policy on hold with the key rate left at 1.75% it latest verdict. However, what was more important was if and how the Board changed its rhetoric. In this regard, it repeated its assertion of no change for some time to come but qualified it somewhat by noting that amid Middle East conflict making the forecast very uncertain, it would adjust monetary policy if the outlook for inflation and economic activity so requires – this presumably suggesting a move in either direction. Indeed, in its scenario analysis it has an outlook of a more significant fall-out from the war causing higher inflation requiring higher rates and an alternative in which rates need to be eased further due to lower inflation. The bottom line is it in justifiable wait and see mode with its central policy scenario unchanged from that of three months ago.
Figure : SNB CPI Inflation Projections
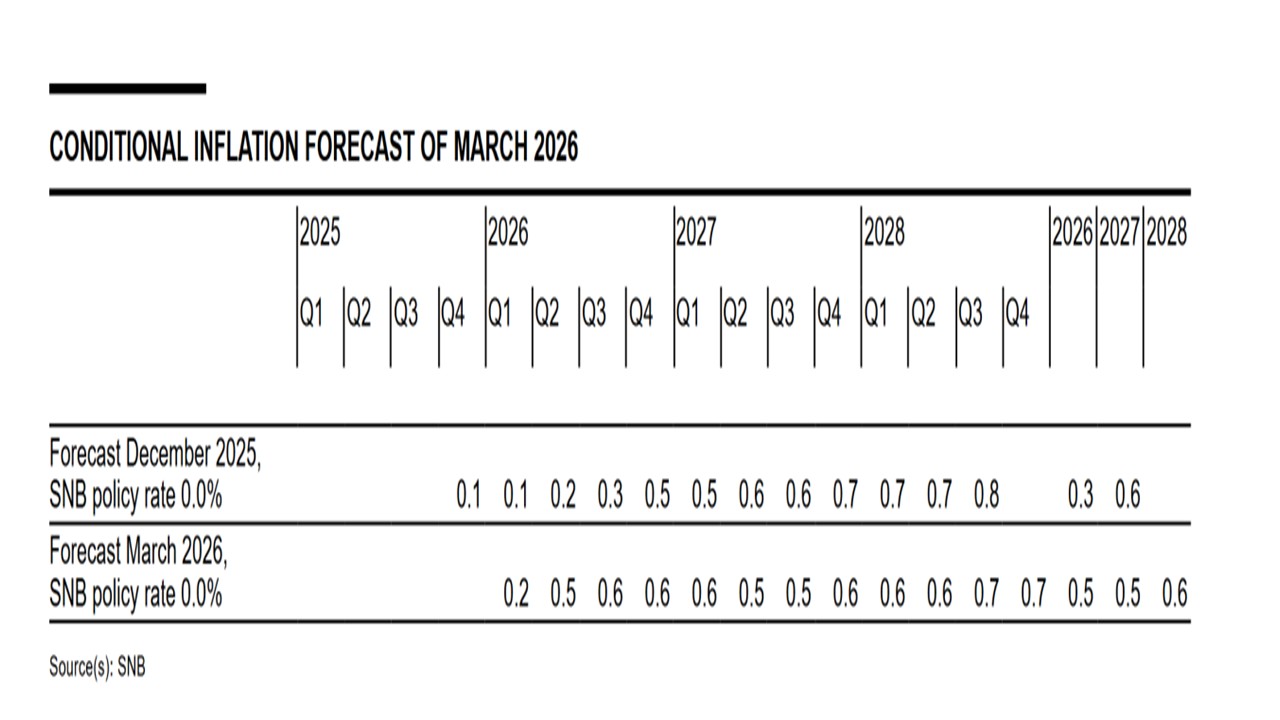
The SNB maintained the policy rate at zero, with a 0.2% increase in 2026 CPI due to the Iran war but 2027 0.1% lower at 0.5% due to CHF strength since the December meeting (Figure). The emphasis in the statement on guarding against the disinflationary risk from more CHF strength suggests that the easing bias remains in place, as a tool against more substantive CHF strength. However, the bar to actually cut rates is higher given the uncertainty over the Iran war and we forecast no change in policy rates in the remainder of 2026.
The RBA has increased the cash rate to 4.1% in the February meeting with a 5-4 vote. Apart from the pick up in underlying inflation since H2 2025, the RBA also believed the Middle East conflict driven high oil price will translate into rising inflation. With inflation risk tilted to the upside, the RBA is being vigilant to hike rates.
The uncertain global outlook has made the RBA more dynamic without a preset rate path. Data dependency remain the forward guidance. While there is no official revision, the RBA will likely revise their inflation forecast higher in the next meeting, unless there is swift resolve in the Middle East. There is also a slim chance we will be seeing more than one hike in 2026 if the RBA sees inflation to be higher on geopolitical tension.
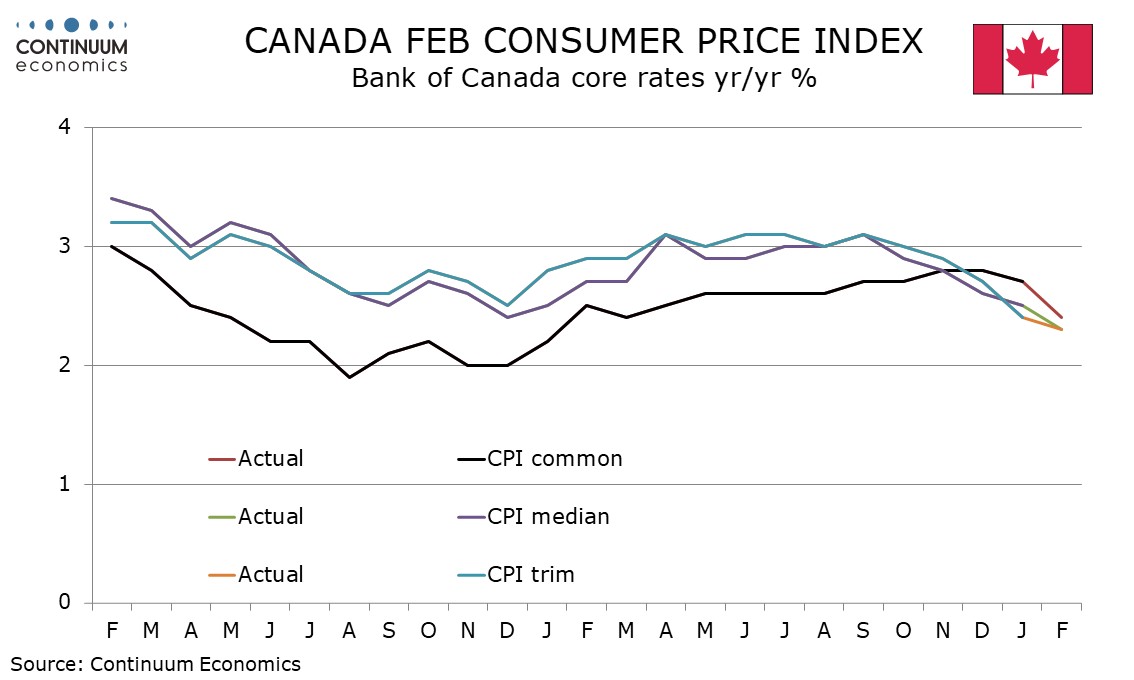
The Bank of Canada left rates at 2.25% as expected, but with uncertainty heightened still further removed from its statement a reference to the current policy being appropriate provided the economy evolves as expected. Uncertainty on policy has increased too. However, the BoC has taken a more dovish view of the Canadian economy, and we no longer expect the BoC to tighten this year.
Even in January the BoC stated that uncertainty was heightened, with US trade policy then its main sources. Governor Macklem stated the Iran war has added a new layer of uncertainty, with its breadth and duration seen by the BoC as highly uncertain. The BoC did downplay a weaker than expected 0.6% annualized decline in Q4 GDP, seeing that as largely due to inventory depletion, but added that recent data suggests than near-term growth will be weaker than anticipated in January. With both January and February having delivered significant declines in employment, they noted that the labor market remains soft, showing that the downgrade on the economic view comes from recent data not risks generated by the war.