UK Labor Market – How Much Slack?
Even the BoE has acknowledged that the UK economy is developing slack and the continued trend rise in activity rates will only serve to reinforce the impression of a labor market that is not so much less tight but decidedly getting looser. As a result, pay pressures seem to be receding (Figure 1) and somewhat faster that BoE projections with private sector regular pay down to 5.6% on the official measure and could be down to nearer 4% in the next few months if the recent slower pace of growth persists. The latter will depend mainly on employment but how this is faring is open to question given the data collection shortcomings in official data but where there is evidence that labor cost consideration are derailing employment is many sectors (Figure 2). Moreover, the continued strong but volatile gains in official data still look suspect as the BoE has repeatedly noted. But we think that the BoE is still too optimistic about the jobs backdrop (Figure 3) – and outlook and that this has helped ferment the wage worries that dominate the thinking of the MPC hawks.
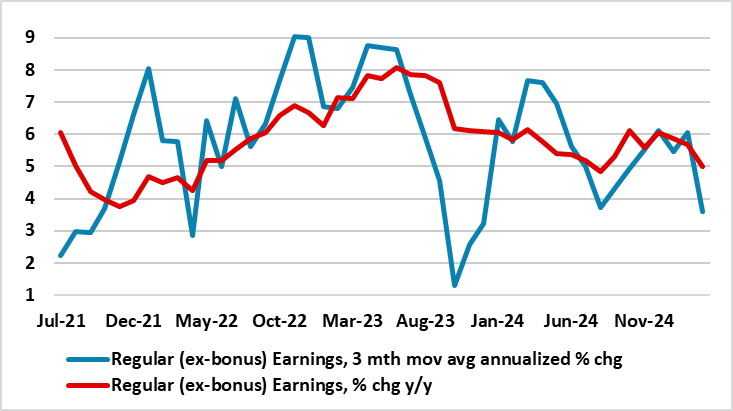
Figure 1: Softer Wage Pressures Emerging
Source; ONS, CE,
Is Pay Growth Buckling?
Policy-making is fraught with difficult decision making. But in the UK, such decisions are made all the more problematic given inconsistencies, if not conflicts, in the data backdrop, thereby making any reading of the economy all the more subjective. Is employment and wage growth rising or falling, and if as we suggest it is the latter, then recent GDP strength looks all the more suspect. Regardless there are increasing signs that wage pressures are abating, this important to the BoE even though labor costs will have little to do with the likely CPI surge April data may show. Indeed, official earnings data were weaker than both consensus and BoE expectation in just-released March data, with the single-month y/y rate for private sector regular pay down to 5.0%. This is still too high to help ensure inflation returns and stays at target but the recent slower pace evident in the last few months of data (Figure 1) could see earnings growth a further ppt lower within 2-3 months. Thus would reflect (at least partly) efforts by employers to limit labor costs already pushed higher by the recent leap in National Insurance Contributions.
The Labor Market is Working as it Should
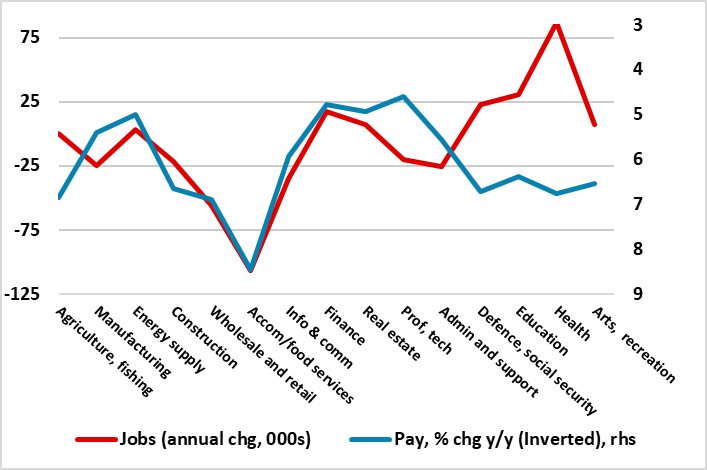
Indeed, and possibly in anticipation of looming labor costs rises, vacancies are clearly falling. The National Insurance changes that took effect last month mirror similar moves previously (eg 2022, 2011 and 2003). What happened then is that labour intensive sectors and other service-based sectors reduced both headcounts and vacancies either in anticipation or immediately after the change was effective. This already seems to be happening this time around, but possibly as much to already rising pay bills as to the threat of even higher labor costs to come. Indeed, as Figure 2 illustrates, the labor market is working as it should do, with sectors where pay is the highest seeing falling payrolls as companies try to adjust to already high pay bills by curbing jobs to limit the rise in labor costs that otherwise would either/both hit profit margins and raise the prospect of higher consumer prices. The exception is the public sector, but, amid fiscal strains, are under threat too, compounding what has been an ever clearer haemorrhaging of jobs in private services.
Figure 2: Sectors Facing Highest Pay Growth Seeing Clearest Job Shedding
Source; ONS, HMRC
Jobs; Growing, Falling or Moving Sideways?
Despite some repair work having been completed by the ONS in regard to its suspect labor force survey (LFS), reservations about its accuracy persist, not least as it is volatile and the job gains it points conflict with alternative data sources. Indeed, the BoE noted its recent Monetary Policy Report that underlying employment growth is judged to be somewhat weaker currently than implied by the LFS estimate. In view of this, it has estimated a new statistical model that information from a broad array of survey measures of employment growth. This new model suggests that underlying three-month on three-month employment growth softened to around 0% at the start of 2025, some half a ppt lower than the LFS numbers. But are these model results still too optimistic?
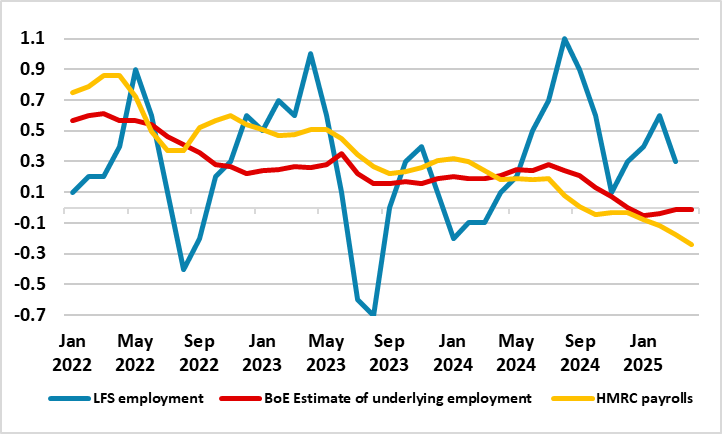
Alternative and very clearly authoritative data on payrolls suggest this is the case as the show that private sector employment is continuing to contract, and possibly much more clearly in these April numbers. Indeed, these payroll data produced by the HMRC, have now show seven m/m falls since the level of payrolls peaked eight months ago and with an annual fall of 0.5%. In fact, the drop is over twice that in terms of the private sector, making this is a marked contrast to the 1.9% increase official employment data and/or the smaller rise that the BoE suggest has occurred in the last year. Moreover, as Figure 3 illustrates, the HMRC data suggest that the rate of job contraction is intensifying and diverging rather than moving sideways as the BoE suggests.
Figure 3: A Tale of Three Job Markets?
Source; ONS, BoE, HMRC, 3mth on 3mth % chg
This is one the main reasons why we think he BoE is too concerned about the overall and particularly wage inflation outlook as (to us) we see companies in the private sector are already acting to rein in their labor cost bills for fear that raising prices may only serve to reduce demand. The UK economy and especially the labor market is seeing increasing slack emerge!