FX Daily Strategy: Asia, March 31st
Short vs Long Iran War
EZ Headline HICP to Surge but Core to Slip Back
Figure: Iran War Scenarios and WTI Oil Price Projections
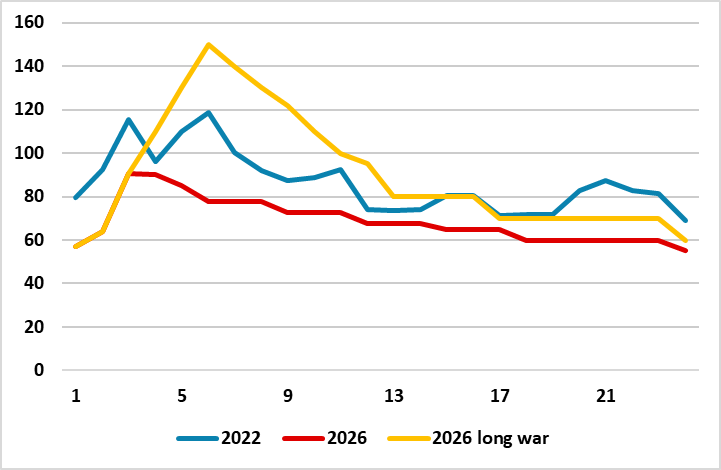
For a 4-8 week war and 3-4 quarters of energy price normalisation, we see a 10% U.S. equity market correction in H1 2026 driven by the current Iran war and/or consumption slowing due to lower (real) wage growth, alongside still stretched valuations in equity and equity-bond terms. Then we see this being followed by a H2 2026 rebound on Fed easing that brings the S&P500 to 7200 by year-end 2026. 10yr U.S. Treasury yields down to 4.0% by end 2026 and EUR/USD at 1.24.
For a 2-6 month war scenario a number of issues impact the macro and policy outlook. Firstly, whether the post war period could involve limited/partial or full Straits of Hormuz shipping. Issues 2-5 are labor market tightness/global supply pressures/consumption patterns and new fiscal support and stimulus. We feel that all four of these in either scenario would be less than during the 2022 Ukraine war and could dampen rather than amplifying inflation pressures. This could restrict DM 2026 policy tightening in this scenario and mean 2027 rate cuts!
U.S. equities would see a stagflationary hit via pressure on corporate earnings/valuations and the Fed not being able to cut initially. This could produce a deeper correction to 5500-6000. However, genuine fears of a mild recession would be needed for larger multiple deratings and more prolonged selloff. 10yr U.S. Treasury yields could reach 4.50-4.75% with USD150 oil prices. However, U.S. real yields are reasonable and this should be a restraint to the scale of a U.S. yield rise. Any more aggressive U.S. equity selloff, plus signs of a hard landing, would likely fuel a rush into U.S. Treasuries. If the Fed shows sensitivity to the slowing economy, then this could drive 10yr yields down to 3.50%. USD could initially go higher on USD150 oil prices, but then get whipsawed if U.S. equities see a deep pullback/bear market and the Fed eases on the economy. Higher yielding AUD and NOK are our favourite safe havens.
Figure: Headline Sharply Higher, Core to Fall?
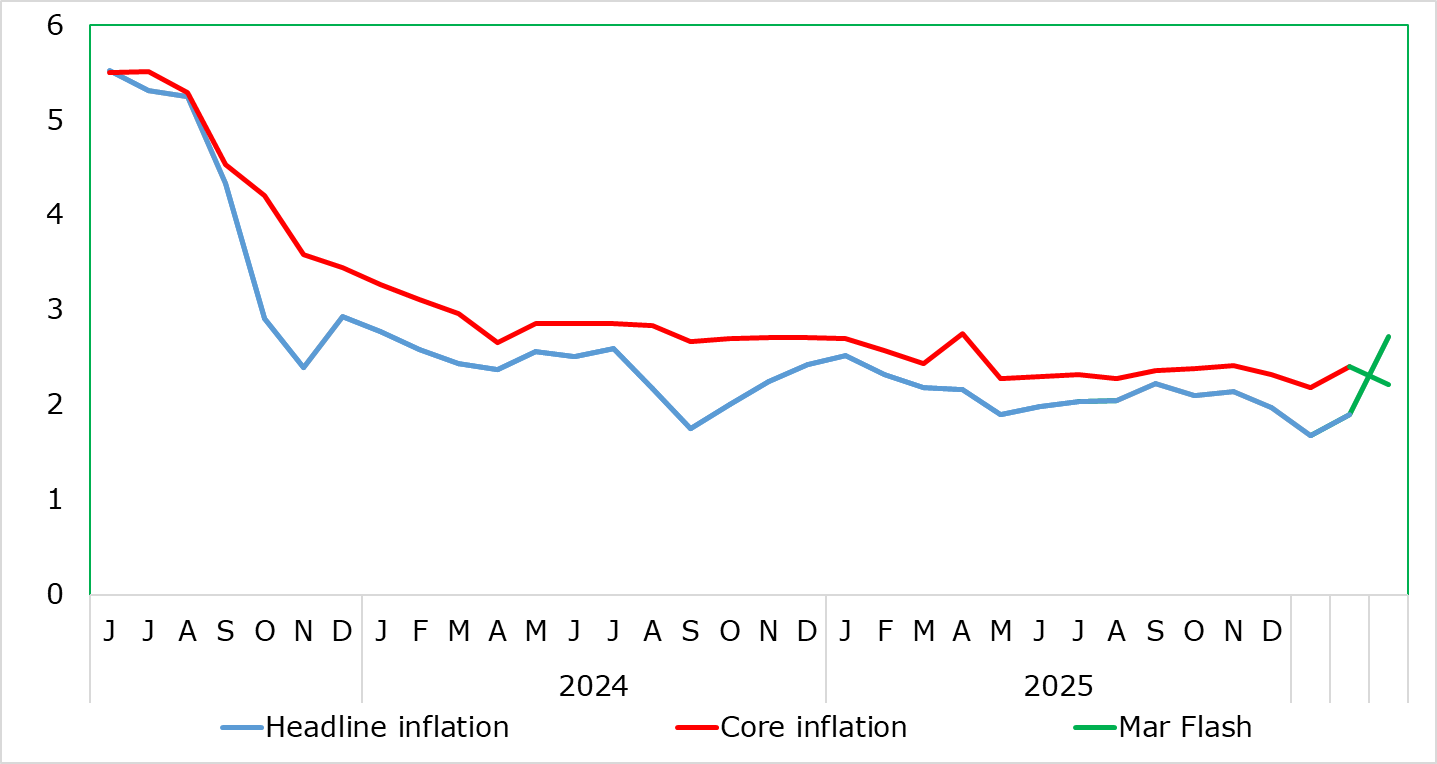
The first of the Iran War induced rise in prices arrive in the coming week with flash March HICP data. We see the headline rate spiking higher to 2.6%-2.7 from February’s 1.9%, the former largely chiming with that implied ECB thinking from the latter’s recent updated projections. But both it and ourselves see the core rate falling back in March regardless as this March surge will be purely energy-led. But with us seeing more real economy damage which together with tight(er) financial conditions we do not see the HICP rising as much as the ECB envisages beyond this quarter, albeit we do concur that the headline may be back below target by mid-2027. Thus we see the peak in HICP inflation just under 3% around mid-year. We accept risks – but on both sides but with those on the upside for inflation being possible price gouging (ie over-charging) given the manner in which the likes of heating oil prices have soared!
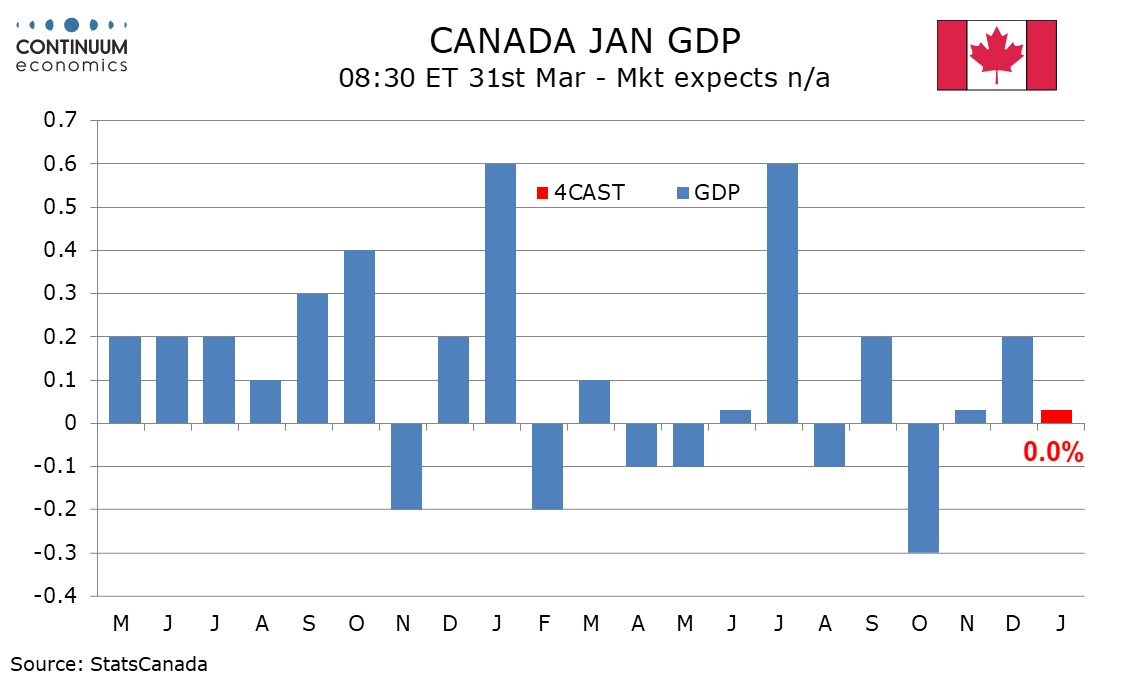
We expect January Canadian GDP to be unchanged in line with a preliminary estimate made with December’s data. We expect a positive preliminary estimate for February of around 0.2%, though Q1 is still likely to fall short of a 1.8% annualized Bank of Canada forecast made in January. We expect January GDP to show services increasing by 0.2% for a third straight month with retail positive but wholesale weaker. Goods are likely to be restrained by a negative in manufacturing and a correction lower in utilities. Goods are more volatile than services which may better represent underlying trend.
This suggests an increase of around 0.2% is likely for February. March could see some downside risk from higher gasoline prices. If March rises by 0.1% Q1 would increase by around 1.0% annualized. The BoC has already recognized that the economy is underperforming its expectations from January. Canada is less vulnerable to the oil shock than most countries with domestic oil output likely to get a lift, though the positive impact would be concentrated in Alberta with most provinces taking a hit.