FX Weekly Strategy: August 19th - 23rd


U.S. Preliminary Q2 GDP still Marginally stronger
PCE prices a close call between 0.1% and 0.2%
And a slate of other U.S. Data for the week
Along with Germany and EZ Inflation
Canada GDP a second straight quarter of moderate growth
Strategy for the week ahead
U.S. Preliminary Q2 GDP still Marginally stronger
PCE prices a close call between 0.1% and 0.2%
And a slate of other U.S. Data for the week
Along with Germany and EZ Inflation
Canada GDP a second straight quarter of moderate growth
The USD fell noticeably across the board in North America after Fed chair Powell signalled a September rate cut and did not rule out 50bps rather than 25bps. U.S. bond yields fell. The sense is that the Fed could act quicker than other G10 central banks in the coming months, which can persistently hurt USD sentiment. Thus though the ECB is widely expected to cut in September, the next move is not expected until December and this has helped EUR sentiment versus the USD. We look for a move to 1.1275 on EUR/USD in the coming week. Focus also on whether USD/JPY builds further momentum towards 142. Moves beyond these levels would really require big news. This is unlikely on the data front before August U.S. employment on September 6. Another catalyst would be the U.S. equity market falling, with Nvidia results, but the mood in U.S. equities look reasonable still.
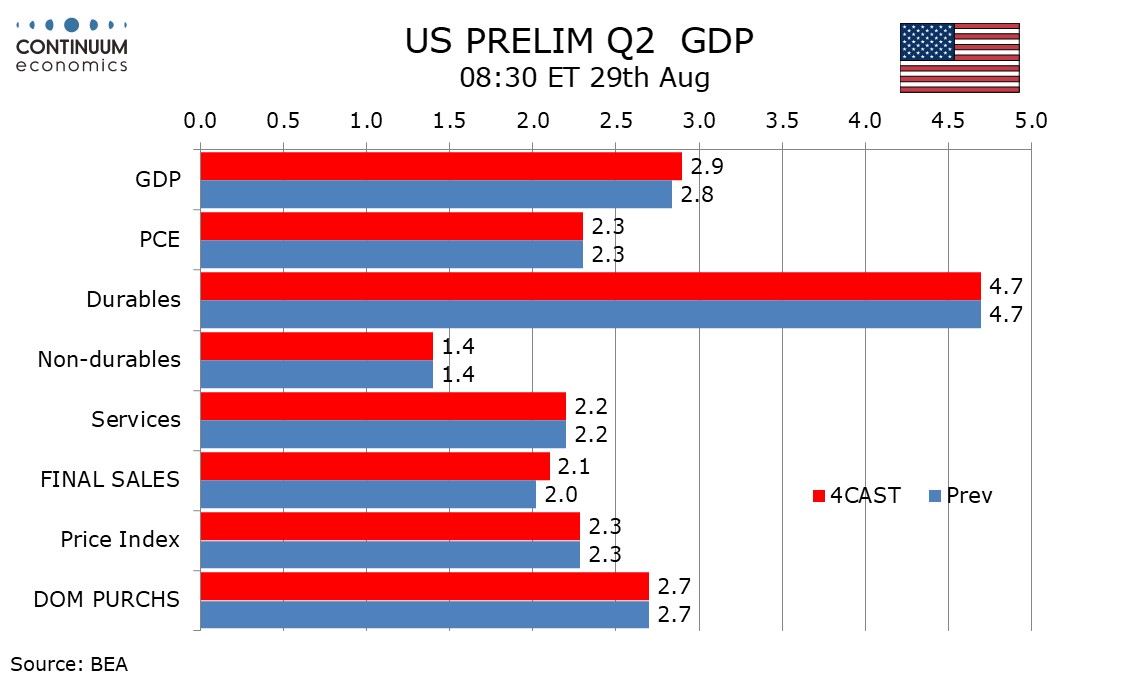
We expect the second (preliminary) estimate for Q2 GDP to be revised marginally up to 2.9% from an already strong first (advance) estimate of 2.8%. The revision will be led by private sector construction spending, both residential and non-residential. We expect public sector construction to be revised marginally lower. We also expect a small upward revision to exports and a small downward revision to inventories. We expect final sales (GDP less inventories) to be revised up to 2.1% from 2.0% but final sales to domestic buyers (GDP less inventories and net exports) to be unrevised at 2.7%.
We do not expect any revisions to the price indices, from 2.3% for GDP, 2.6% for overall PCE and 2.9% for core PCE.
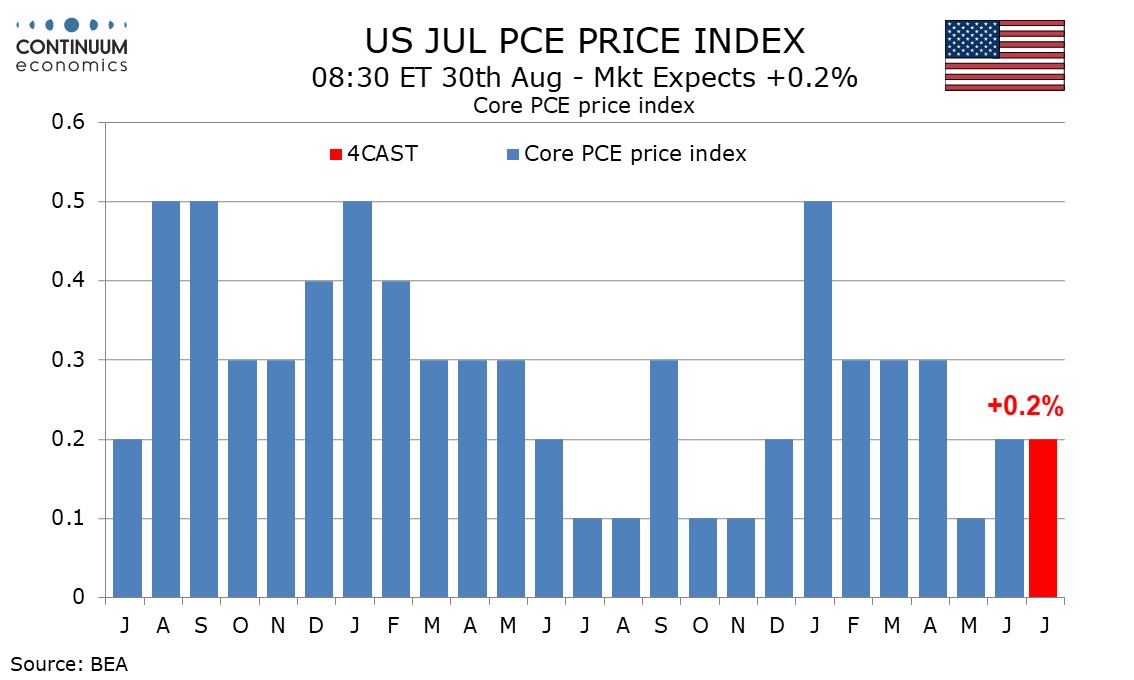
We expect July core PCE prices to be consistent with the core CPI, up by 0.2% but a little less before rounding. We expect a healthy 0.5% rise in personal spending to outperform a subdued 0.1% increase in personal income.
The core PCE price index is a close call between 0.1% and 0.2%. We expect overall PCE prices to rise by only 0.1% despite a 0.2% rise in overall CPI, which was also rounded up and closer to 0.15% than the core CPI. We expect the overall PCE price index to be rounded down to 0.1%. The yr/yr overall PCE deflator would then remain at June’s 2.5% pace but the core rate would edge up to 2.7% after two months at 2.6%. A subdued non-farm payroll breakdown, from average hourly earnings and the workweek as well as employment, suggests a below trend 0.1% increase in wages and salaries. Personal income trend elsewhere is weaker than for wages and salaries and we expect overall personal income to also rise by 0.1%. Retail sales saw a strong 1.0% increase in July which might not be fully matched in July personal spending data, particularly from autos which led the retail sales gain. We expect a fourth straight 0.4% rise from services. Spending outpacing income would see the savings rate slip to 3.0% from 3.4%, reaching its lowest since October 2022.
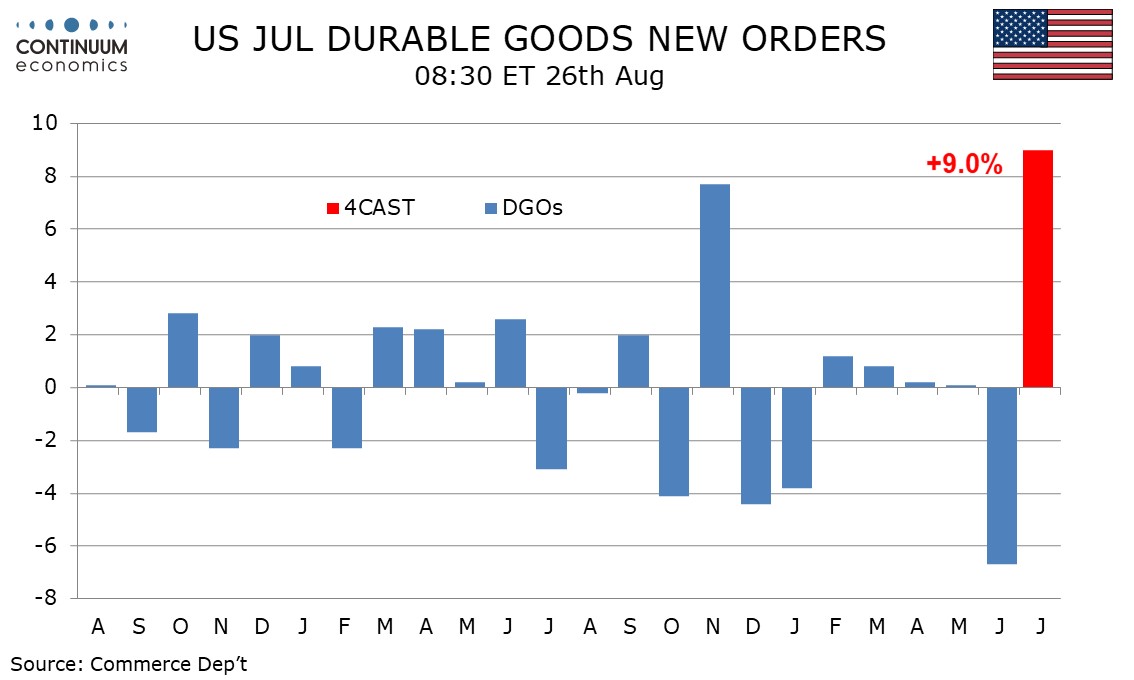
We expect July durable orders to increase by a sharp 9.0% to more than fully erase a 6.7% fall in June with the swings largely coming from aircraft. Ex transport we expect a 0.2% decline to follow a 0.4% June increase. Boeing data suggests an above trend month from aircraft in July. However the main reason to expect a sharp rise in aircraft is that June saw a sharp decline that was exaggerated by seasonal adjustments. Before seasonal adjustment aircraft orders saw a marginal increase but after seasonal adjustment aircraft saw such a large decline that the level was recorded as negative. More normal seasonal adjustments combined with a relatively strong month should deliver a strong rebound in aircraft.
We expect a marginal decline in autos and a correction lower in defense, which has a large overlap with transport, from a strong June. Ex defense we expect a rise of 9.8% to follow a 7.2% June decline. Ex transport we expect a 0.2% decline to correct a 0.4% increase in June. While not always a reliable guide this would be consistent with a weaker ISM manufacturing new orders index after a stronger June outcome. The ex-transport trend is neutral to positive and we have not seen a monthly move in either direction reach 1.0% for over two years. We expect non-defense capital orders ex aircraft, a key indicator of business investment, to fall by 0.3% after a 0.9% June increase corrected a 0.9% decline in May. Trend in this series is also close to flat.
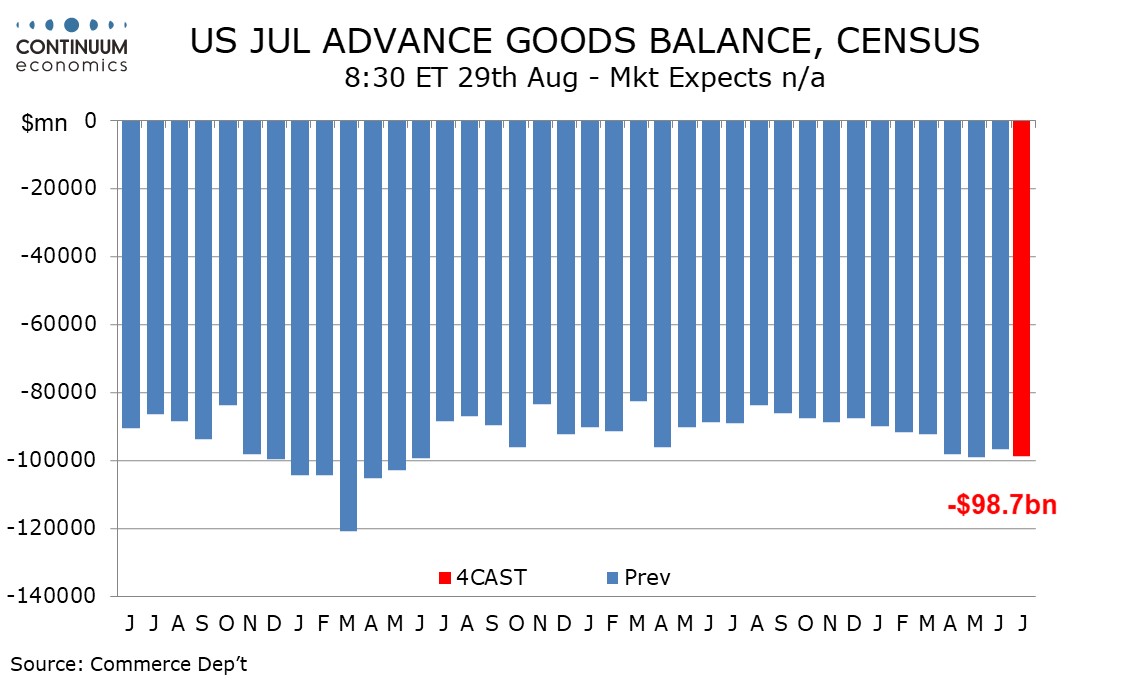
We expect July’s advance goods trade deficit to increase to $98.7bn from June’s 96.6bn, leaving it slightly below the May deficit of $99.1bn which was the highest since May 2022. We expect exports to fall by 0.3% after a 2.7% June increase while imports rise by 0.6% after a 0.8% increase in June. In real terms we expect the deficit to reach its highest level since May 2022 but exports will gain some support from a 0.7% rise in prices, while import prices increased by only 0.1%. Suggesting weakness in exports is a fall in July industrial production, led by autos. Data from Southern California ports suggests increasing strength in imports. Advance July wholesale and retail inventory data will be released with the advance goods trade report, providing further insight on Q3 GDP prospects.
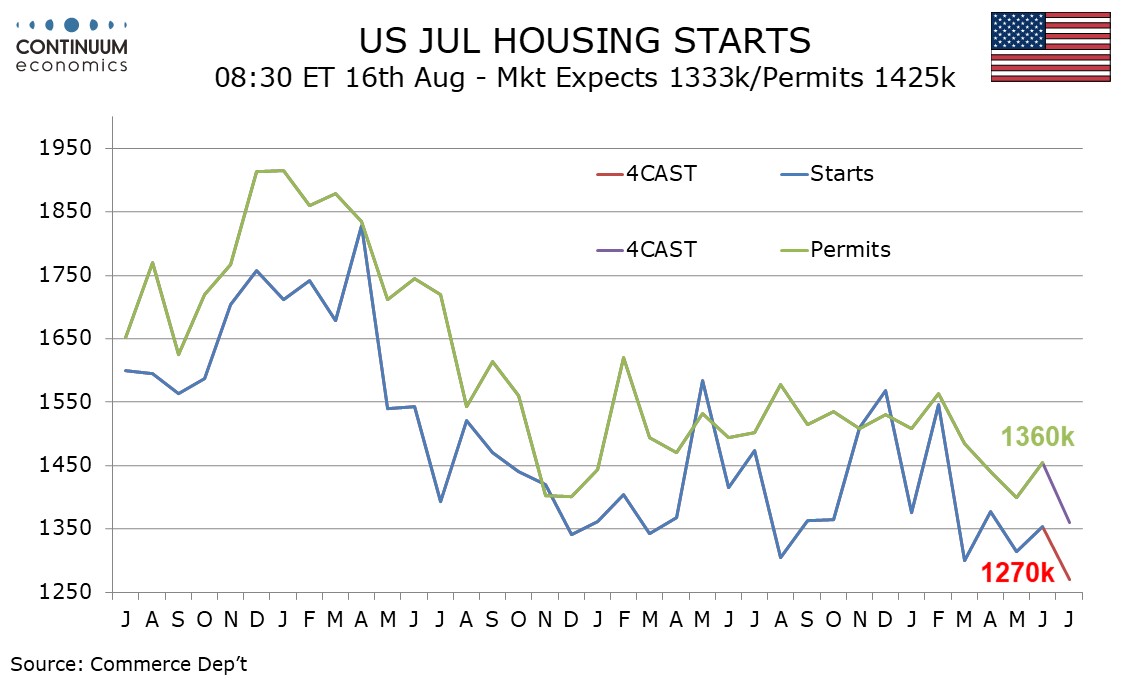
We expect July housing starts to fall by 6.1% to 1270k after a 3.0% increase in June, while permits fall by 6.5% to 1360k after a 3.9% increase in June. June’s gains came fully in the volatile multiples sector.Home sales have been moving lower in Q2 and this is weighing on the underling housing trends illustrated in single starts and permits. We expect single starts to fall by 2.0% after a 2.2% June decline for a fifth straight fall and single permits to fall by 2.0% after a 1.8% June decline for a sixth straight fall. In June the volatile multiples sector saw starts up by 19.6% and permits up by 16.3%. We expect July declines of 16.9% and 14.6%, which would put both series marginally below May’s levels.
Figure: Inflation Less Bumpy?
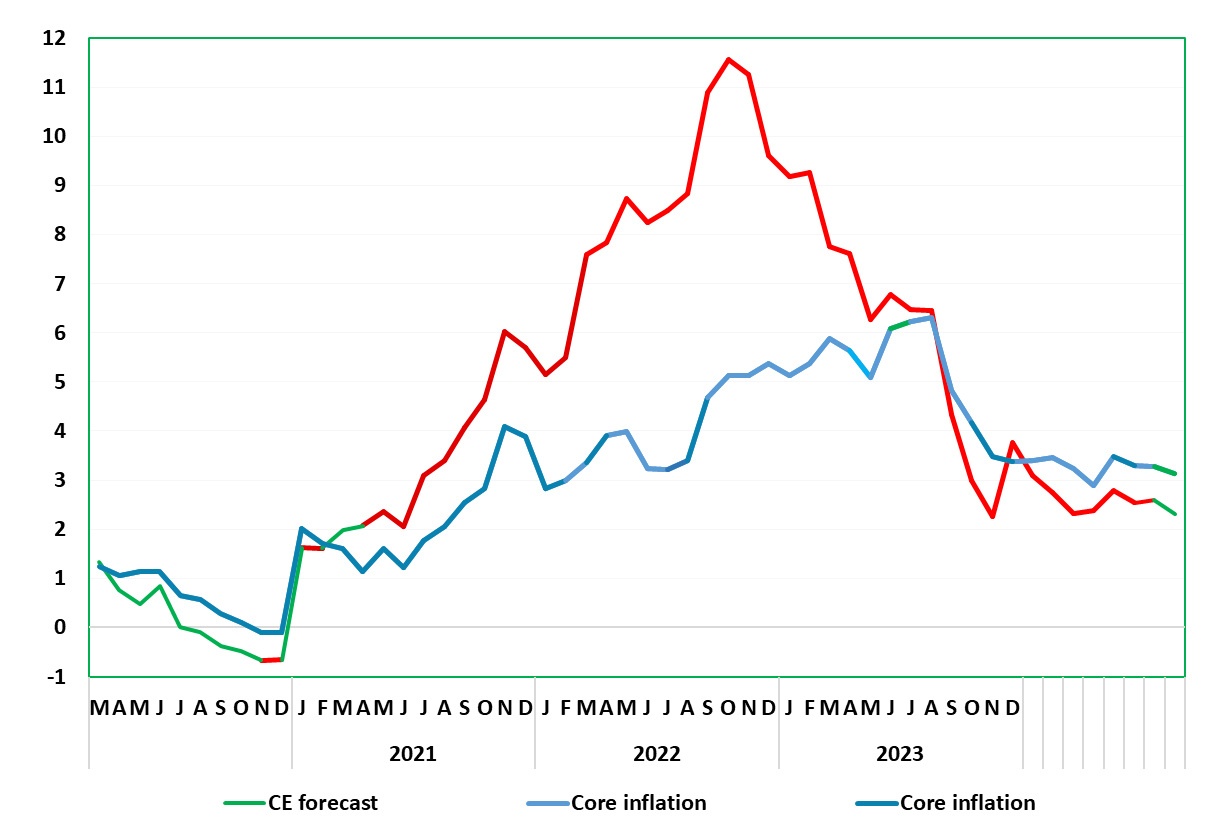
Base effects have caused the German disinflation process not to be smooth and this was even more clearly the case in the July data. This saw the headline HICP rate rise and unexpected 0.1 ppt to 2.6%, unwinding a third of fall seen in June. Details show stable services and core inflation but with less negative energy and slightly higher food inflation causing the higher headline outcome. To what extent both food and services were pushed higher by the European Football Championship is unclear, with the August numbers providing something of an answer. Helped by lower fuel process we see the headline rate falling to 2.4% and the core down a notch to 3.2%
Figure: Headline and Core to Fall Afresh?
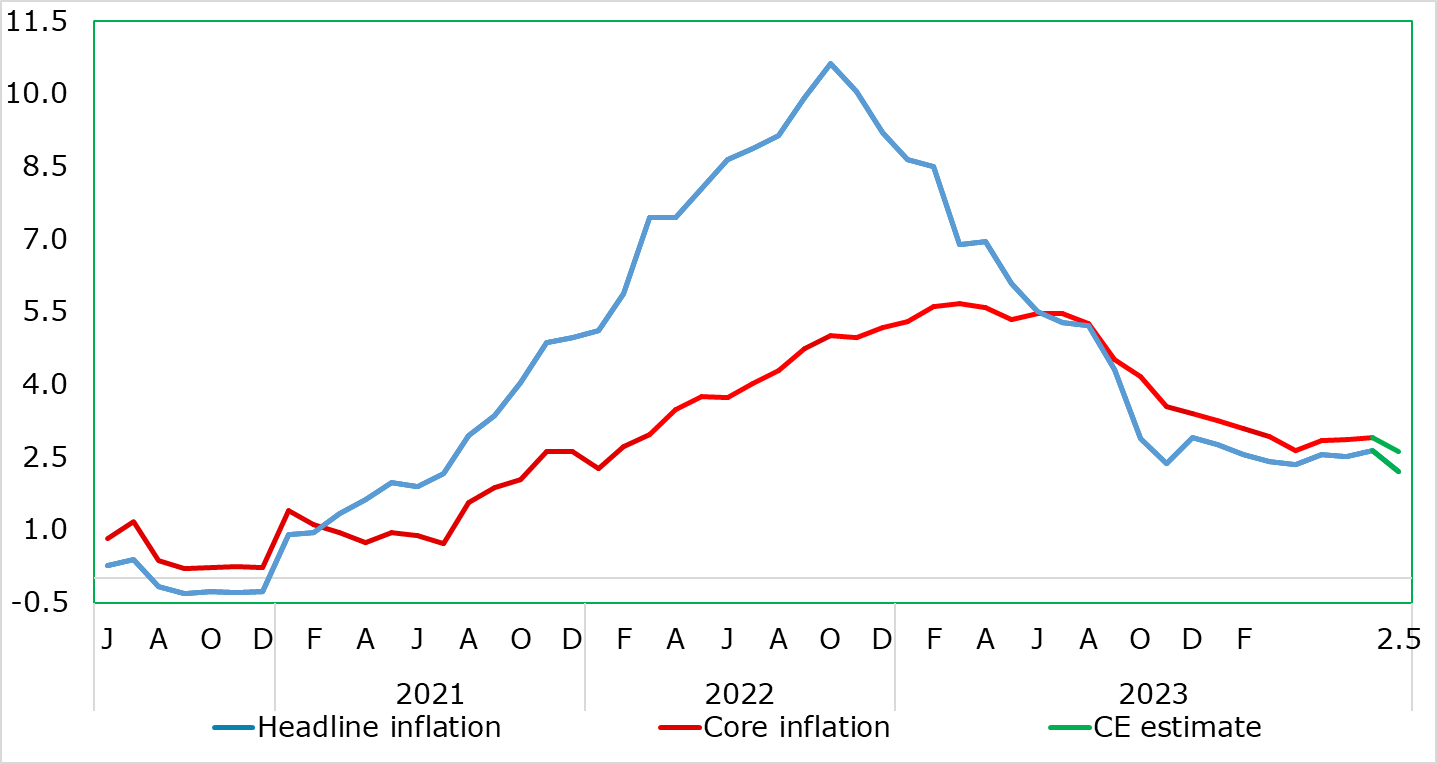
It could be argued that the EZ disinflation process has stalled given that no further drop beyond that to 2.4% in April has occurred. Indeed, somewhat unexpectedly, headline HICP inflation rose a notch to 2.6% in July, reversing the slide seen in June. This is even the case regarding the core rate which stayed at 2.9%, thereby still 0.2 ppt above the April low, with services inflation still showing apparent resilience after slipping a mere notch to 4.0%. But we see abundant signs of the disinflation process in survey data and with the ECB’s own measures of persistent inflation pointing very much to already below target inflation. These considerations are all the more important as the ECB hierarchy have made clear policy will be shaped by an array of data rather than particular data points! Thus it may be important that the August HICP flash sees the headline rate resubmits fall with a drop to 2.3% on the cards ahead of what may be a rate back at target in September.
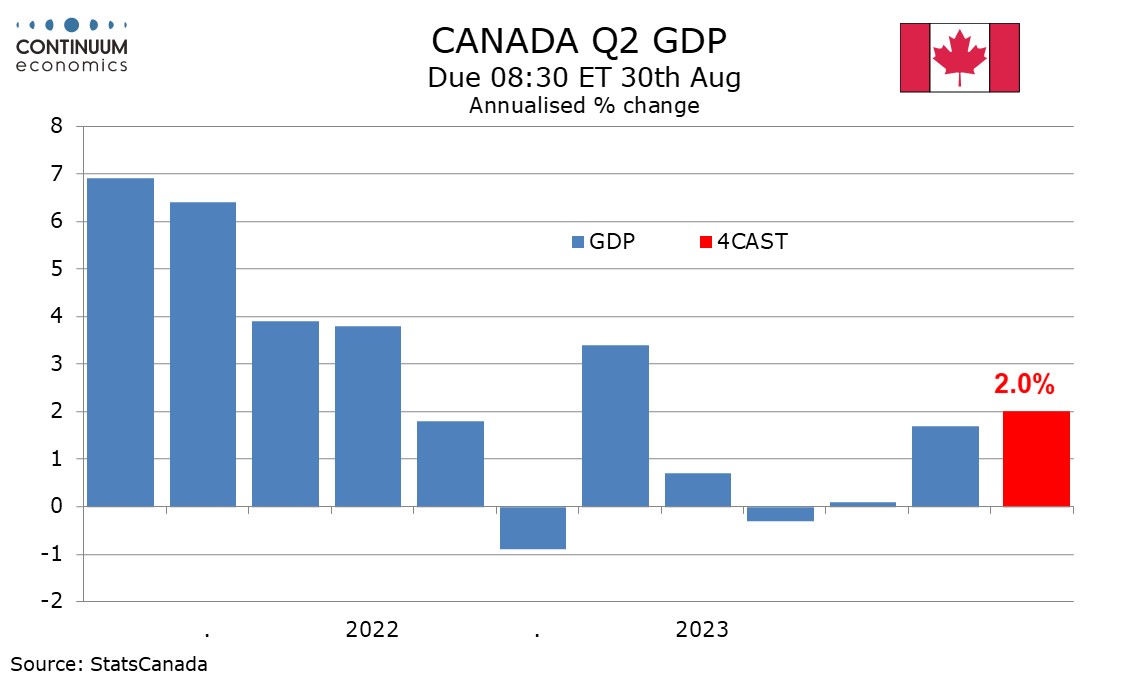
We expect Q2 Canadian GDP to rise by 2.0% annualized, a little above a 1.5% estimate made with the Bank of Canada’s July Monetary Policy Report and s second straight quarter of moderate growth after a near flat second half of 2023. We expect a 0.1% increase in June GDP, in line with a preliminary estimate made with May’s GDP report. We expect domestic demand to also rise by 2.0% annualized, slightly slower than Q1’s 2.9% despite GDP seen marginally accelerating from 1.7% in Q1. We consumer spending also rising by 2.0%, with the gain in investment set to be slightly stronger but government to rise by slightly less. We expect a negative contribution of 0.7% from net exports, with Q2 data showing exports slightly down in real terms but imports slightly higher. We expect the negative from net exports to be offset by a matching positive from inventories, correcting a larger negative contribution in Q1.
Data and events for the week ahead
JP
Tokyo CPI will be the critical release on the Japanese calendar next Friday. The Latest National CPI continue to hover just below 3% at 2.8% with ex fresh food at 2.7%. Our central forecast sees inflation to fall below BoJ forecast and there is no concrete evidence to proof otherwise. Until so, we believe BoJ’s policy forecast is too hawkish.
AU
A rather clear calendar for Australia with only Monthly CPI on Wednesday and Retail sales on Friday worth an eye. RBA has pushed back rate cut expectations on higher inflation in Q2. To see any type of cutting hopes in 2024, we will need to observe moderating CPI closer to 3%. Retail sales could help the market gauge domestic consumption, which show weakness so far in 2024.
NZ
There is business outlook and confidence on Thursday and Consumer confidence on Friday
Recap for the week
Figure: Riksbank Policy Rate (%)
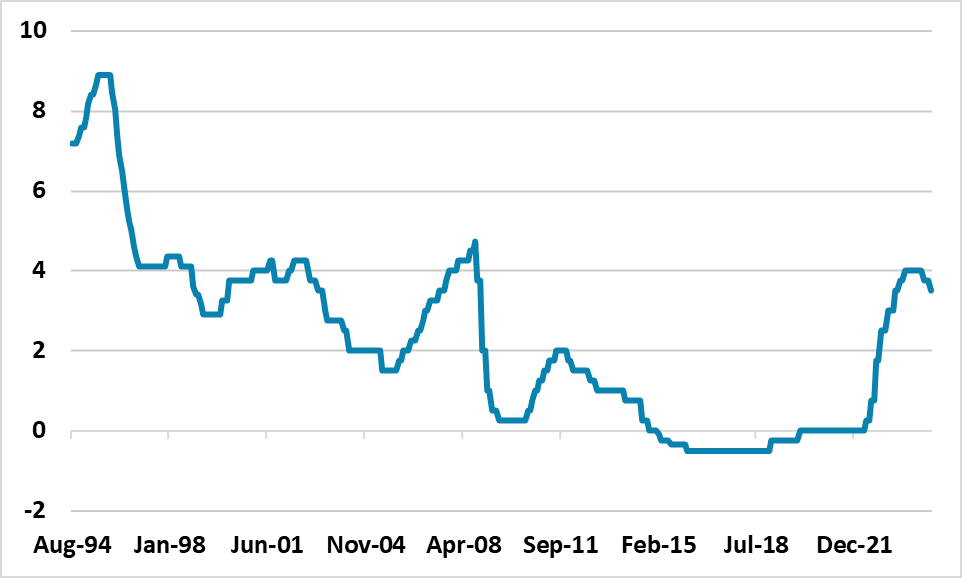
Riksbank appear more concerned about a weak economy, which is causing forward guidance of a faster pace of easing after today’s 25bps cut to 3.50%. We look for 25bps cuts at the September and December meeting and a further 25bps is possible at the November meeting if inflation remains under control and further real sector disappointment is seen.
Though the Riksbank delivered the 25bps cut to 3.50% as expected, the statement indicated that the Riksbank would be looking to cut a further two to three times in 2024 and this is more dovish than June. Key points to note.
· Riksbank concerned about weak economy. The Q2 GDP figures were disappointing for the Riksbank, with the statement noting that the interest rate sensitivity sector of the economy (consumption and investment) have disappointed. Given the quick and strong feedthrough of the Riksbank tightening cycle, it could be argued that the Riksbank are perhaps concerned that they tightened too much.
· Inflation is seen to be under control. Recent inflation numbers certainly increase the confidence that 2% inflation has been achieved, with wage growth under control and corporate profit margins being squeezed by the weak economy. With unemployment now rising, plus sluggish growth, the risk of an inflation undershoot exists and it will be interesting to see new projections at the September 25 meeting.
· Easing more quickly. The guidance has not just shifted to two further cuts, but the potential for three cuts before year-end. We had already projected two further cuts and these will most likely be deliver in September and December when new projections are published. A 3rd cut in November is feasible depending on the real sector data in the next few months and whether CPI surprises on the downside.
· Market pricing three more cuts in 2024. After the statement the money market has moved to now discounting 25bps at the September, November and December meetings. Additionally, further easing is seen in 2025, getting down to a 2.0% in 1 year and terminal policy rate of 1.75%. The Riksbank did not comment on the shift in market expectations lower since the June meeting, but should around the September meeting.
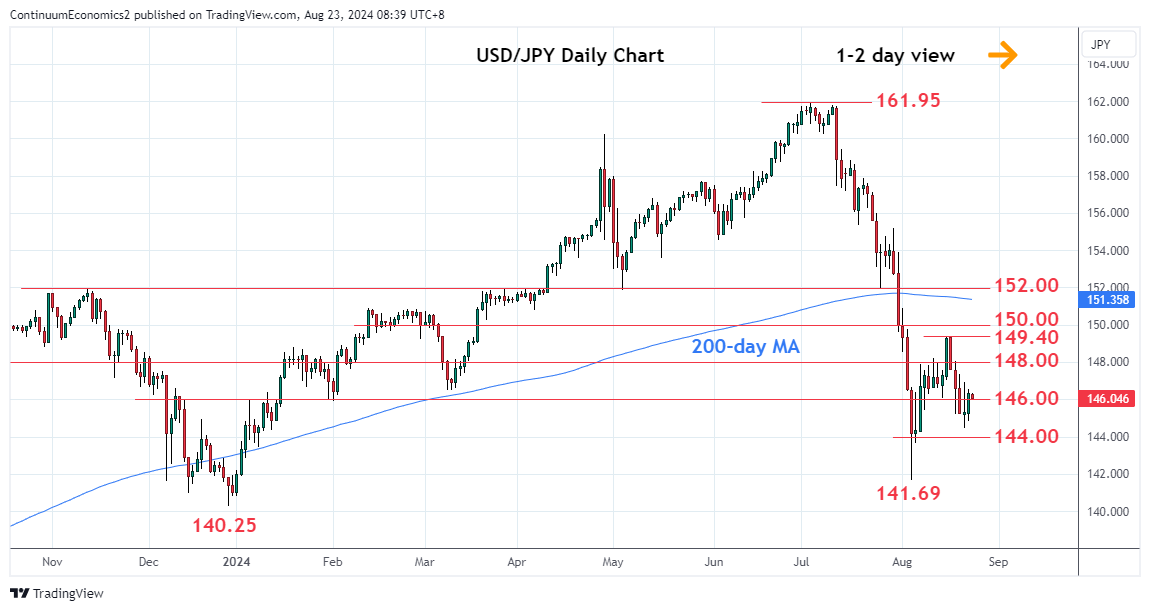
BoJ's Governor Ueda spoke in front of the parliament on Friday and reinforced the bank's policy tilt towards more tightening. While the caveat is always "if inflation forecast plays out", the hawkish tilt from the BoJ cannot be neglected, especially when National CPI lingers just below 3% in July. Deputy Governor Uchida's previous remark seems to be merely an attempt to verbal support the Japanese equity market when it crashed by more than ten percent, instead of a policy pivot. It means JPY should see medium term strength when yield differentials further narrows towards the end of year when Fed cuts.
On the chart, USD/JPY is higher in range from the 144.45 mid-week low as prices extend consolidation around the 146.00 level. Mixed daily studies suggest further ranging action here with resistance at the 147.00/35 congestion then the 148.00 level. While the latter caps, scope is seen for pullback to retest the 144.45 low then the 144.00 congestion. Would take break here to see extension to the 143.00 level. Below the latter will open up the 141.69 low to retest and where break will extend the broader losses from the July high.
Figure: Eurozone Economic Sentiment Indicator (%)
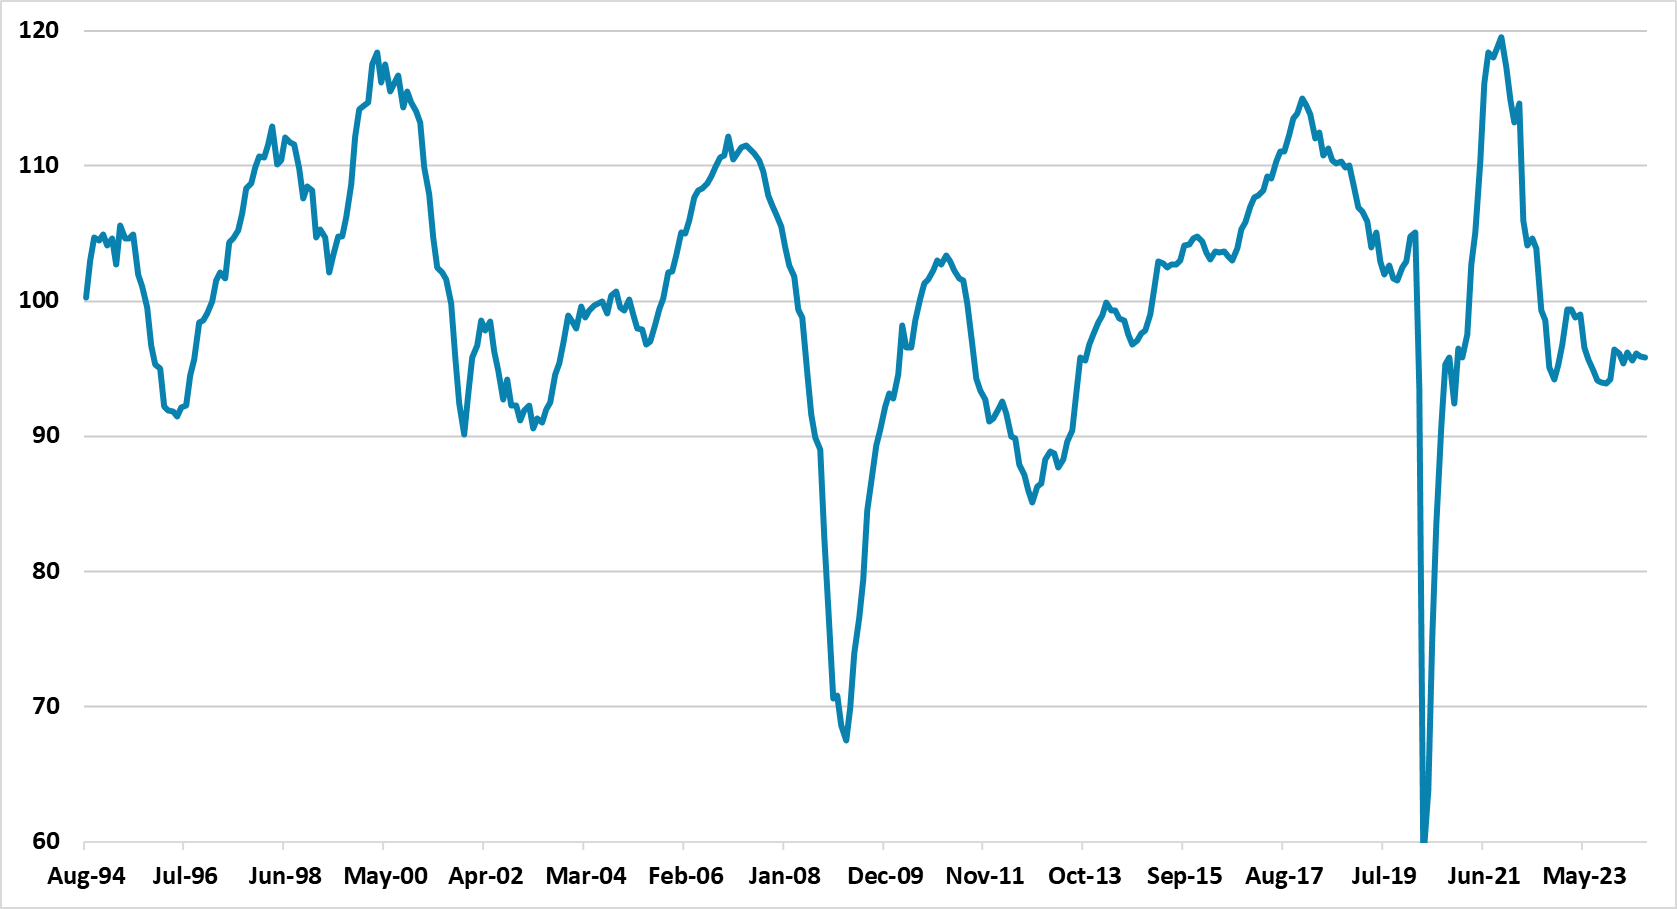
Elements of the July accounts help build confidence in more easing we expect ECB Lane Jackson Hole speech on Saturday to also provide comfort in near-term rate expectations. However, it is clear that key ECB board members do not want to be as clear as the run-up to the June meeting, but this could partially be internal politics and reserving the decision for the September 12 meeting. We see the three key criteria as influencing the ECB to deliver a 25bps cut in key policy rates at the September 12 meeting.
ECB forward guidance is an art rather than a science, with the July meeting accounts providing clues but also less divergence than the June meeting. One of the reason for less division than June is that no proposal existed for a cut. However, the underlying issue is that the hawks place more weight on actually seeing inflation sustainably hit target, which then shapes their views on what to do with policy rates. This will likely be evident once again at the September meeting when the doves will push for a 25bps cut – the July accounts indicated that the September meeting would be a good time to reevaluate restriction.
Otherwise, the long discussion on economy/inflation and policy, were for a change very much in line with the views communicated in the introductory statement and additionally in President Lagarde Q/A. A couple of points are worth noting. Firstly, the July accounts indicated that members were keen for wage growth to come down, which has now started to come through with the sharp drop in negotiated wages to 3.6% with the figures released today. Secondly, uncertainty exists on the economic and inflation trajectory. While these risks around the baseline have been highlighted, it was interesting that a discussion occurred on whether the ECB thinking was too dependent on a consumer recovery – especially with the savings rate drifting up.
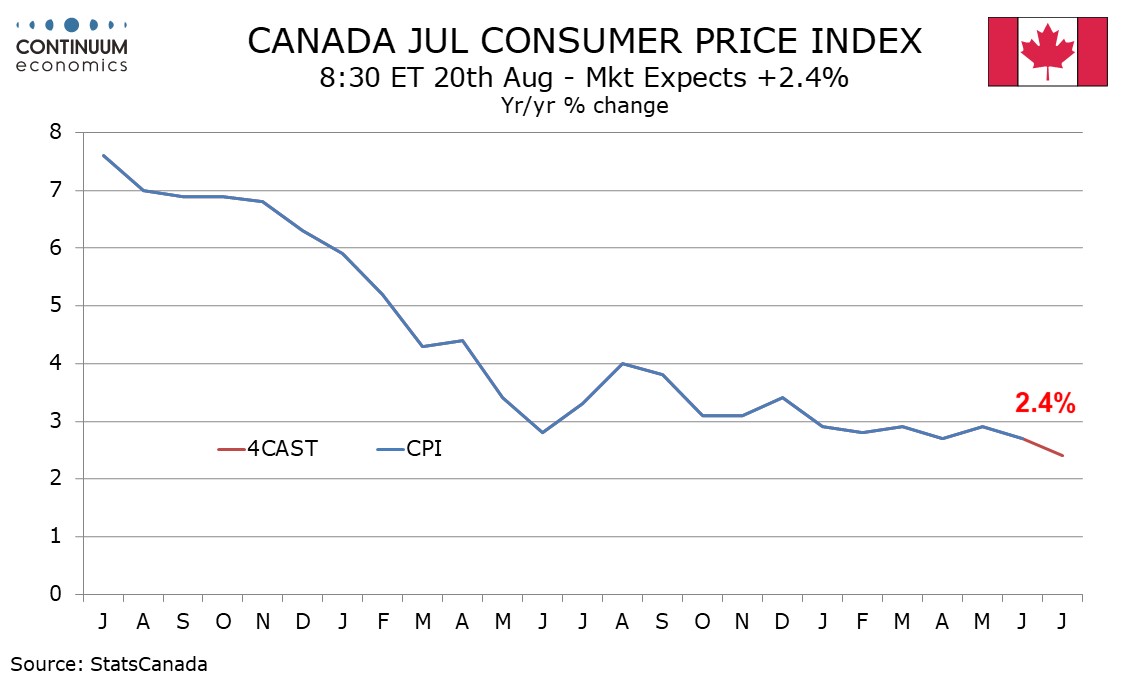
We expect July Canadian CPI to show a monthly gain in line with a recent moderate trend, but year ago strength will see yr/yr growth to slip from 2.7% in June. We expect CPI to rise in the month both overall and ex food and energy, the latter in line with June’s outcome and three of the last four months. We expect energy to be neutral after declining in May and June.
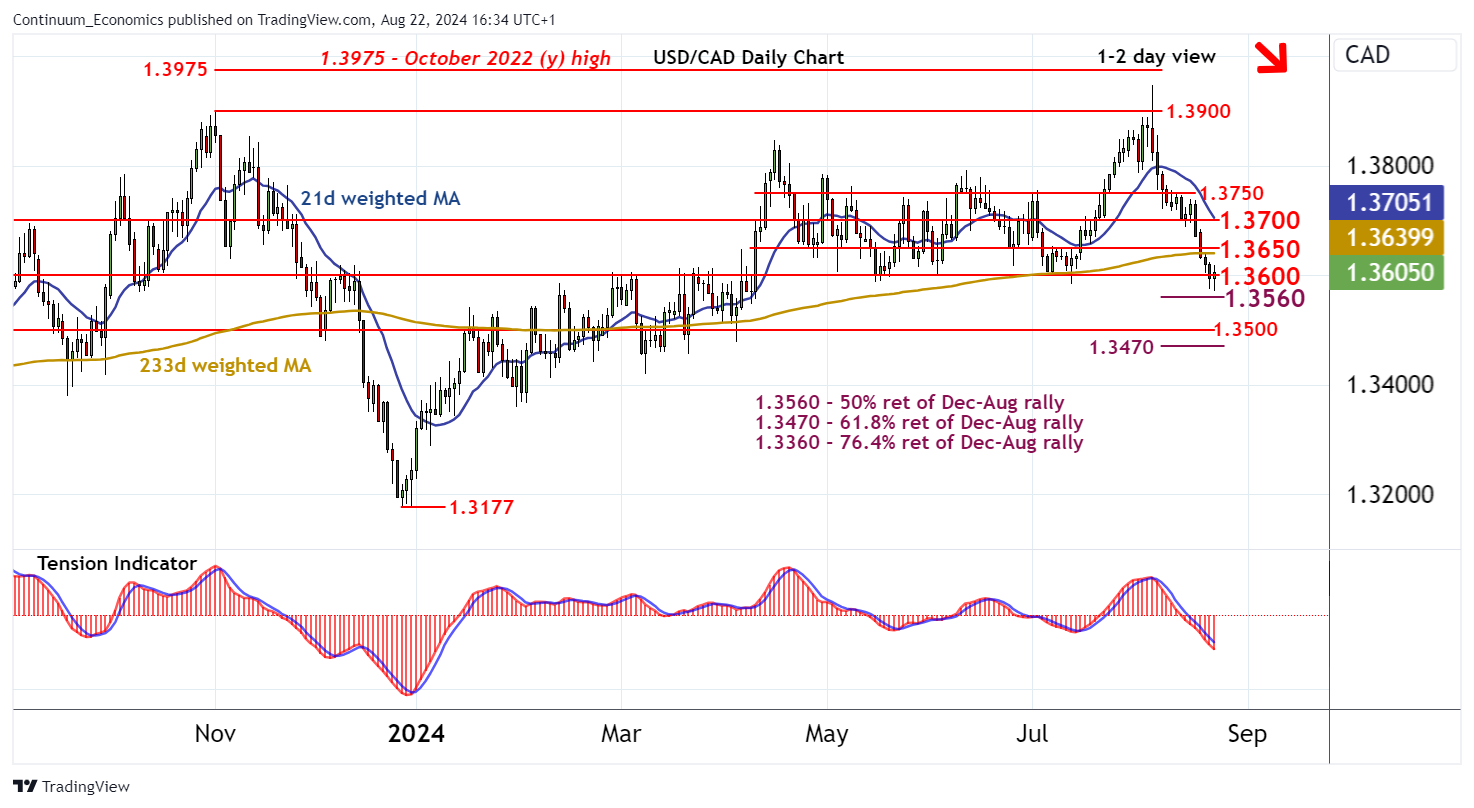
On the chart, USD/CAD's steady losses are finding support just above the 1.3560 Fibonacci retracement, as intraday studies turn higher and oversold daily stochastics flatten, with prices currently balanced around 1.3600. Continuation towards resistance at 1.3650 cannot be ruled out, but the negative daily Tension Indicator and bearish weekly charts are expected to limit any tests in fresh selling interest. Following cautious trade, further losses are looked for. However, a close below the 1.3560 Fibonacci retracement is needed to turn sentiment negative once again and extend August losses towards the 1.3470 retracement and congestion around 1.3500.
Figure: Inventory of Completed House (Number of Months)
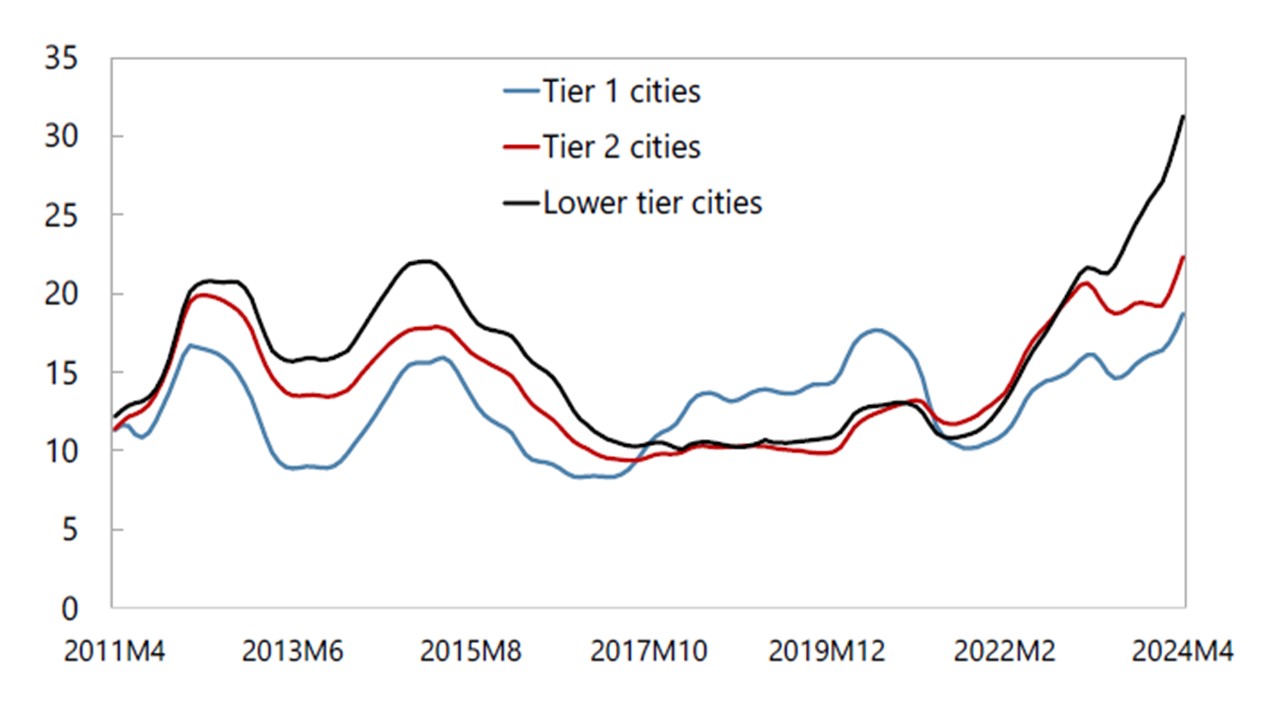
Though China’s authorities have taken some action to help the residential construction sector, the negative drags from the huge excess completed housing and uncompleted projects continues to weigh directly on the construction/steel and cement sector and consumer confidence. Aggressive policy action is need to stabilize the housing market otherwise the effects will remain and could get larger. China authorities for now however are focused on incremental policy support.
The epicenter of the growth drag on China economy is currently the residential property sector, where new construction remains a drag on GDP growth. China authorities have had a number of policy packages with some of the key highlights being Yuan500bln of PBOC pledged supplementary lending to support completing construction; Yuan300bln to buy excess completed inventory for affordable housing; mortgage rate cuts; lower deposits and recent a removal of new home price declines (new home sales have been depressed by second hand home prices falling more).
While the measures are welcome, they are not enough given the scale of the problem. Firstly, a large excess of completed inventory exists, which is restraining the market (Figure 1). Secondly, an even larger overhang of uncompleted housing is still in the pipeline, with delay spreading financial distress among more developers and some households that pre-paid for properties. Thirdly, population aging means that demand for housing is slowing sharply this decade (Figure 2). In some ways this is as bad as the 2006-10 U.S. housing market crash in construction investment terms (Figure 3). Though house prices have fallen by less than the U.S., China’s recent willingness to allow greater new house price declines has seen price falls of 20% plus in Beijing and Shenzhen in some new projects recently – which will initially hurt perceptions of housing wealth and produce a further adverse feedback loop.