EZ HICP Preview (Mar 1): More Core Disinflation Signs As Services Inflation Slows?

There has been repeated positive EZ news in the form of plunging inflation. This continued in the January numbers, albeit with the 0.1 ppt drops in both headline and core being less that most anticipated. As a result, the headline, at 2.8%, resumed its recent decline having risen to 2.9% in December due to base effects, the latter partly reversing in January. The core fell a notch to 3.3%, a 22-month low and very much on course to meet the ECB Q1 projection of 3.1%, if not undershoot it. This may be even more likely if our February HICP projections prove anything like accurate; we see the headline down to a 31-month low of 2.5% and the core down to a 22-month low of 2.9%, the latter encompassing softer y/y services inflation. This is notable as the ECB has been somewhat troubled by the failure of services inflation to have fallen in the last few months, this stable 4.0% y/y reading also evident in more resilient but still more modest monthly adjusted numbers (Figure 2), the latter being something the ECB is now more overtly using.
Figure 1: Headline and Core Inflation Falling Together Again
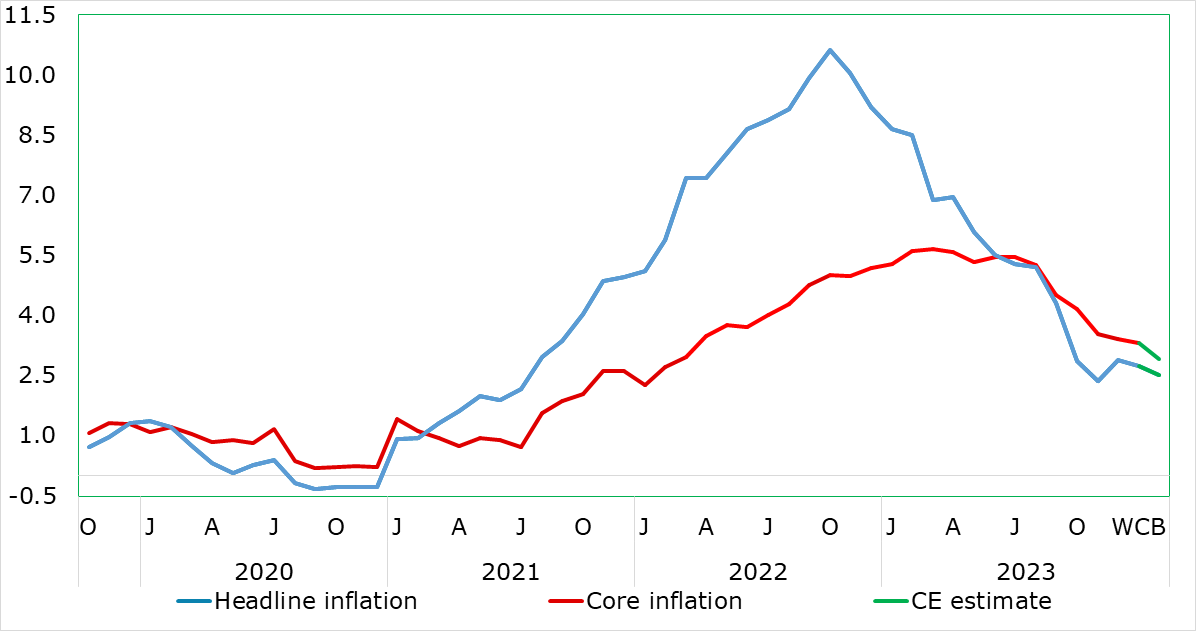
Source: Eurostat, Continuum Economics
On-Target Inflation Looming As Resilient Services Succumb!
February should see services fall clearly in y/y terms, this taking the core down in turn. There are some upside risks from fuel prices and from rents in this month’s numbers. Regardless, possibly encompassing added volatility from the early Easter this year, we still envisage that the headline now hit target us after mid-2024, well over a year earlier than the ECB envisages, and then undershoot in H2, while the core should continue to fall in the interim regardless. There are ever-clearer signs of softer underlying inflation at least in terms of non-energy goods and also in terms of persistent price pressures which are now running below the 2% target on an overall basis and even more so for core measures. Admittedly, services inflation has failed to fall for two successive months, a stability seen in seasonally adjusted m/m numbers, albeit the latter running at an annualized rate of half the headline 4% outcome.
Figure 2: Adjusted m/m Price Pressures Stable Around, if Not Below, Target
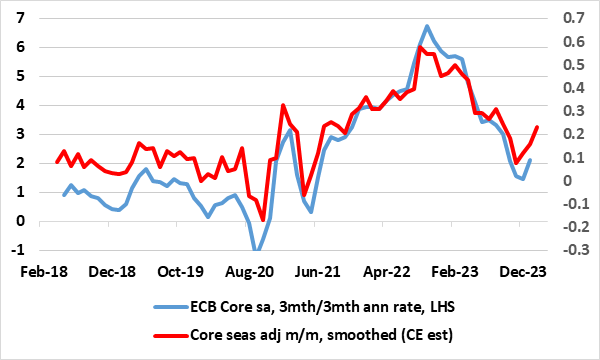
Source: ECB, CE,
Baseless Base Effects
Indeed, in the January HICP data, the core rate hit a low of 3.3%, down over two ppt in the last five months. But this disguises an even clearer fall in recent price dynamics, as seen in m/m seasonally adjusted data (Figure 2), and with the smoothed core rate now consistent with an undershoot of the 2% target, albeit possibly stabilising at around 0.1% in m/m terms. The ECB instead continues to (at least overtly by the hawks) focus on y/y rates despite the ensuing limitations from spurious base effects, although the adjusted data is widely used by the likes of Chief Economist Lane, albeit on a slightly different measurement basis, using 3mth on 3mth changes rather than the 3 month m/m moving average we prefer for its slightly greater topicality (Figure 2). But notably the account/minutes to the Jan 24-25 Council meeting saw Lane very much underscore that the Persistent and Common Component of Inflation was the best predictor of inflation one and two years ahead and that this had eased to 2% in December – NB; it has fallen below 2% into 2024 and broadly so, something we have underscored of late.