FX Weekly Strategy: Asia, April 13-17th
2yr Yields and The Iran War
U.S. March PPI Strongest since March 2022
And other U.S. Data
UK GDP Moving Sideways
Figure: 2yr yields (%)
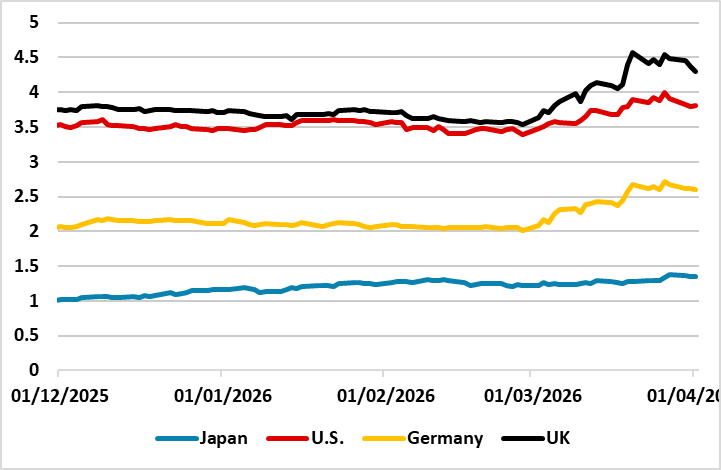
2yr yields can edge lower from current less elevated levels, as DM central banks continue to try to calm fears of near-term rate hikes outside of the BOJ/RBA. However, the key swing factor remains the length of the Iran war, as that will determine the trajectory of energy prices in the next 12 months. Our baseline remains for a 4-8 week war, as President Trump urgently searches for a U.S. exit from the Iran war. This would argue for a further modest decline in 2yr yields. However, we attach a 30% probability to a 2-6 month war, which could see USD150 oil prices; greater risk of 2nd round effects and real risk of ECB/BOE rate hikes -- the Fed would likely find it difficult to hike rates. This week is key, with Trump's threat of an attack on Wednesday. A major attack of all Iran power plants would see large scale retailation from Iran and likely pivot the war scenario to 2-6 months. Thus 2yr yields will likely remain choppy this month, depending on sentiment towards the war length.
One of the reasons for the adjustment at the front-end, is that hedge funds and other money managers had been running long 2yr/short 10yr to play for a steeper yield curve. This is the classic play for DM government bonds when an easing cycle is underway and not yet complete. The Iran war fueled fears that rate cuts have ended and tightening could be seen instead. This amplified the initial jump in 2yr yields and prompted yield curve flattening (Figure 2) except in Japan – BOJ tightening expectations meant that the market was already biased to higher rates.
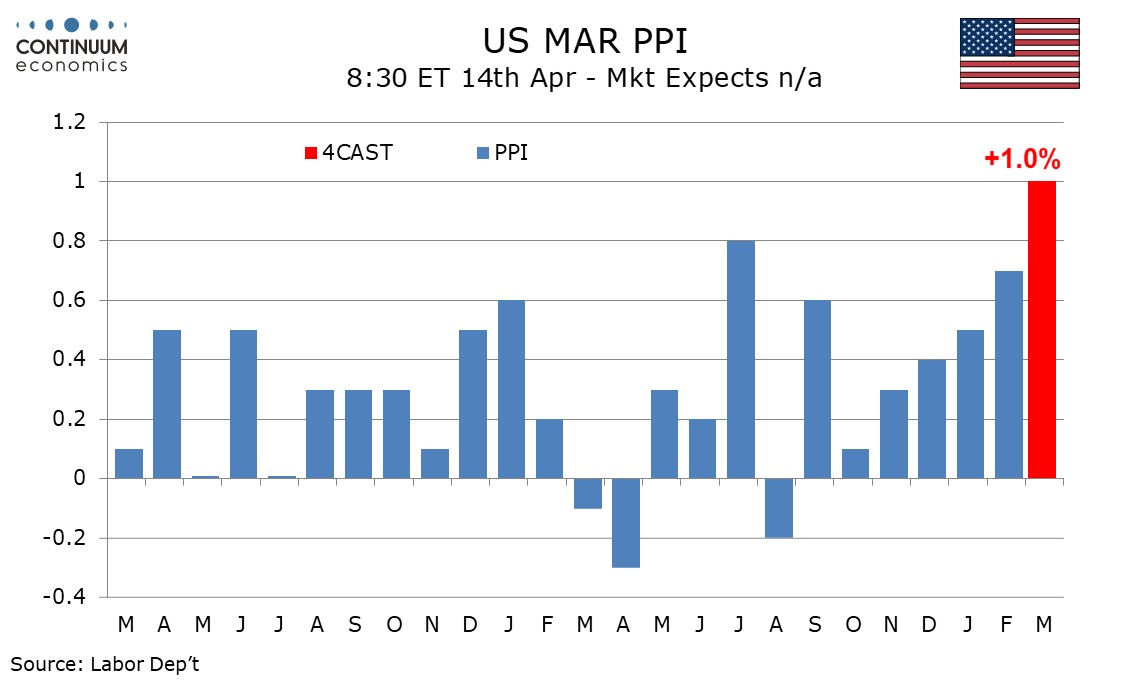
We expect PPI to rise by 1.0% in March, which would be the strongest rise since March 2022. The rise will be led by energy, though the core rates ex food and energy at 0.5% and ex food, energy and trade at 0.4% are likely to maintain a recent acceleration. We expect a strong 10.0% increase in energy even if price gains late in March are not fully captured. We expect a 0.8% increase in food to follow a strong 2.4% increase in February that reversed weakness seen in Q4 and January. The situation in the Middle East poses upside risks for food as fertilizer supplies are disrupted but impact in March is likely to be limited.
March 2022 after the Russian invasion of Ukraine saw some acceleration in core PPI suggesting upside risk in series that have already been showing worrying signs of acceleration in January and February. We expect PPI ex food and energy to rise by 0.5%, matching gains seen in December and February but slower than January’s 0.8%, while ex food, energy and trade rises by 0.4%, slower than February’s 0.5% but matching January. We expect goods ex food and energy to rise by 0.4% and services to rise by 0.6%, the latter led by transport and warehousing.
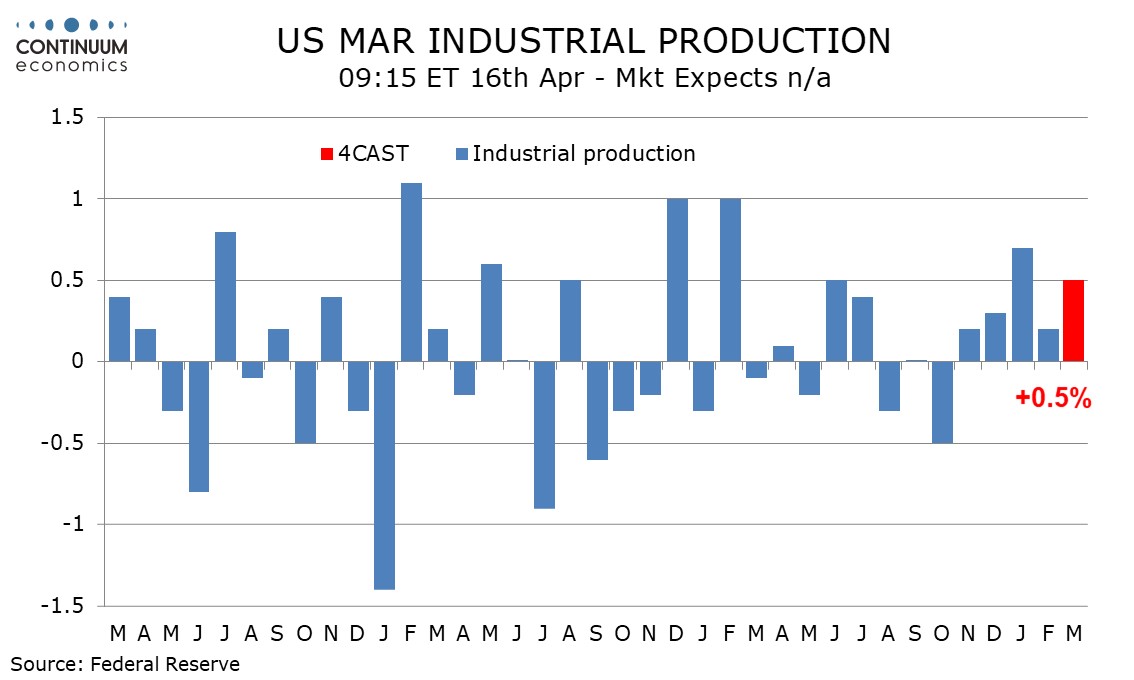
We expect a 0.5% increase in March industrial production with the increase coming from a 0.3% rise in manufacturing, while gains of 1.0% in utilities and 1.2% in mining will each add around 0.1% to the total. Manufacturing signals have generally been picking up with ISM manufacturing data firm, and manufacturing payrolls in March showing the strongest increase since November 2024. However manufacturing aggregate hours worked showed little change, and that suggests only a moderate 0.3% increase in manufacturing output. Payroll data suggests a neutral contribution from autos.
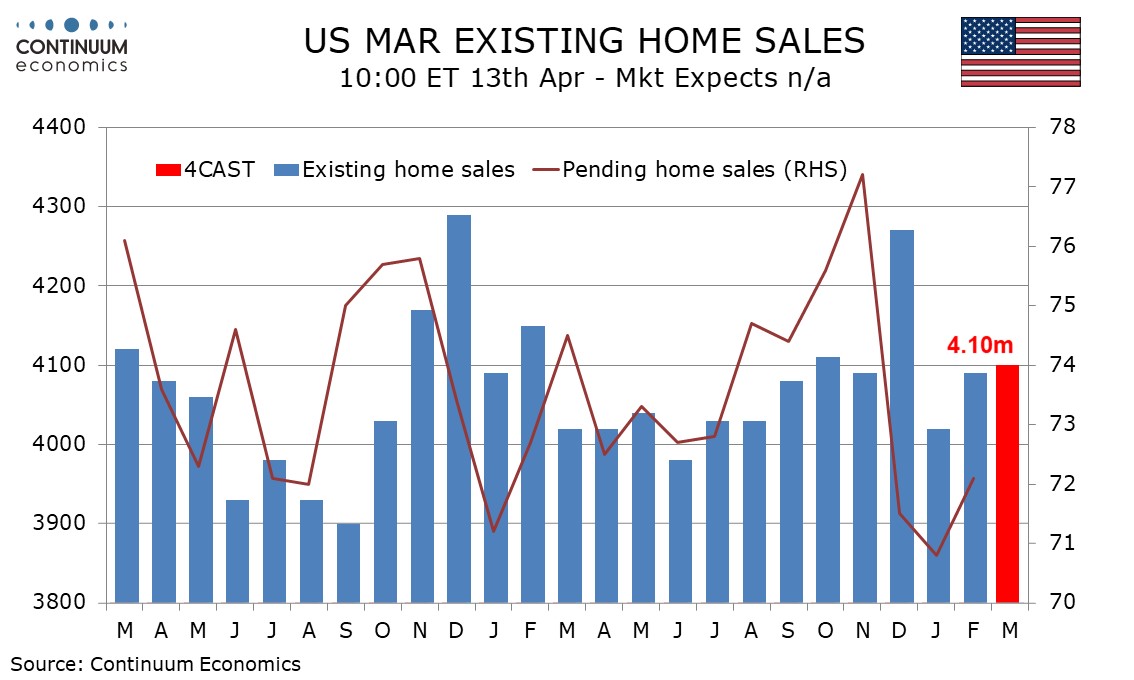
We expect a marginal 0.2% increase in March existing home sales to 4.10m leaving trend with little direction. Going forward, the Iran war poses downside risks in Q2, depending on its duration. This level would be similar to October and November as well as February, if slightly below the average of December’s stronger 4.27m and January’s weaker 4.02m.
Figure: GDP Growth Hardly Strong and With Increasing Downside Risks Ahead?
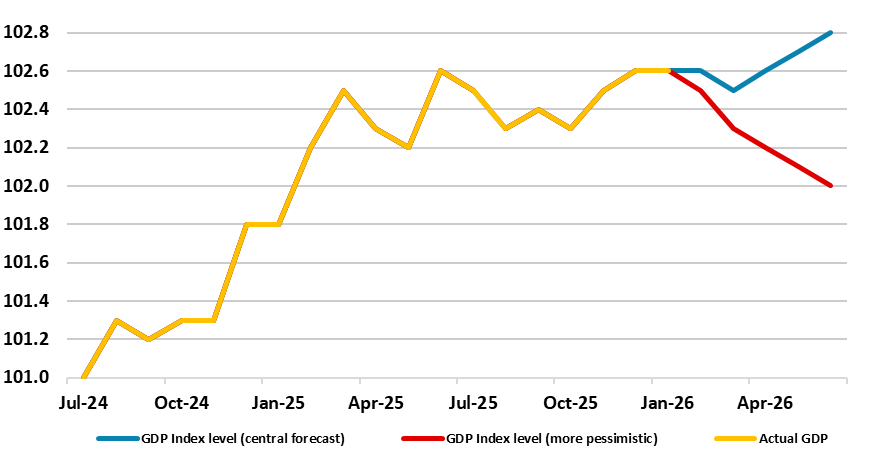
Fresh downside surprises were the story from the January GDP numbers and we expect a similarly muted outcome for the looming February numbers. There were expectations that the economy would enjoy a further successive rise in January, thereby providing the best three-month showing in two years were dashed as GDP instead stagnated and we see a further unchanged m/m figure for February. Weakness or at least lack of momentum is likely to (again) be broad-based in spite of a possible bounce in real estate. But, as is familiar with recent UK real economy data, we still suggest that even with modest war-induced March GDP decline, it looks more likely that growth last quarter will be no better than the 0.1% q/q seen in Q4, less than consensus and BoE thinking, at least as envisaged back in February for the latter. Moreover, there may be downside risks as activity (Figure) and sentiment will, of course, be hit either earlier and/or more severely by events in the Middle East.
For the Week Ahead
UK
At the IMF meeting there will be several MPC appearances, including from Bailey, Green both on Tuesday with Mann speaking from London. Taylor speaks on Thursday. Although less important as it covers pre-war numbers, GDP data arrive on Thursday, alongside production and trade figures. Fresh downside surprises were the story from the January GDP numbers and we expect a similarly muted outcome for the looming February numbers and we see a further unchanged m/m figure for February. Weakness or at least lack of momentum is likely to (again) be broad-based in spite of a possible bounce in real estate.
Eurozone
Data wise sees EZ industrial production numbers data (Wed) likely to see a worrying third successive fall and this coming before the impact of the conflict. Final HICP data arrive on Thursday. ECB wide there are several speakers most notable being Lagarde (Tue) and Lane (Thu) with arch-hawk Schnabel also on Thursday.
Rest of Western Europe
Sweden sees details of what turned out to be surprisingly friendly CPI data for March (Tue). Switzerland sees a speech from SNB President Schlegel on Thursday. In Norway, also on Thursday the Norges Bank’s bank lending survey.
USA
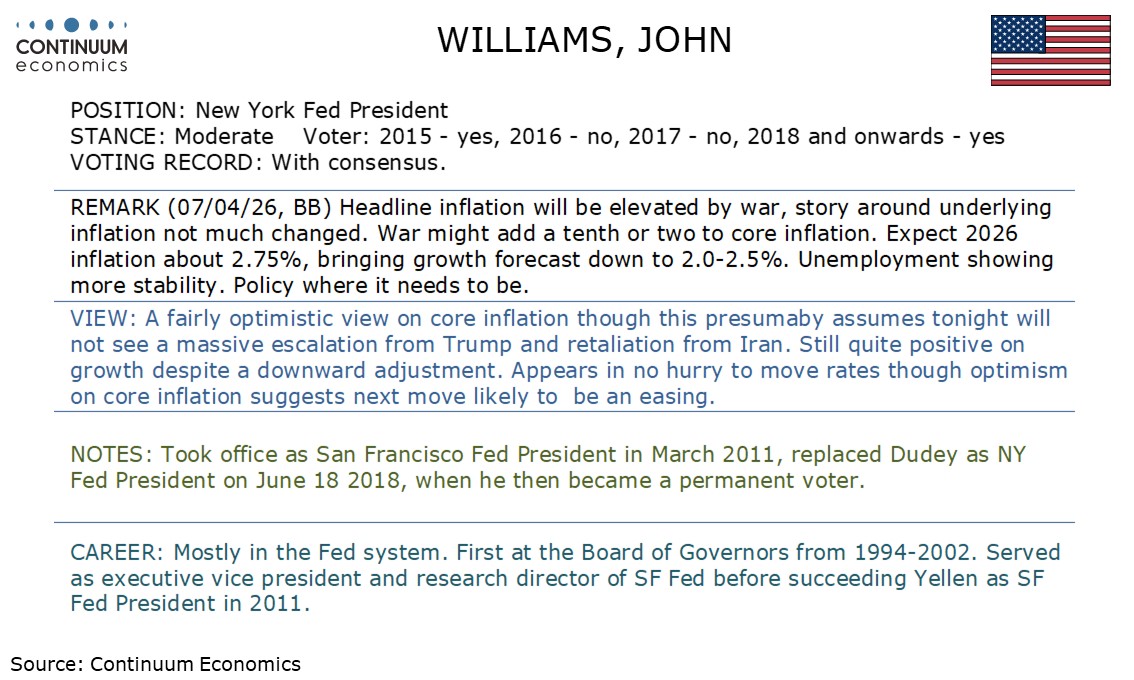
The US calendar is fairly quiet. On Monday we expect a marginal 0.2% increase in March existing home sales to 4.10m. Tuesday’s NFIB small business optimism survey for March is likely to take a hit on higher energy prices. Also on Tuesday we expect a 1.0% increase in March’s PPI, with gains of 0.5% ex food and energy and 0.4% ex food, energy and trade. Fed’s Goolsbee and Paulson are due to speak. Wednesday sees March import prices and April’s Empire State manufacturing survey, followed by April’s NAHB homebuilders’ index while the Fed’s Beige Book may be more interesting than usual. Thursday sees weekly initial claims and April’s Philly Fed manufacturing survey. We then expect a 0.5% increase in March industrial production, with manufacturing up by 0.3%. The Senate hearing for Fed Chair nominee Kevin Warsh is scheduled and Fed’s Williams is due to speak. Friday’s calendar is quiet.
CANADA
In Canada Monday sees February building permits, Thursday March existing home sales and Friday March housing starts. February data for manufacturing and wholesale sales are due on Wednesday, for which preliminary estimates are for gains of 3.8% and 2.3% respectively.
JP
Quiet calendar for Japan next week. Only Industrial production and Machinery Order on Tuesday.
AU
Labor data on Thursday will be the most important release for Australia next week. It is expected the Australian labor market will remain healthy. There is little sign for overheating or rapid cooling in the labor market, thus likely little surprises. Else, we have business confidence on Tuesday.
NZ
Business PSI on Monday, and electronic card sales on Friday are the only tier two releases.
Recap of the Week
2-Week Ceasefire, Then?
U.S. March Energy to surge in CPI
U.S. Personal Income slips, Core PCE Prices remain firm
This Week's Fed Speakers
RBNZ Inflation Forecast Revised Higher
Figure : Iran Key Issues
| Issue |
| The lifting of all primary and secondary sanctions on Iran. |
| Continued Iranian control over the strait of Hormuz. |
| U.S. military withdrawal from the Middle East. |
| An end to attacks on Iran and its allies. |
| The release of frozen Iranian assets. |
| A UN security council resolution making any deal binding. |
Source: Media sources from Iran, US, Pakistan
The ceasefire will likely involve a new normal of shipping companies paying Iran a toll. While this is adding a cost to Gulf crude oil/products and LNG, the premium will be a lot lower than the cost of an ongoing war. The U.S. and Iran will now likely be reluctant to restart the war, which suggests that the ceasefire will likely be extended. However, it is difficult to see a comprehensive peace deal, given that the sides remain so far apart on some key issues. Iran will also use the threat that a future attack from the U.S. or Israel in the future will trigger closure of the Strait of Hormuz to get the U.S. to stop Israel at least for the next 6-12 months. This could all mean a further gradual reduction in the risk premium for global oil/oil products/LNG and Urea fertilizers in the coming weeks. This also reduces the risk of 2nd round inflation effects and central banks having to hike.
While both sides are claiming victory in the PR war, the ability to agree a 2-week ceasefire is important. We have argued that president Trump has been looking for an off ramp, given the war impact on gasoline prices and his falling popularity rating before the key November midterm elections. However, Iran’s decision to accept Pakistan’s proposal for a 2-week ceasefire is their first major compromise and suggested Iran now sees merit in negotiating and stopping the hostilities. Though Iran has been hurt severely from a military viewpoint, it has demonstrated leverage in the Straits of Hormuz and via asymmetric attack on Gulf countries.
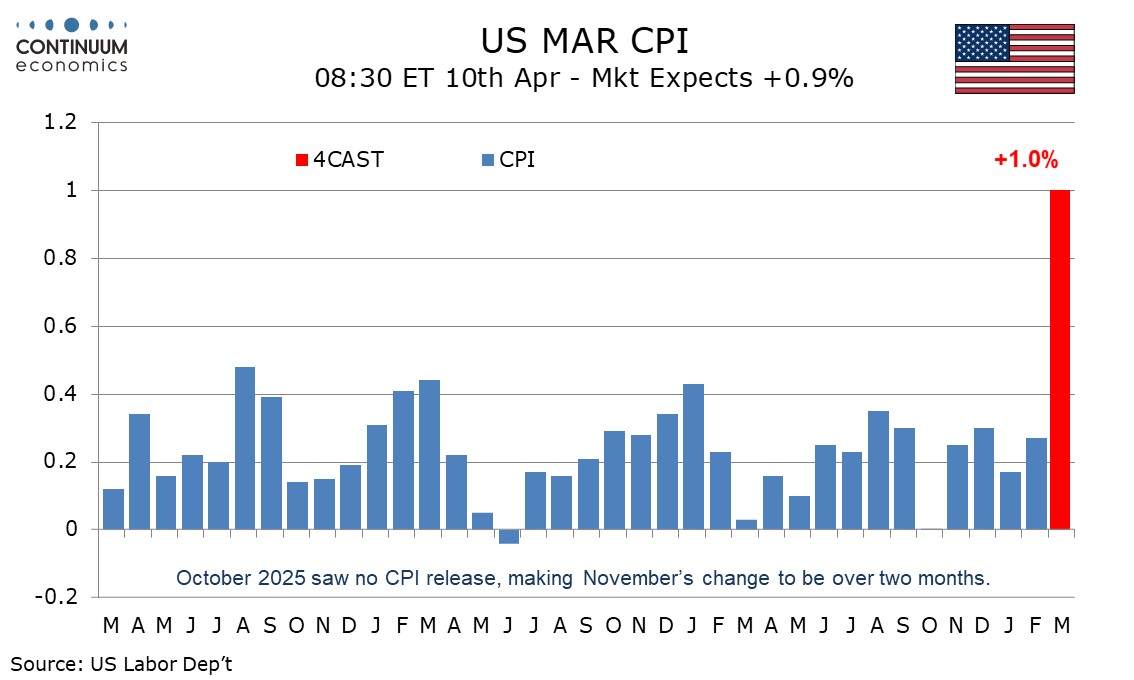
We expect March CPI to surge by 1.0% overall, which would be the strongest rise since June 2022, seen in the aftermath of the Russian invasion of Ukraine. However we expect only a moderate increase ex food and energy, of 0.22% before rounding, which would match that seen in February. Even with some restraint from seasonal adjustments, gasoline prices look sure to see a sharp surge, which will explain nearly all of a 12.5% increase in energy, with most other components of the energy breakdown likely to seen only modest changes. We expect a moderate 0.3% increase in food, but there are upside risks going forward with the closure of the Strait of Hormuz disrupting fertilizer supplies.
Ex food and energy data has been showing a loss of momentum in recent months, with trend now looking close to 0.2% per month and even January at 0.3% not showing as strong a new year bounce as did most recent years. However PPI, some of which impacts core PCE prices, has been showing some acceleration even before the energy shock.
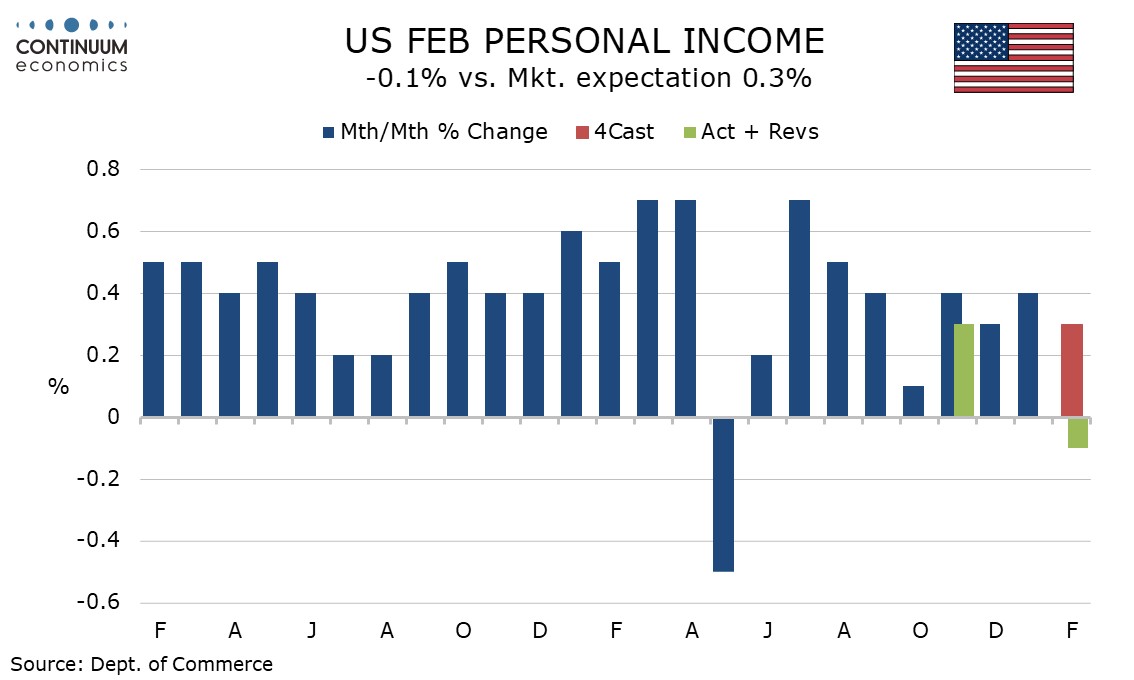
The latest US data is mostly on the weak side of expectations, most notably a 0.1% decline in personal income for February that significantly underperformed a 0.5% rise in spending (itself slightly below expectations) which saw the savings rate slip back after a tax cut-assisted bounce in January. 0.4% gains in overall and core PCE prices are as expected but too high. Initial claims corrected higher but continued claims are down, while Q4 GDP was revised even lower, to 0.5% from 0.7%.
The personal income detail shows a 0.2% rise in wages and salaries, below trend as was February’s non-fark payroll. Causing overall personal income to fall were significant declines in dividend income and benefits from Affordable Health Care enrollments. Disposable income was supported in January by lower taxes. The flip side of lower taxes is lower benefits. Real disposable income fell by 0.5% after a 0.6% increase in January. Personal spending was supported by strength in February retail sales already released, led by autos which rebounded from a weak January, but service spending rose by only 0.3%, weaker than expected and up only 0.1% in real terms. The savings ratio at 4.0% is back near Q4 levels after a bounce to 4.5% in January.
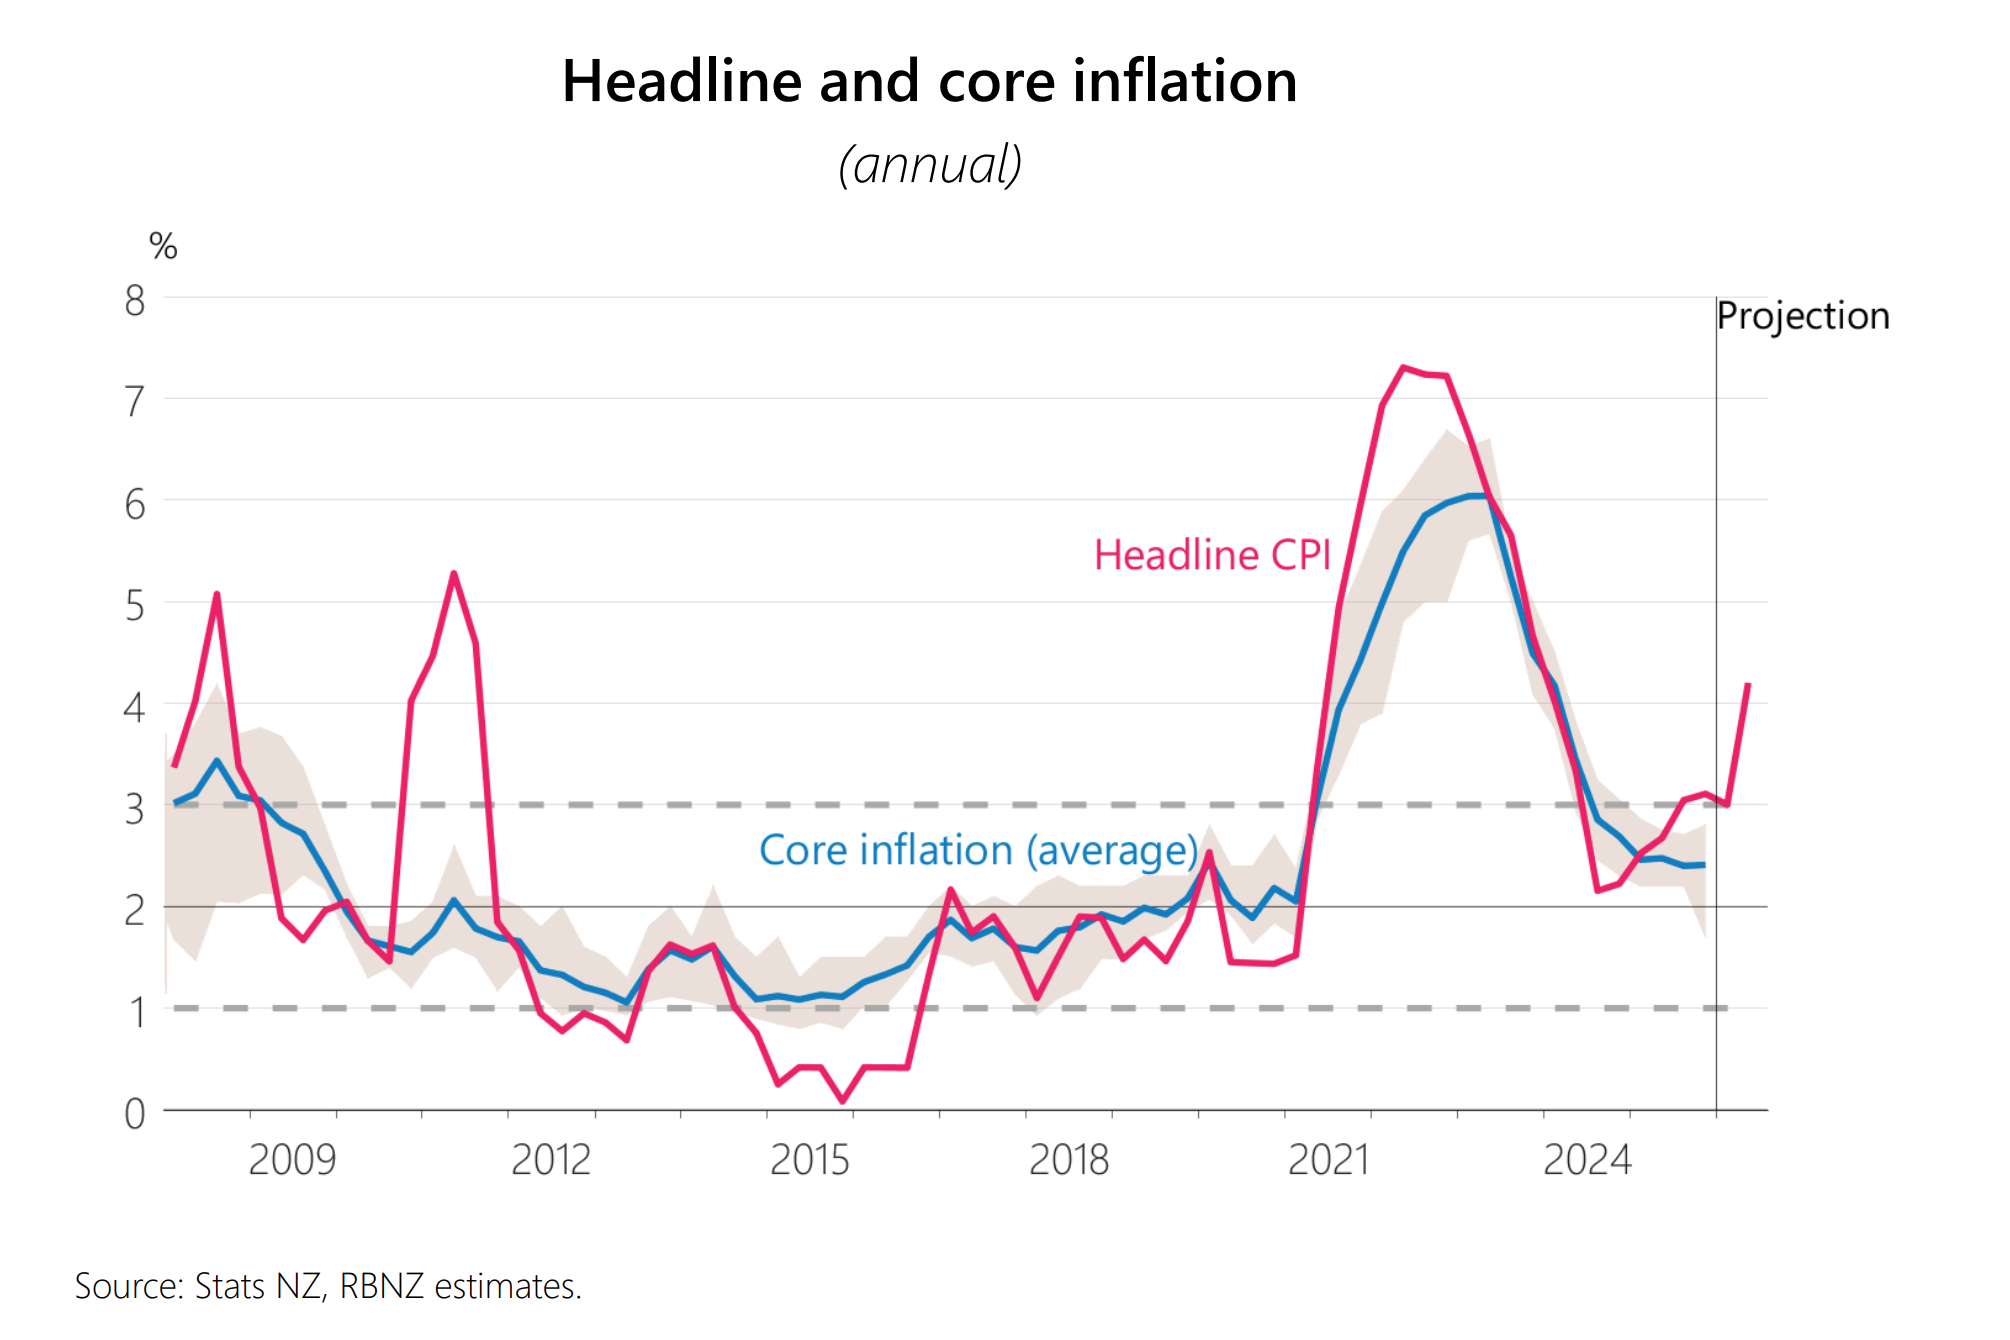
The RBNZ kept rates unchanged at 2.25% in the April meeting and has revised their inflation forecast. They see crude oil price below 100 USD/b by the end of June, which led to their inflation forecast for March to be just 3% y/y and 4.2% y/y in June. It is interesting we are not seeing a hawkish tilt from the RBNZ with 4.2% y/y CPI expected. They are downplaying such with weak demand and spare productive capacity.