U.S. Initial Claims still low, Employment Cost Index still firm, Q2 income and spending totals confirmed
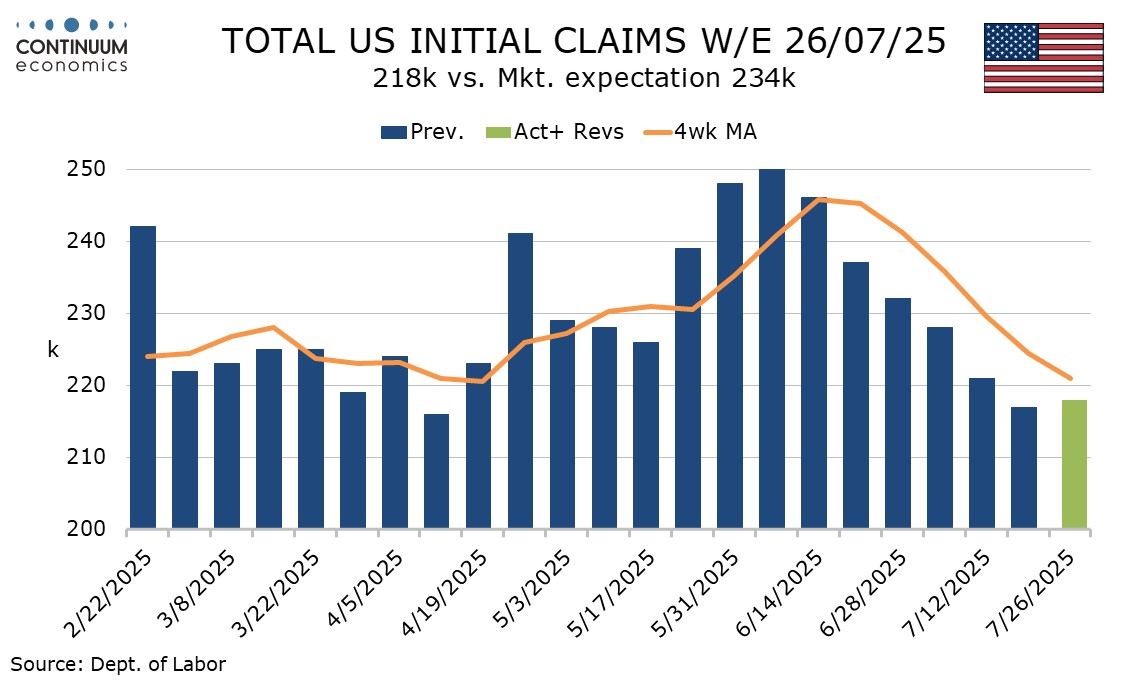
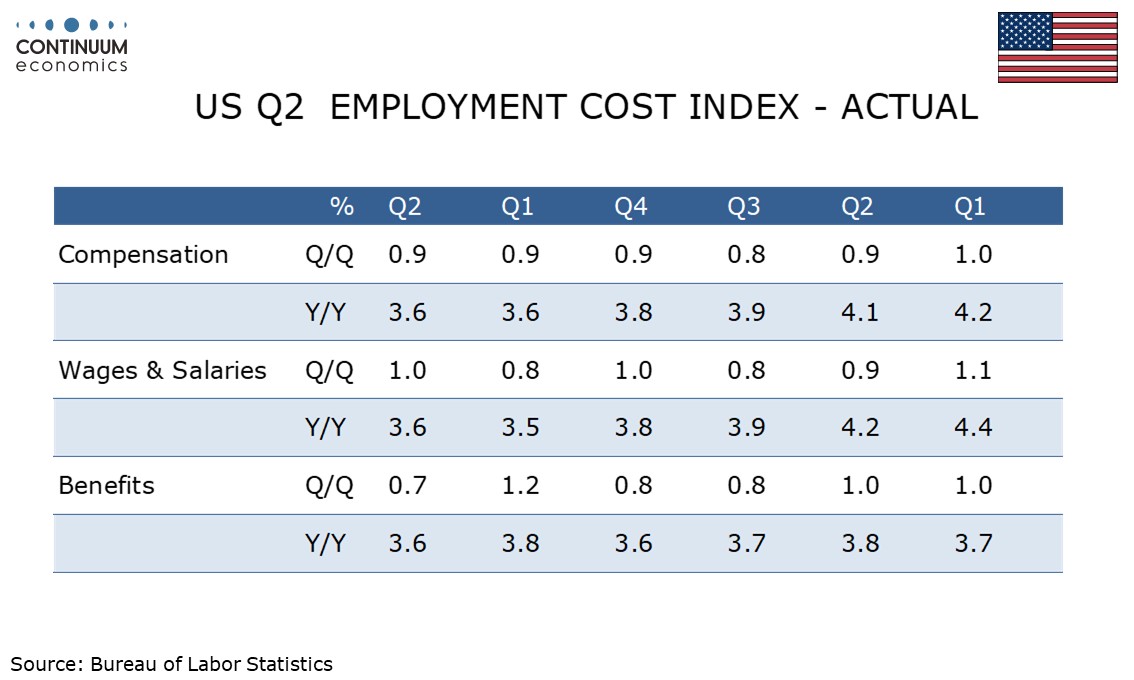
Initial claims with a 1k rise to 218k may have marginally broken a string of six straight declines but are lower than expected, while a 0.9% rise in the Q2 employment cost index is stronger than expected, further signaling continued labor markets strength. June’s personal income and spending report is largely old news with Q2 totals already seen in the GDP report.
Last week’s 217k initial claims total was the lowest since April 12 and a sixth straight decline, suggesting easing of labor market downside risks as tariff fears fade. Despite a marginal rise this week the 4-week average of 221k is the lowest since April 19. The survey week for Jul’s non=farm payroll came two weeks ago.
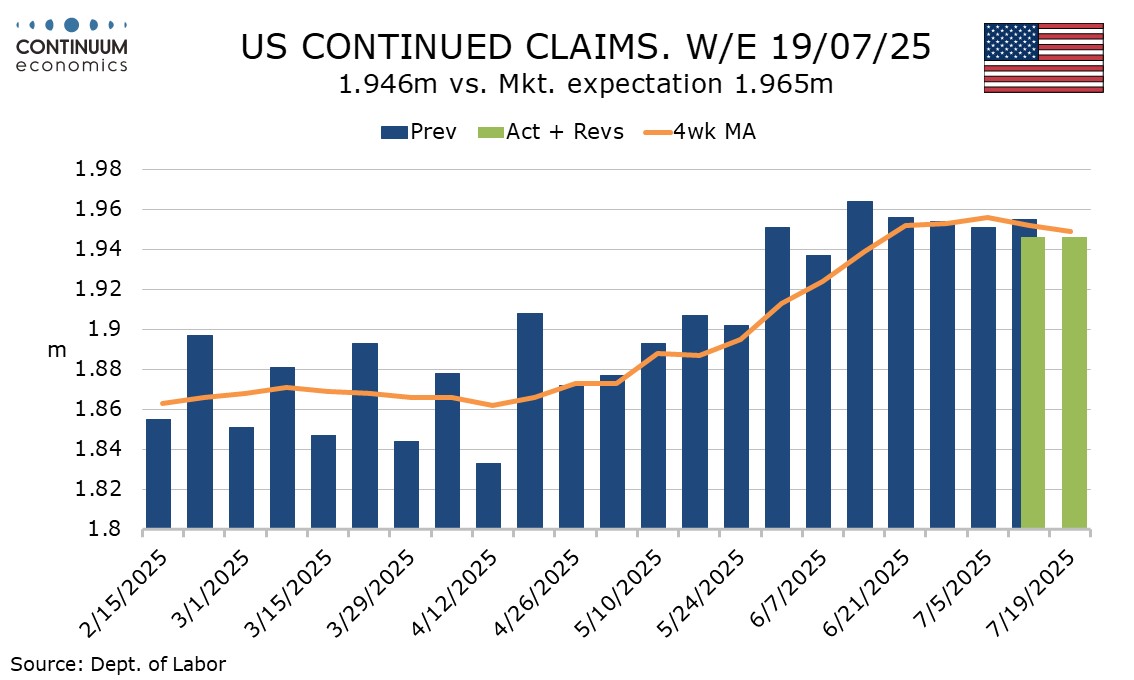
Continued claims, unchanged at 1.946m, are also lower than expected, with last week revised down from 1.955m. An uptrend in the 4-weeka average appears to have peaked though we have seen less of a reversal than is the case in initial claims. Continued claims cover the week before initial claims.
This is the third straight 0.9% rise in the employment cost index, with wages and salaries slightly firmer at 1.0% but benefits slower at 0.7%. Yr/yr growth was unchanged at 3.6%, a pause in a recent downtrend, with wages and salaries and benefits both at 3.6%.
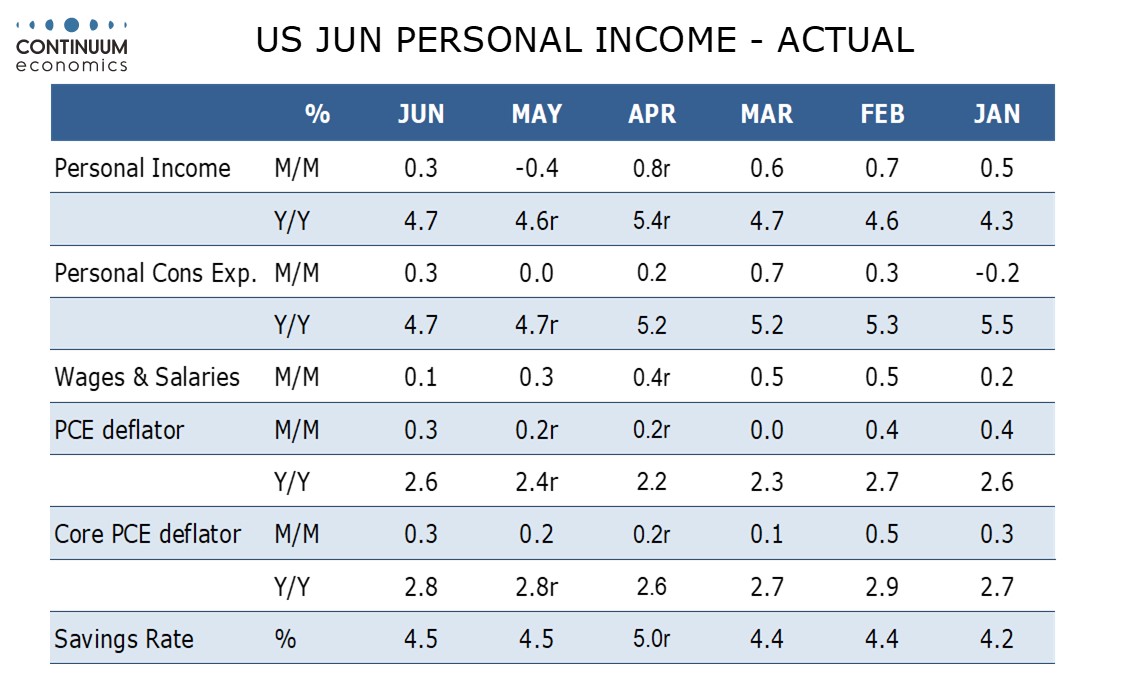
Personal income, spending, PCE prices and core PCE prices all rose by 0.3% in June, income slightly stronger than expected, spending slightly lower and the price data in line, though all four series needed upward back month revisions to reach the Q2 totals.
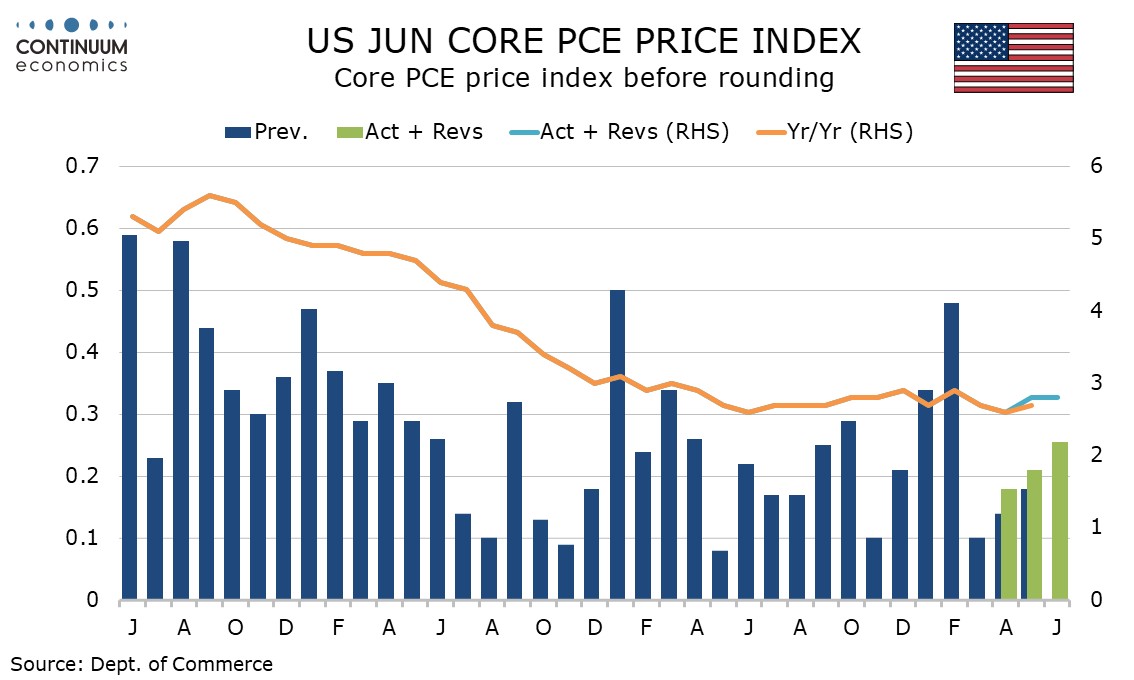
The core PCE price index rose by 0.256% before rounding but an upward revision to April to 0.2% from 0.1% saw yr/yr growth stronger than expected, unchanged at 2.8%. The overall PCE price index at 2.6% yr/yr from 2.4% was also stronger than expected.
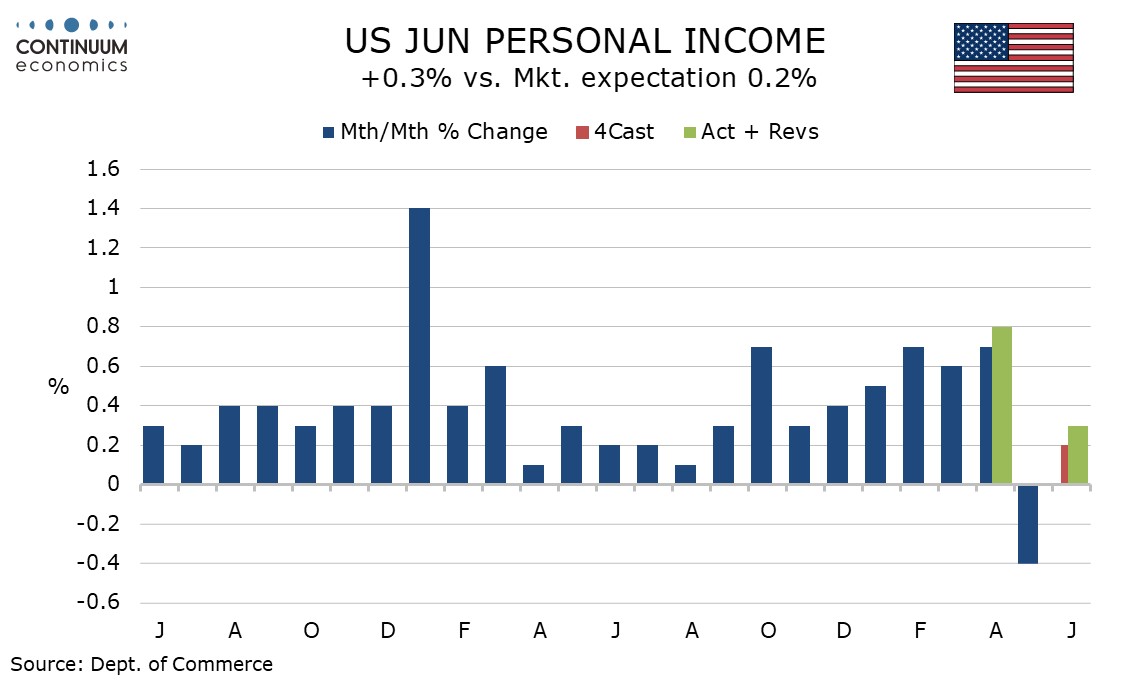
Wages and salaries rose only 0.1% in June, contrasting the firm employment cost data, and the slowest rise since July 2024. Overall personal income was supported by strength in government benefits.
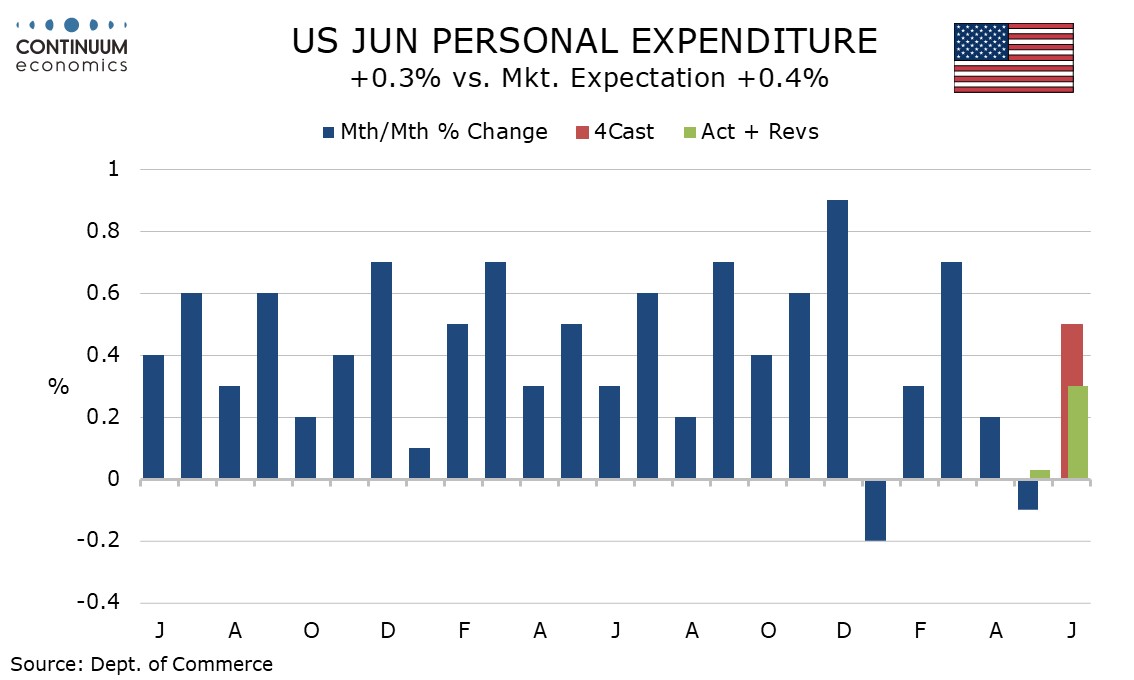
Personal spending saw durables unchanged, non-durables up by 0.7% and a third straight 0.3% increase in services. These service gains were only 0.1% in real terms.