U.S. September and October New Home Sales - Trend showing signs of improvement
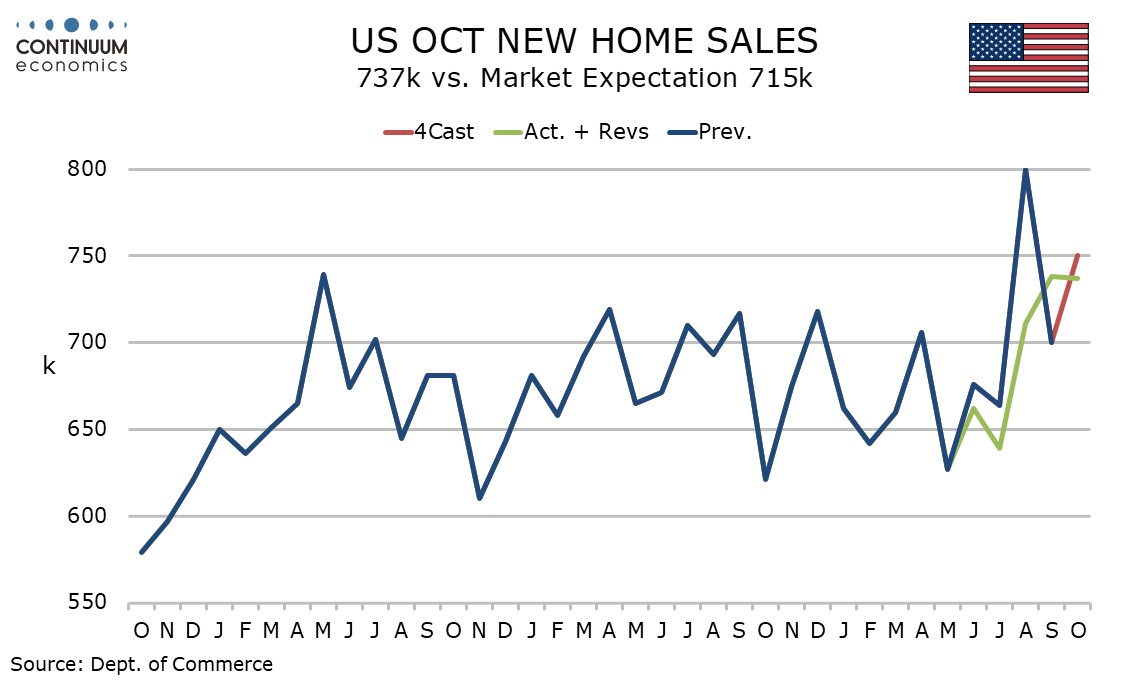
October new home sales at 737k are slightly above consensus and almost unchanged from September’s 738k, which was released for the first time with this October report. August however was revised down quite sharply from a surprisingly strong 800k to 711k, while June and July were also revised lower.
The strength of August data was surprising as then housing indicators were mostly quite weak, so August’s revision should not be a major surprise. The improvement since then is consistent with improving housing sector data as the Fed resumed easing. The 3-month average of 729k is the highest since March 2022.
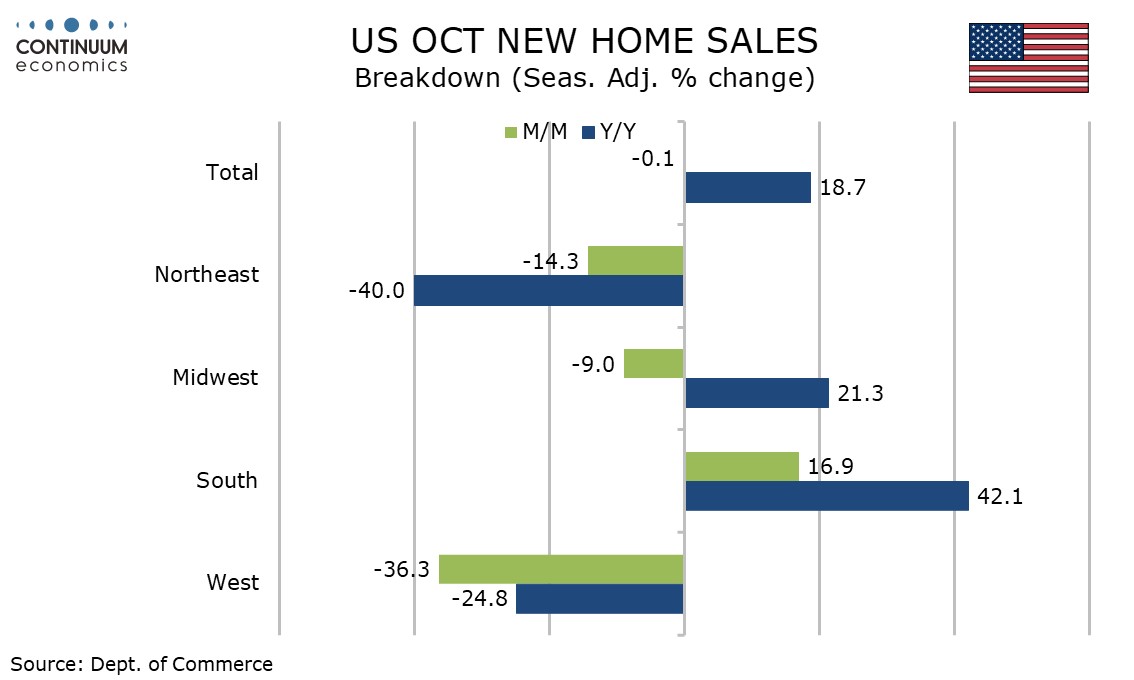
Regionally October saw strength in the South and weakness in the West, after September data where the Midwest and West were strong but the South quite weak, The South is by far the largest region accounting for well over half of sales.
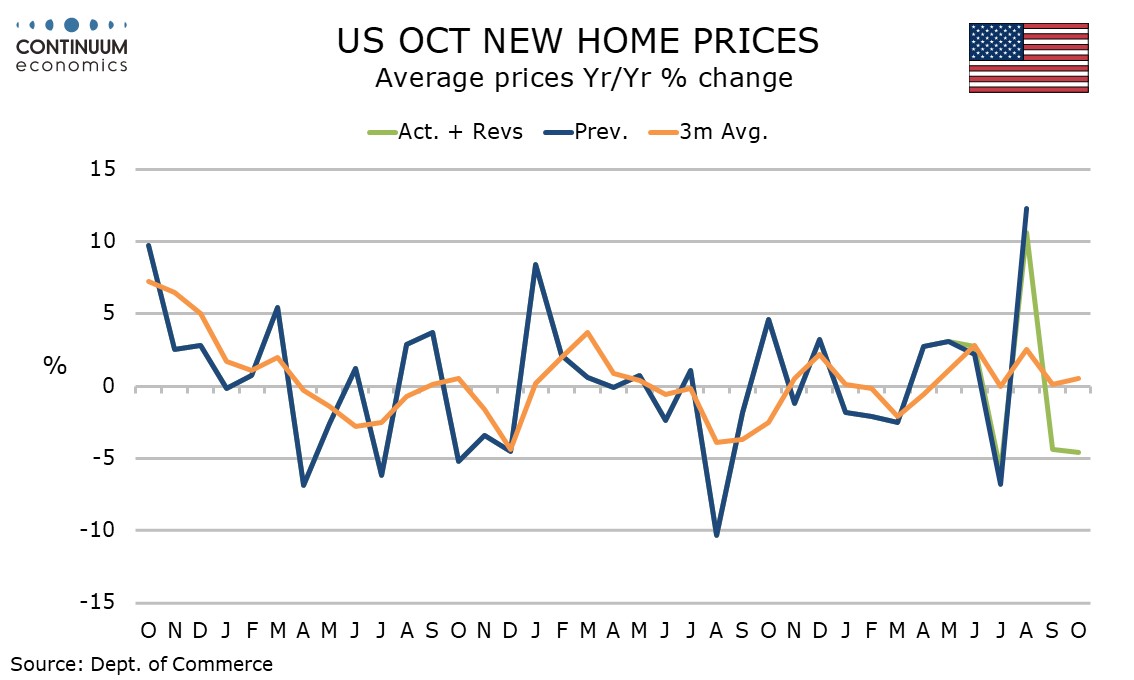
Prices are mostly soft, with the median falling 3.4% ion September and 3.3% in October after a strong 5.7% rise in August. The average rose by 3.0% in October after a 8.1% fall in September that followed a rise of 8.9% in August.
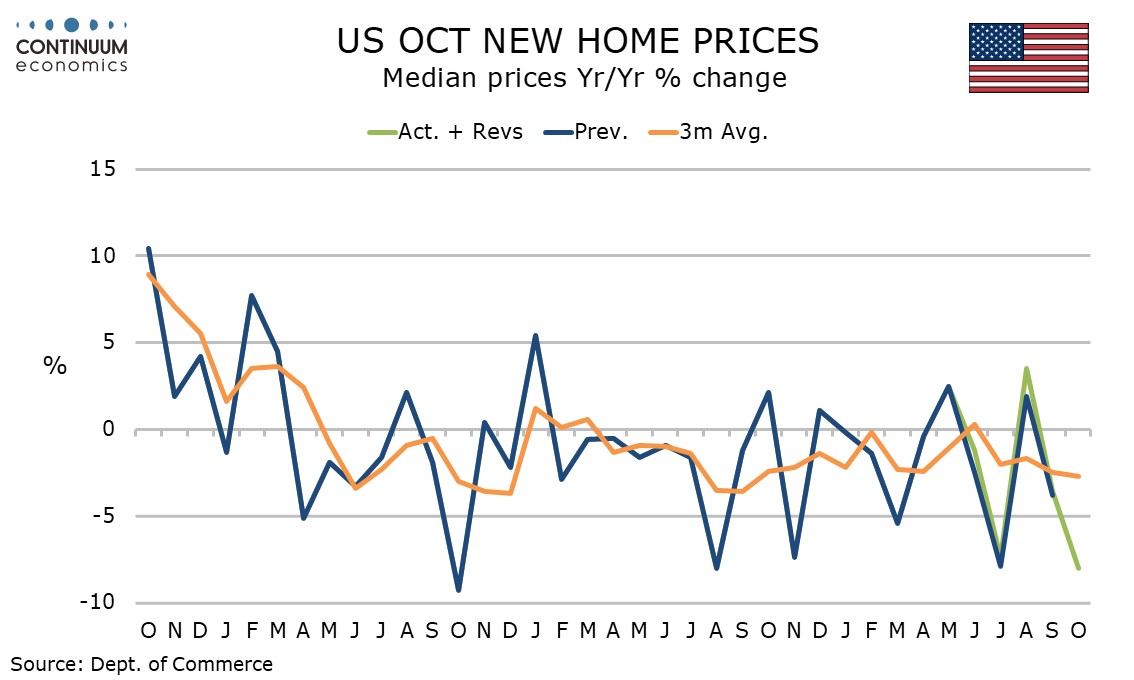
The yr/yr median price is down by 8.0%, The steepest fall since August 2024, while the yr/yr average price is down by 4.6%. This series was weaker as recently as July.