U.S. January Core PCE prices match Core CPI, Spending and Disposable Income subdued
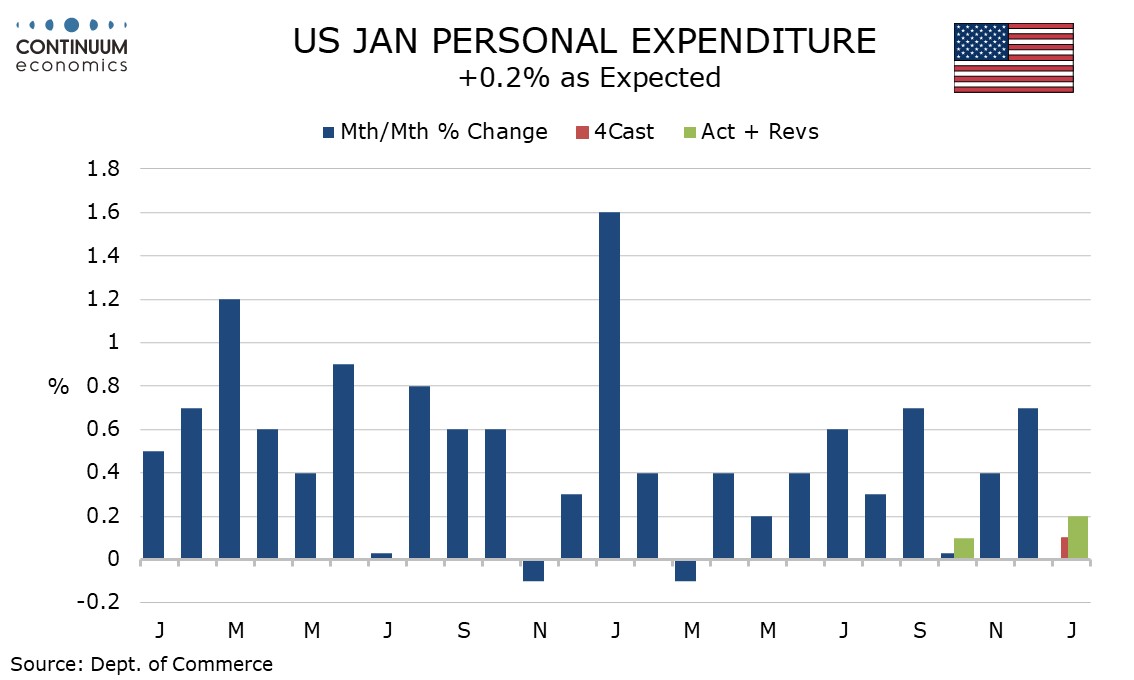
January’s PCE price data has matched the strength of the CPI, rising 0.3% overall and 0.4% in the core rate, and while as expected is a break from a string of encouraging inflation data in late 2023. Personal spending saw a weak 0.2% rise as expected but personal income saw a stronger than expected 1.0% increase on government benefits, though this was offset by a sharp rise in tax payments.
The core PCE price index actually increased by 0.416% before rounding, marginally exceeding a 0.392% core CPI and contrasting a recent tendency of core PCE prices to underperform. Like the CPI PCE price data was subdued for goods, falling by 0.2%, but saw a strong 0.6% increase in services.
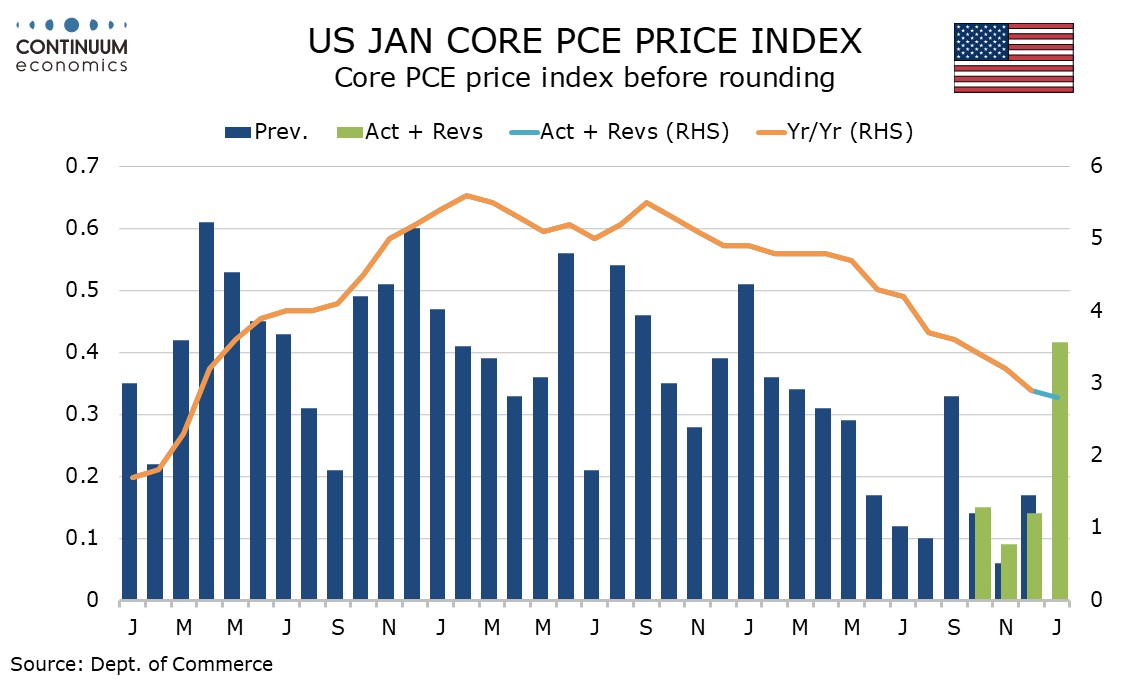
December core PCE price data was revised lower, to 0.1% from 0.2%, but we already knew from the GDP revisions that Q4 had been revised marginally higher, to 2.1% annualized from 2.0%. Yr/yr core PCE prices slipped marginally to 2.8% from 2.9% while overall PCE prices fell to 2.4% from 2.6%.
The strength of the January data probably reflects one-time price gains brought in for the new year, and few will expect a string of 0.4% core PCE price gains to follow. However the price gains are likely to stick, with the above tend month followed by an on trend month rather than a correction below trend, and the fact prices were raised in the new year shows that pricing power persists.
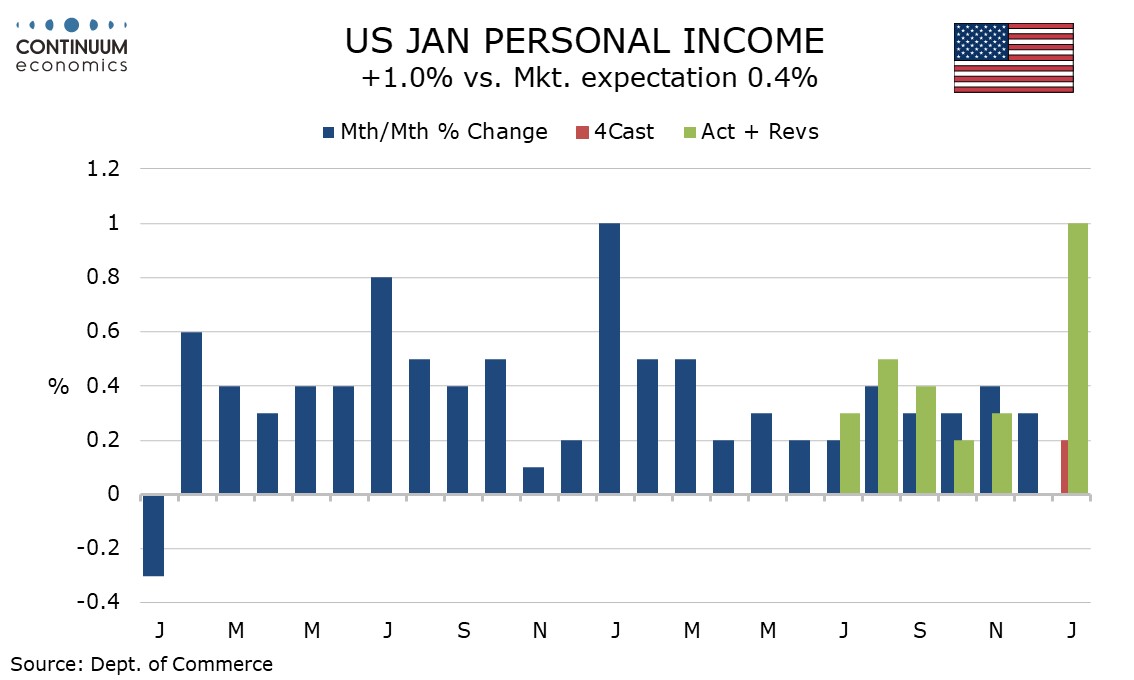
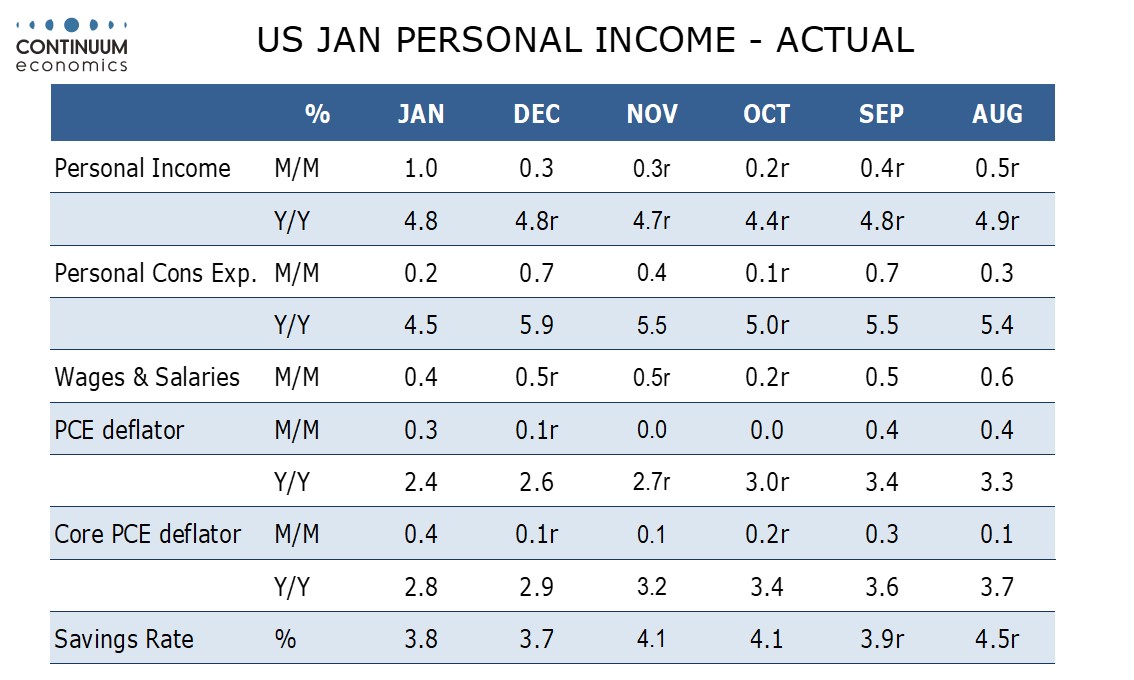
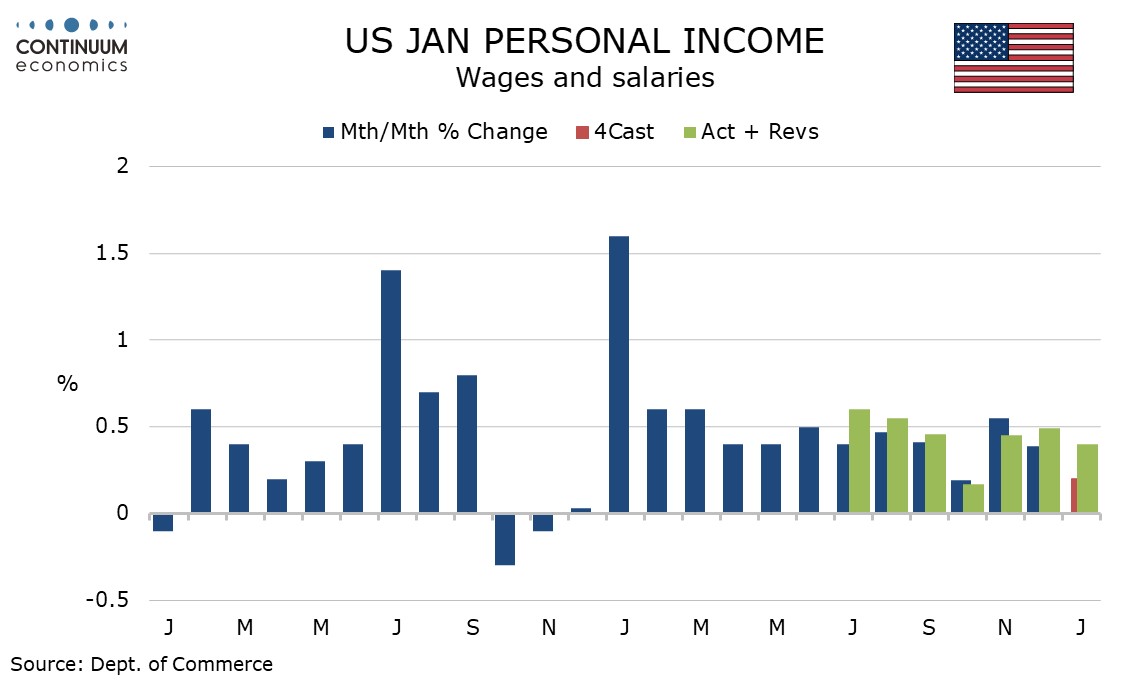
The personal income detail shows a moderate 0.4% increase in wages and salaries, with a lower workweek weighing against strong gains in employment and average hourly earnings. The 1.0% rise in personal income was led by a rise in government transfers, primary due to annual cost of living adjustments to Social Security and Affordable Health Care act enrollments.
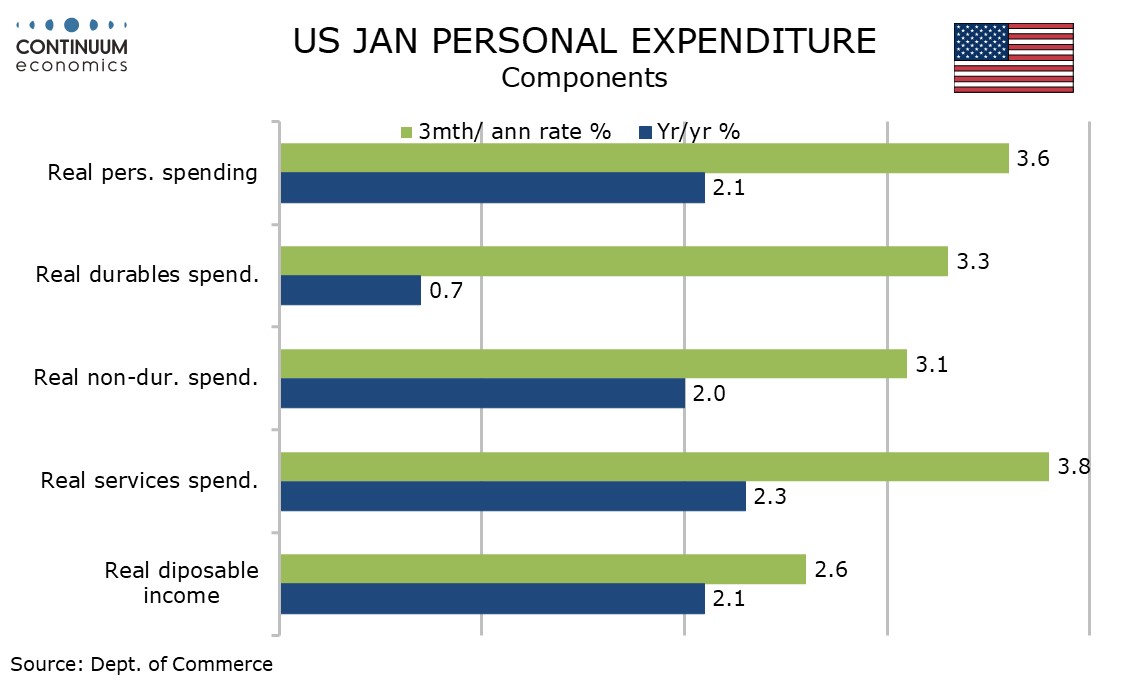
However government is taking as well as giving, with tax payments surging by 6.0% meaning disposable personal income rose by only 0.3%, and was flat in real terms. This is still marginally head of spending, which rose by 0.2% and fell by 0.1% in real terms but the savings ratio at 3.8% from 3.7% remains weak and does not appear supportive for spending going forward.
The personal spending detail showed a 1.2% decline in goods, even weaker than the 0.8% decline in retail sales, but a 1.0% rise in services. This was led by prices but service spending saw a third straight firm 0.4% increase in real terms, after incorporating upward revisions seen with the GDP data.
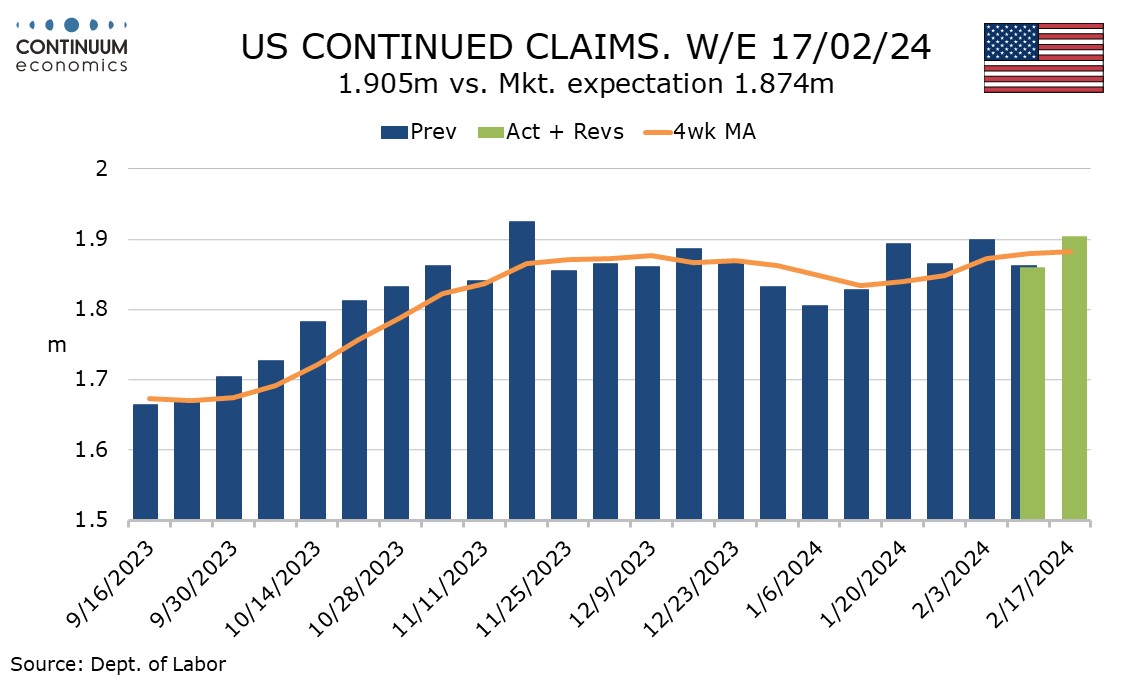
Initial claims saw an upward correction to an in line with trend 215k from a below trend 202k which came in the payroll survey week. That low figure may have been due to bad weather making claims harder to file and the 4-week average is up from January’s lows, hinting at a slower but far from weak February payroll.
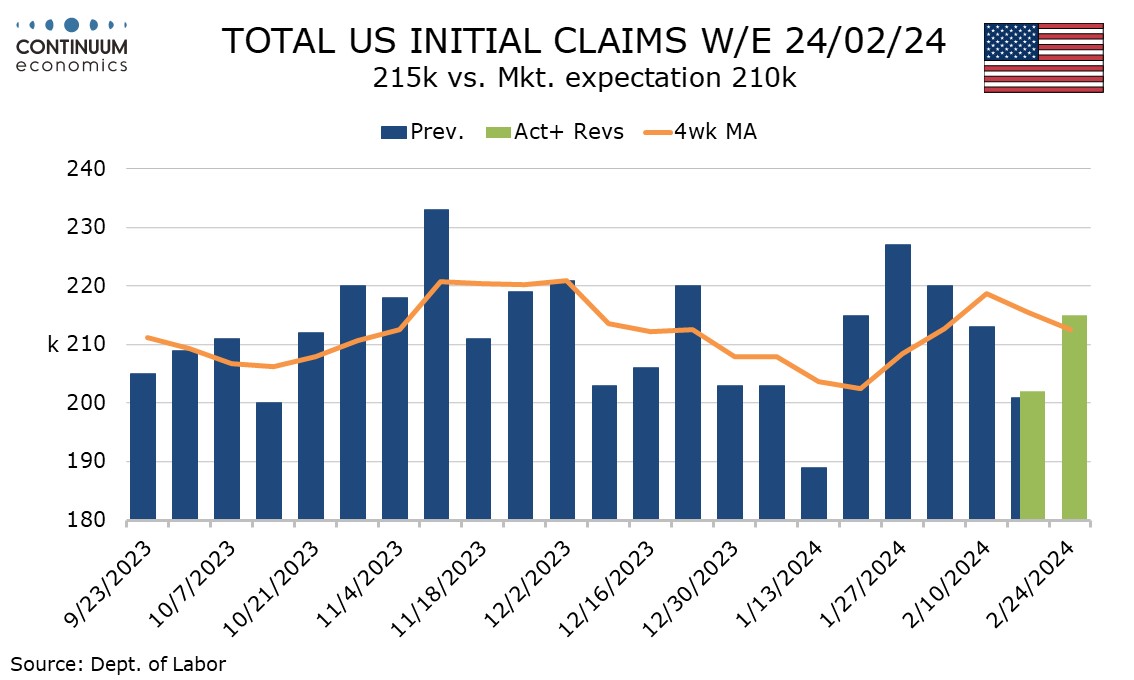
Continued claims, up by 45k to 1.905m more than fully reversed a preceding 29k drop. Continued claims cover the week before initial claims, and this this week’s data is for the payroll survey week.