This week's five highlights
Trump’s Tariffs and Markets
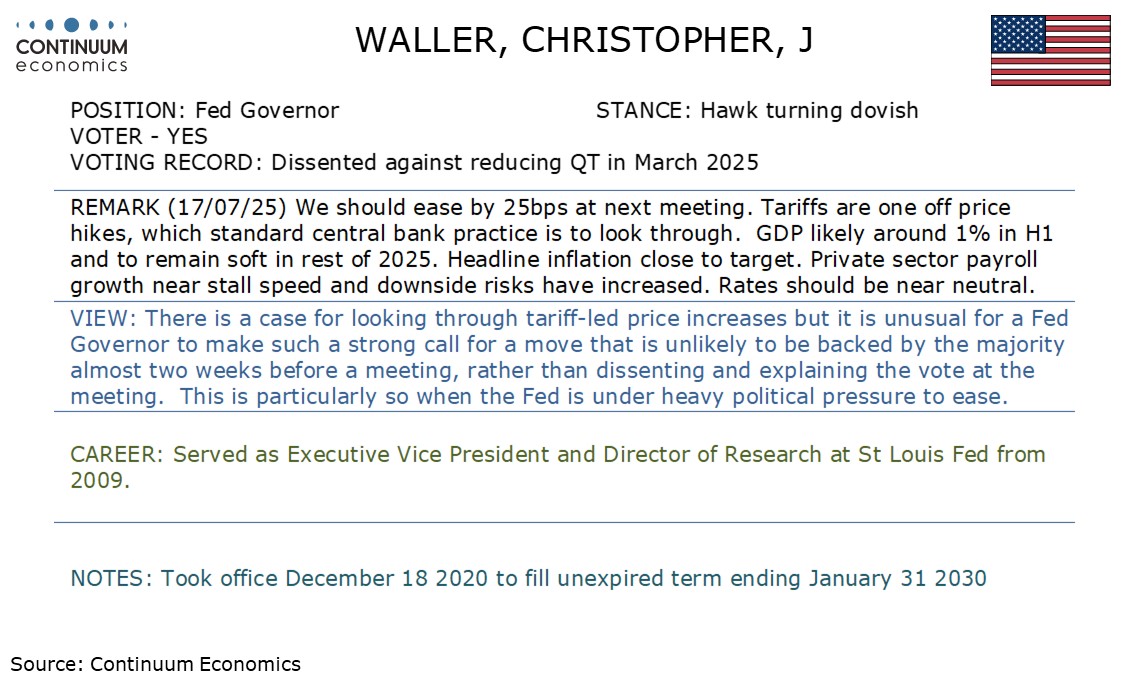
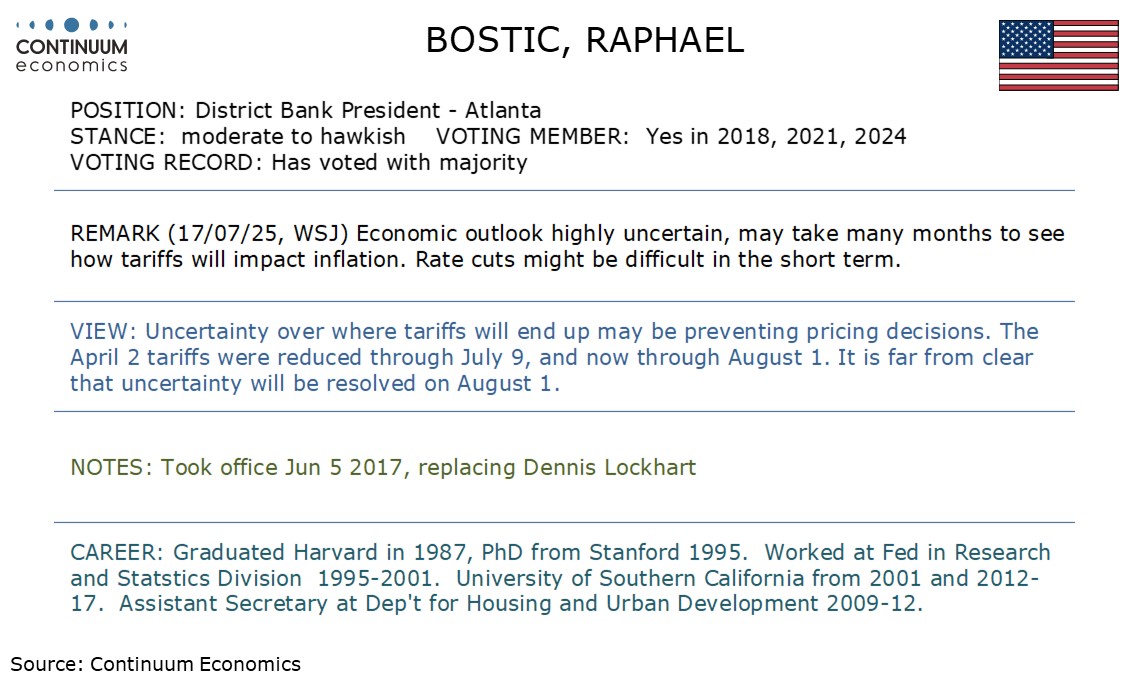
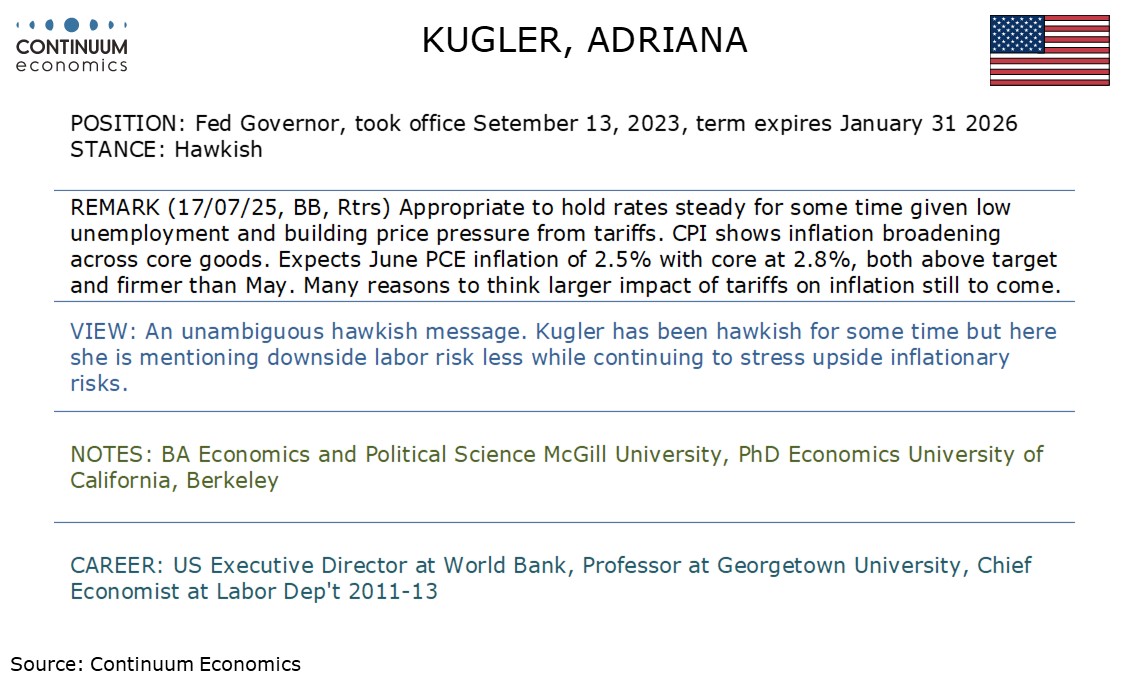
This Week's Fed Speakers
And Slate of U.S. Data Showing Limited Tariff pass-through
China: GDP Resilient in Q2
UK Services Inflation Fails to Fall Further
Figure: August 1 Reciprocal Tariffs (%)
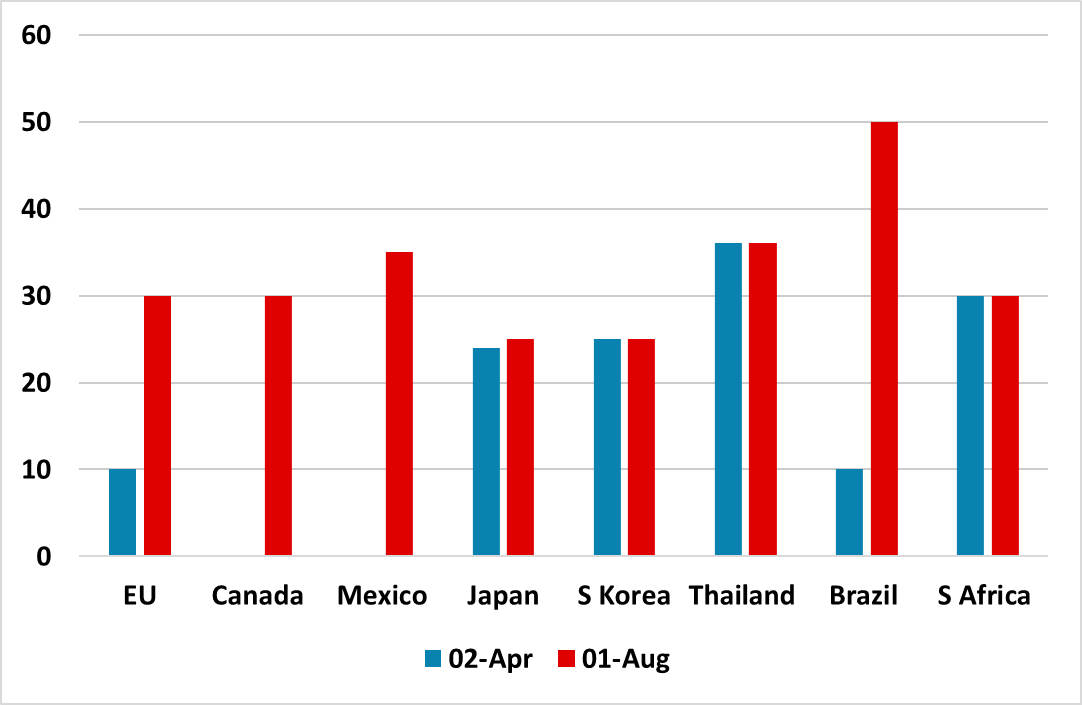
The assumption in financial markets is that some trade framework deals will be done by August 1; some countries will make enough progress to be given an extra 30 days and some countries could have higher tariffs implemented. This would be broadly consistent with the average 15% tariff that is widely expected by market. However, negotiations will be difficult and if the EU/Canada or Mexico were hit with 30% from August 1, or China from August 12 then this could open the alternative scenario or high teens average and a worse growth/inflation trade off that could wake markets from its summer doldrums.
Trump’s new flurry of letters to 25 countries has not prompted much adverse market reaction. The assumption in financial markets are that some deals will be done by August 1; some countries will make enough progress to be given an extra 30 days and some countries could have higher tariffs implemented. Such an outcome would be consistent with the Trump administration approach, with Vietnam and now Indonesia agreeing an in principle deal; India and Taiwan not getting August 1 deadline so far and the fact that the 90 day reciprocal tariff deadline has been delayed by a further 3 ½ weeks. This could all still be a path towards average 15% tariff rate. The 100% secondary tariff threat from early September against countries trading from Russia is also expected to be negotiated away or diluted or delayed.
The 25 countries are a contrast in bilateral trade positions with big surpluses for some countries (Figure), but 16 countries with small trade surpluses of less than USD10bln or trade deficit with the U.S. Some of these were likely chosen for perceived left wing policies and/or right wing restrictions (e.g. Brazil and S Africa), others could be a warning to others to do a deal with the U.S. (e.g. Bosnia/Serbia/Sri Lanka) and six likely targeted to reduce the trade imbalance.
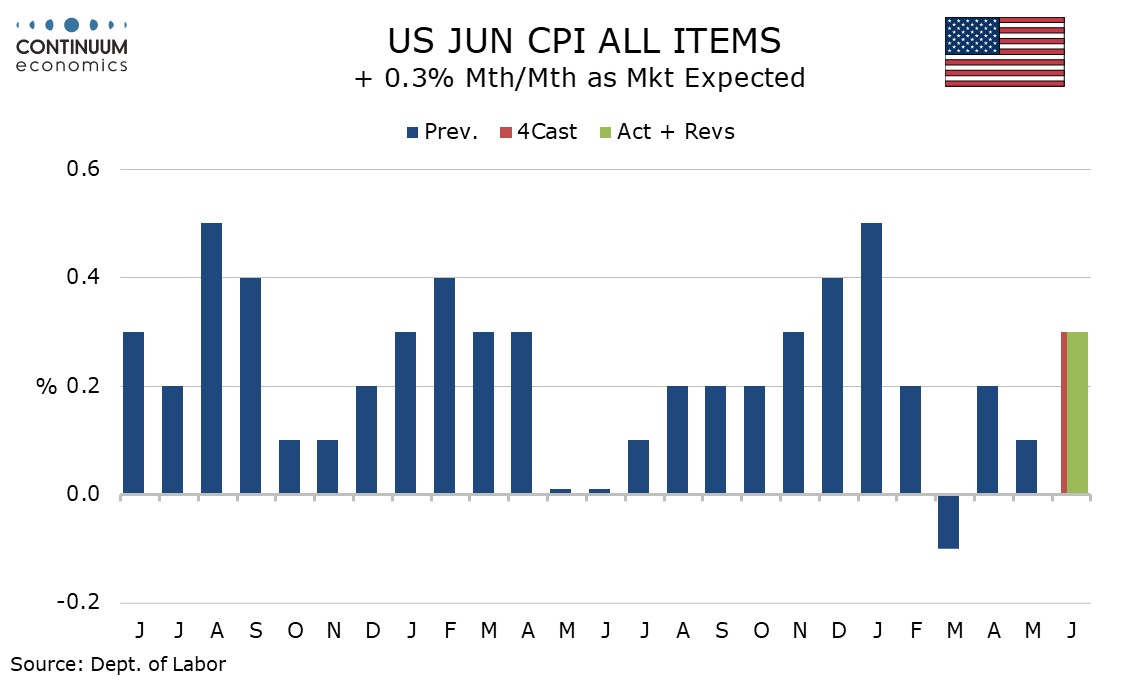
June core CPI at 0.228% before rounding is on the low side of expectations and still shows a limited, though not zero, feed through from tariffs. Moderate gains in food and energy lifted overall CPI to a 0.3% increase, with the gain rounded up from 0.287%. Trump will use this data to argue for Fed easing though uncertainty over the tariff picture argues for a wait and see stance from July’s meeting. Commodities less food and energy rose by 0.2%, despite continued weakness in autos as new vehicles fell by 0.3% and used vehicles fell by 0.7%. This means some strength elsewhere, though a 0.4% rise in apparel needs to be seen alongside a 0.4% decline in May. Still, this is the strongest rise in commodities ex food and energy since February.
Shelter less energy rose by 0.3% after a 0.2% increase in May. Medical care services were firm at 0.6% while transportation services at 0.2% reversed a May decline. Airline fares at -0.1% and auto insurance at +0.1% were virtually unchanged following recent respective weakness and strength. Shelter rose by 0.2% restrained by a 2.9% fall in volatile lodging away from home. Owners’ equivalent rent rose by 0.3%.
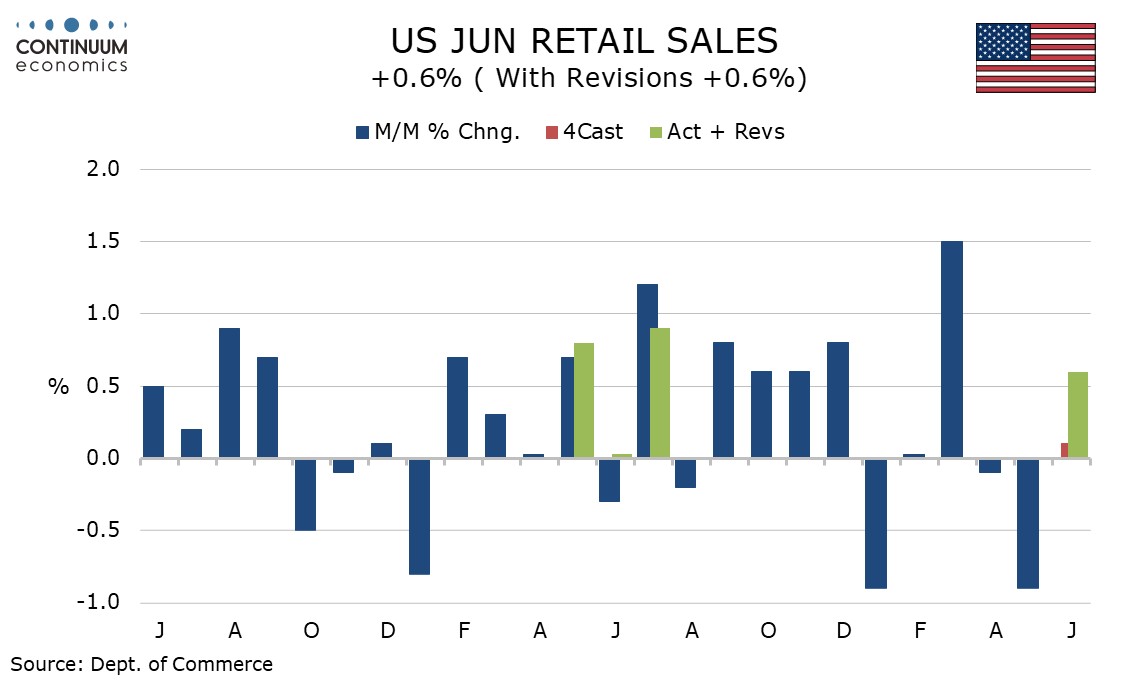
The latest US data presents a picture of an economy regaining some momentum as tariff fears fade, at least temporarily. June retail sales with gains of 0.6% overall and ex auto and gas, with ex autos and the control group which contributes to GDP both up 0.5%, ended Q2 on a firm note. July’s Philly Fed manufacturing survey at 15.9 from -4.0 turned positive, as did Empire State data on Tuesday, while initial claims at 221k from 228k saw a fifth straight decline, in the survey week for July’s payroll. The retail sales gain was broad based with few components standing out strongly. The gain fails to fully erase a 0.9% May decline, which followed a 0.1% decline in April, while sales ex autos and gasoline were near flat in April and May. This suggests a recovery in consumer sentiment in June after the hit equities took on tariff risks in April.
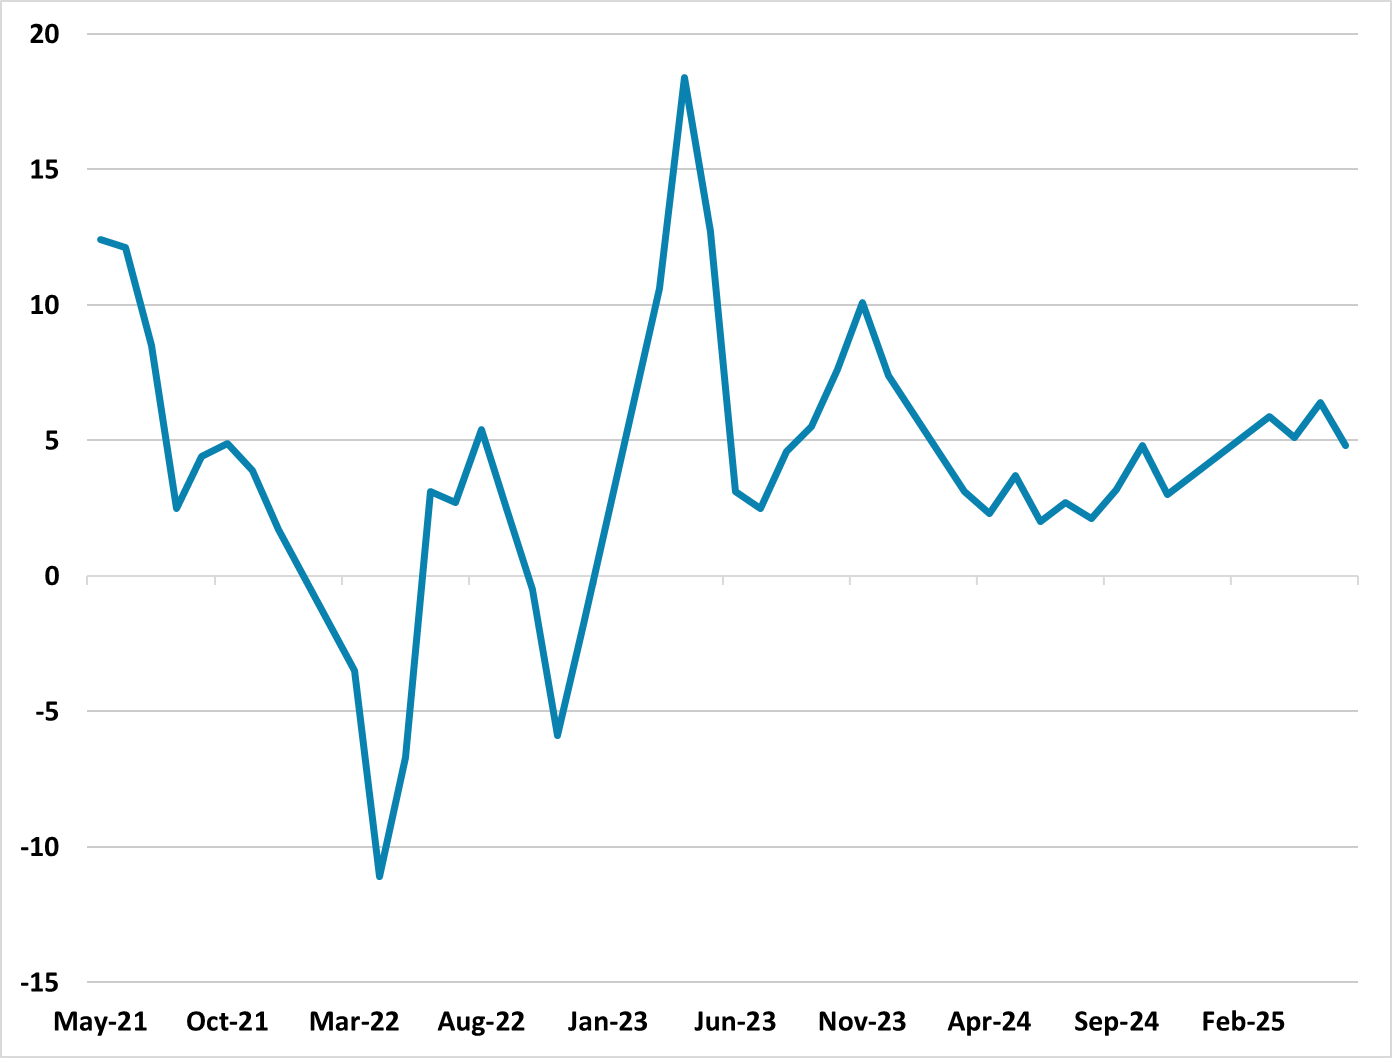
Figure: Retail Sales Yr/Yr (%)
We do see H2 weakness relative to H1, as exports to the U.S. will slow again and the effects of the government consumption trade in programs fades. However, H1 has been higher than our forecasts and thus we are revising 2025 GDP growth to 4.8% v 4.4% previously. We keep 2026 GDP growth forecast at 4.5%. The latest China data shows GDP in Q2 stronger than expected at 5.2%, but an unbalanced economy in June moving towards Q3. The 1.1% real GDP rise in Q2 reflects resilience of net exports outside of the U.S.; some rebound in exports to the U.S. late Q2 after the trade truce and government investment spending. Private investment spending remains weak, with June fixed investment at a low 2.8% Yr/Yr YTD and residential property investment at -11.2% Yr/Yr YTD.
Consumer spending also contributed to Q2 GDP growth according to NBS, but this is due to the government trade in programs that continue to boost some retail sales categories in June – Household and communication appliances up +32.4% and 13.9% respectively. Other areas of retail sales were soft, with a number of categories declining Yr/Yr. The key eating out slowed to +0.9% Yr/Yr, which reflects the underlying nervous mood among households that are uncertain about employment/income and housing wealth. Industrial production in June at 6.8% was stronger than expected helped by high tech manufacturing. However, this may not be sustained, with the underlying softness in domestic demand that is causing noticeable disinflation. The GDP deflator was negative for the 9th quarter in a row and thus nominal GDP is modest by China’s standards.
Figure: June Inflation Surprises on the Upside and Broadly so
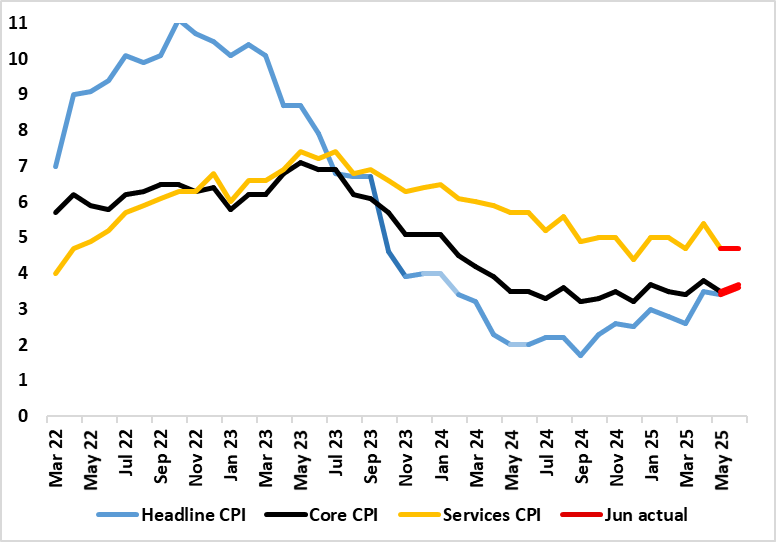
Calendar effects have been accentuating swings in UK CPI data of late and these may have reoccurred in the June numbers partly explaining June numbers which surprised on the upside. Indeed, June saw the headline and core rise a further 0.2 ppt – the former to an 18-mth high of 3.6%. Moreover, services were steady as opposed to the expected slowing, this possibly an aberration in and around airfares that may reverse in the next set of data. Despite the June headline being some 0.3 ppt above BoE thinking, we do not think this will rule out a rate cut next month, albeit with a split MPC. This is unless tomorrow’s labor market data provides cause for concern, but where alternative insights to ONS data regarding the labor market are very pointing to rising spare capacity, a factor very much affecting BoE thinking!
Food price inflation which picked up to a 16-mth high of 4.5% may be a growing concern for the BoE both for its impact of spending power and on inflation. The question is whether this may be a poor UK harvest or shops passing on recent NIC hikes. But real economy and labor market weakness, allied to fiscal concerns may be even bigger worries for the BoE. Admittedly, the slight increase in the headline rate into June 2025 reflected upward contributions from seven (of the 12) divisions, partially offset by downward contributions from three divisions. The largest upward contribution came from transport, particularly motor fuels. There were also upward effects from air fares, rail fares, and maintenance and repair of personal transport equipment.