Continuum Economics
  • Search
  • About Us
  • Buy
  • Invite A Friend
  • My Basket
  • Articles
  • Calendar
  • Forecasts
  • Events
  • Data
  • Newsletters
  • My Alerts
  • Community
  • Directory
  • About Us
  • Buy
  • Invite A Friend
  • My Basket
  • Articles
    • All
    • Thematic
    • Tactical
    • Asia
    • EMEA
    • Americas
    • Newsletters
    • Freemium
    • Editor's Choice
    • Most Viewed
    • Most Shared
    • Most Liked
  • Calendar
    • Interactive
      • China
      • United States
      • Eurozone
      • United Kingdom
    • Month Ahead
    • Reviews
    • Previews
  • Forecasts
    • Forecasts
    • Key Views
  • Events
    • Media
    • Conference Calls
  • Data
    • Country Insights
    • Shadow Credit Ratings
    • Full CI Data Download
  • Newsletters
  • My Alerts
  • Community
    • FX
    • Fixed Income
    • Macro Strategy
    • Credit Markets
    • Equities
    • Commodities
    • Precious Metals
    • Renewables
  • Directory
  • My Account
  • Notifications Setup
  • Account Details
  • Recent Devices
  • Distribution Lists
  • Shared Free Trials
  • Saved Articles
  • Shared Alerts
  • My Posts
Published: 2024-03-21T14:06:55.000Z

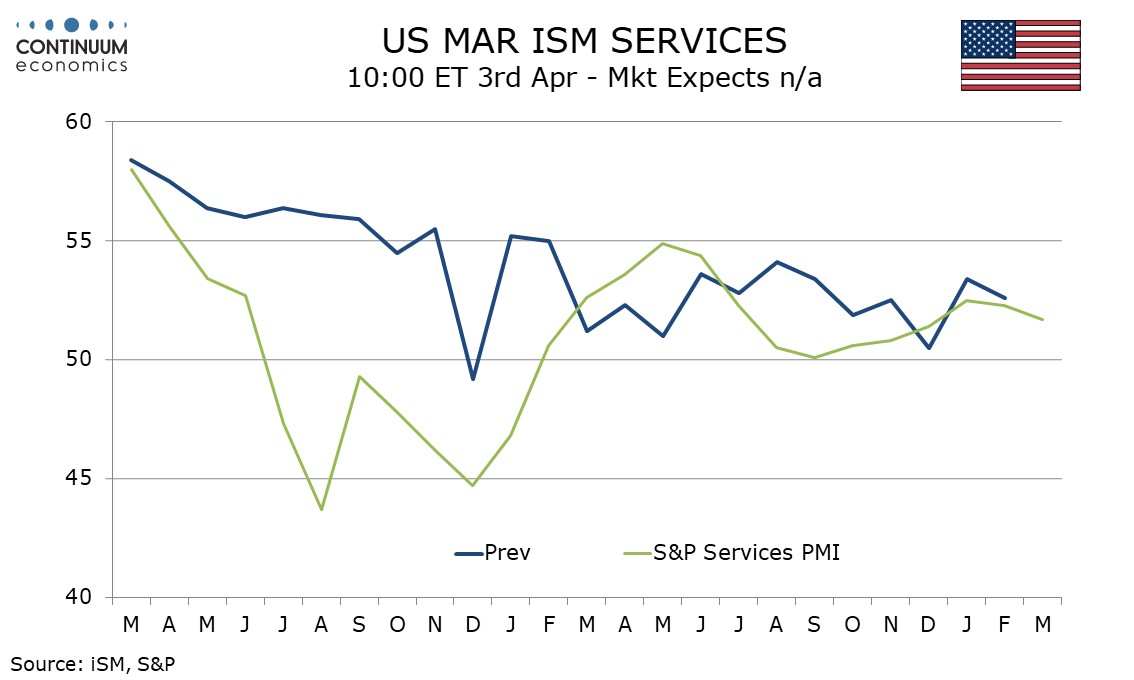
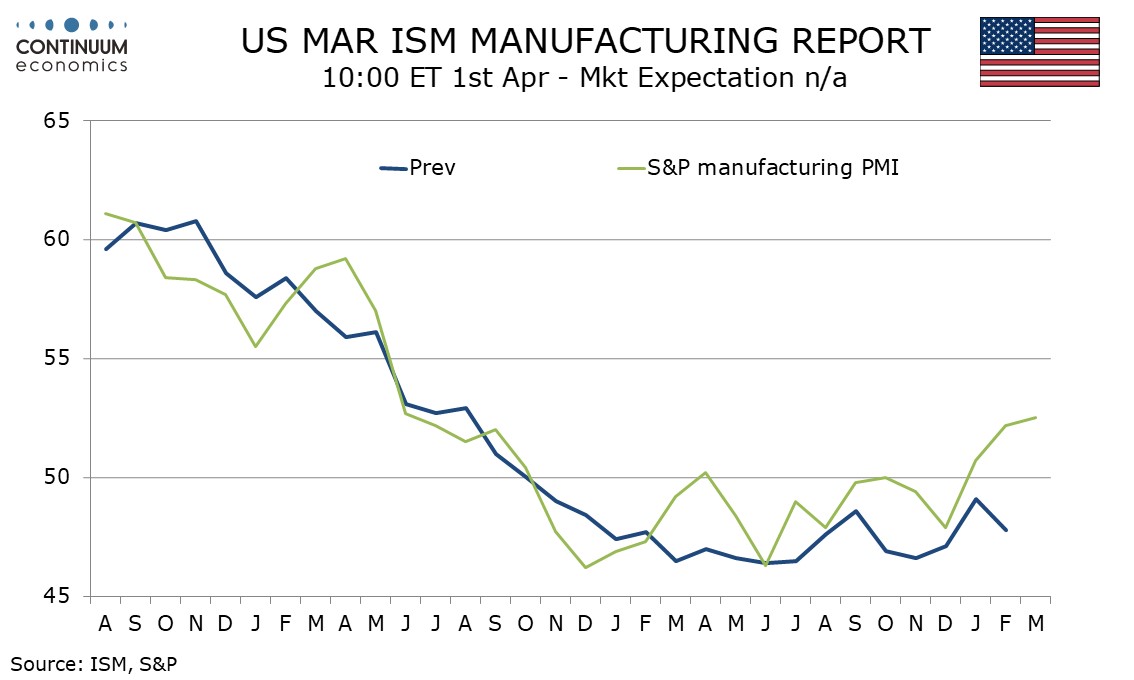
U.S. March S&P PMIs - Manufacturing accelerating, services losing momentum

byDave Sloan

Senior Economist , North America
1

March’s preliminary S and P PMIs provide a mixed message, with improvement in manufacturing unexpectedly continuing, but some loss of momentum in services. 

The manufacturing index at 52.5 from 52.2 is a third straight improvement and the strongest since June 2022. The February improvement contrasted some softening in the ISM manufacturing index though most regional surveys improved in February, while mostly remaining negative. One regional survey that was positive in February, the Philly Fed’s, has remained so in March, though the Empire State index weakened. Overall the signals for March ISM manufacturing data look positive.

The S and P services index is not well correlated with its ISM counterpart. It does however appear responsive to moves in bond yields with a slide to a low of 50.1 in September before seeing four subsequent gains to 52.5 in January. This month’s dip to 51.7 from 52.3 is a second straight dip and appears to be responsive to renewed gains in bond yields after recent strong data.

Continue to read the article for free
Login

or

or

Topics
Data
Foreign Exchange

GENERAL

  • Home
  • About Us
  • Our Team
  • Careers

LEGAL

  • Terms and Conditions
  • Privacy Policy
  • Compliance
  • GDPR

GET IN TOUCH

  • Contact Us
Continuum Economics
The Technical Analyst Awards Winner 2021
The Technical Analyst Awards Finalist 2020
image