This week's five highlights
Bank of Canada Eases Again Given Increased Confidence in Inflation
China Surprise 7 Day Reverse Repo Rate Cut
US Q2 GDP exceeds expectations
The Turn in USD/JPY
UK Household Wealth and the Pension Predicament
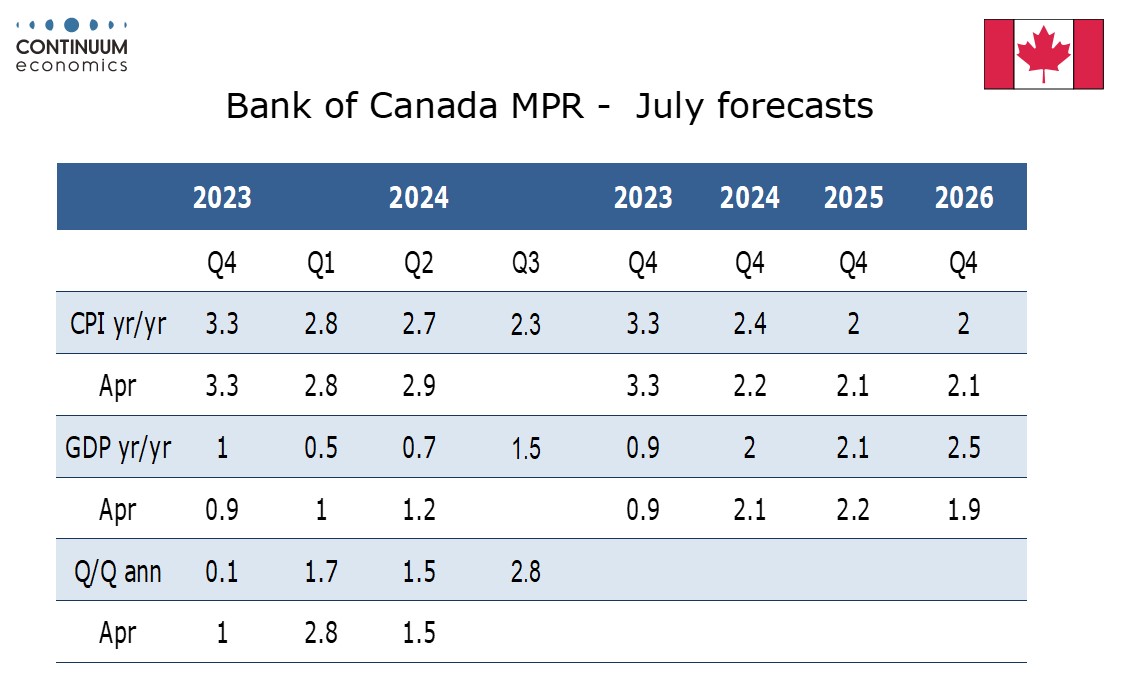
The Bank of Canada has delivered a second straight 25bps easing to 4.50% and Governor Tiff Macklem stated there was a clear consensus behind the decision. The BoC’s tone was generally dovish despite looking for stronger GDP growth going forward. We now expect 25bps easings at each of the remaining three meetings this year, and 100bps of easing in 2025, which would see the rate at a neutral 2.75% at the end of 2025. Despite the recent progress on inflation, the accompanying Monetary Policy Report forecasts CPI at 2.4% yr/yr in Q4 2024, up from a 2.2% forecast made in the last MPR released in April. 2025 and 2026 have however both been revised down to an on-target 2.0% from 2.1%. The BoC also added forecasts for core CPI, which match the headline CPI forecasts in each of the three years. It was known that GDP fell short of the BoC’s expectation for Q1 and the BoC has left its Q2 forecast at 1.5% annualized. However GDP has been revised only marginally lower to 2.0% yr/yr from 2.1% for Q4 2024, with Q3 seen at a strong 2.8% annualized, which implies a 2.0% annualized pace in Q4. 2025 is seen at a similar 2.1% from 2.2% Q4/Q4 but 2026 is seen at a healthy 2.5% rather than 1.9%.
The statement notes robust population growth of around 3% meaning that potential output is growing faster than GDP, increasing excess supply and producing signs of slack in the labor market. Governor Macklem stated that the economy has more room to grow without increasing inflationary pressures and with inflation getting closer to target upside risks to prices must be increasingly balanced against downside economic risks. While we see the risks of Canada falling into recession as having faded, the economy may struggle to match the BoC’s expectations in the second half of the year. That has us forecasting a 25bps easing in each of the three remaining meetings, which would take the rate to 3.75% at the end of 2024. The BoC is unlikely to continue easing at successive meetings in 2025. One 25bps easing in each quarter of 2025 would take the rate to 2.75%, which is the midpoint of the BoC’s estimate for the neutral range.
Figure: 10yr China- U.S. Treasury Government Bond Spread)
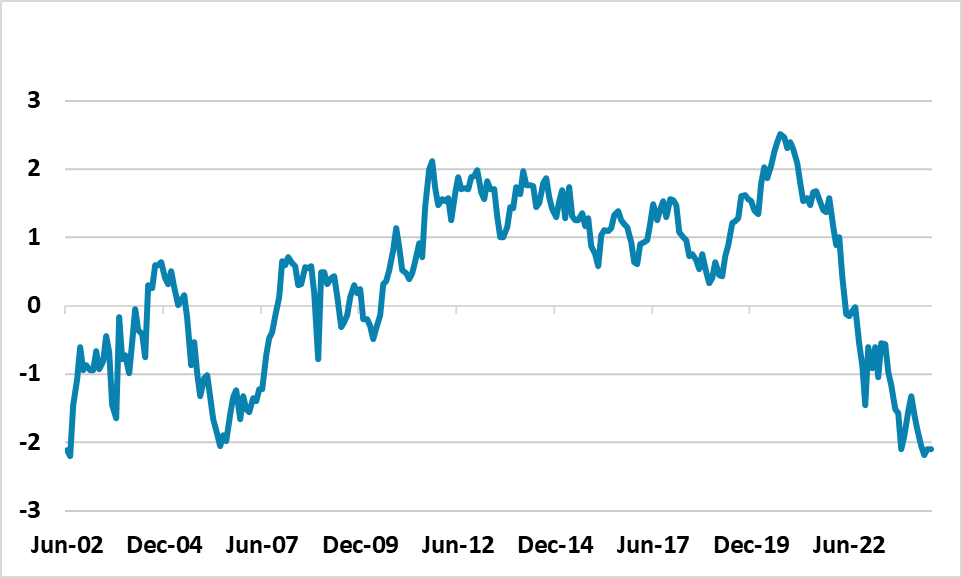
China 10bps cut in the 7 day reverse repo rate and 1 and 5yr Loan Prime Rate (LPR) was sooner than expected, as a move had not been anticipated until the Fed cuts rates. However, this is not the start of a new aggressive policy phase, but rather a tactical move given the targeted nature of easing.
China decision to ease the 7 day reverse repo rate from 1.80% to 1.70% reflects a shift away from the 1yr medium-term lending facility rate as the key policy tool, as it allows more flexibility in timing. A 10bps cut in the 1 and 5 yr LPR rate then also occurred today. A move had not been anticipated until September or October after the 1 cut from the Fed to avoid excessive weakening in the Yuan.
However, the move is likely tactical within the framework of targeted easing, rather than signaling a shift towards aggressive easing. Firstly, the 10bps scale of the move is modest rather than large, while officials have also maintain communications in the wake of the 3 plenum last week that suggests targeted policy action. Secondly, the monetary policy move could be a political signal to actually deliver something from the plenum, given the lack of major announcements. We would expect that the next monetary policy easing will be a 25bps cut in the RRR rate in August or September and then a further 10bps in the 7 day reverse repo rate in Q4.
One alternative is that the rate cut is designed to soften the Yuan before the U.S. election. If Donald Trump is elected then he is likely put pressure on the USD to decline and for the Yuan to appreciate from weak levels. In 2018, China reacted to Trump’s tariff hikes by allowing a weaker Yuan, but China authorities may feel that some Yuan adjustment could be warranted before the U.S. election. We think this could be a consideration and we still look for 7.40 on USD/CNY by end 2024, though we do feel that China authorities would be reluctant to see a quick Yuan depreciation as it could cause domestic capital flight.
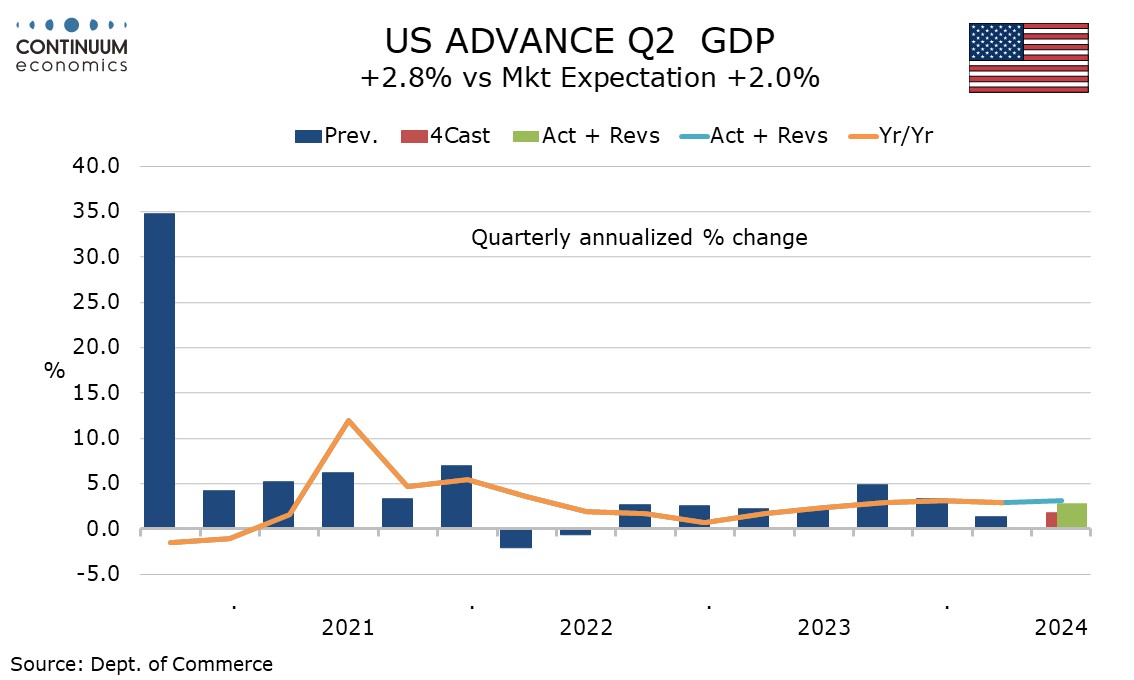
Q2 GDP has come in significantly stronger than expected with a 2.8% increase while core PCE prices are also above consensus at 2.9%, which suggests despite yesterday’s call from former New York Fed President Dudley, a July Fed easing remains very unlikely. Initial claims at 235k from a hurricane Beryl-inflated 245k last week also suggest the labor market remains firm. June durable goods orders unexpectedly plunged by 6.6% on aircraft, but the ex transport rise of 0.5% is on the firm side of trend. This is on balance a firm set of data. The GDP increase is a significant improvement on Q1’s 1.4% though final sales to domestic buyers (GDP less inventories and net exports) saw only a moderate pick up, to 2.7% from 2.4%, though this shows a solid pace in domestic demand persists. Final sales (GDP less inventories) rose by 2.0% so the 0.8% boost from inventories carries some downside risk for Q3. A negative of 0.7% from net exports offset most of the inventory boost, though yesterday’s narrower advance June goods trade deficit restrained the negative somewhat. Exports increased by 2.0% and imports by 6.9%, both similar to their Q1 outcomes.
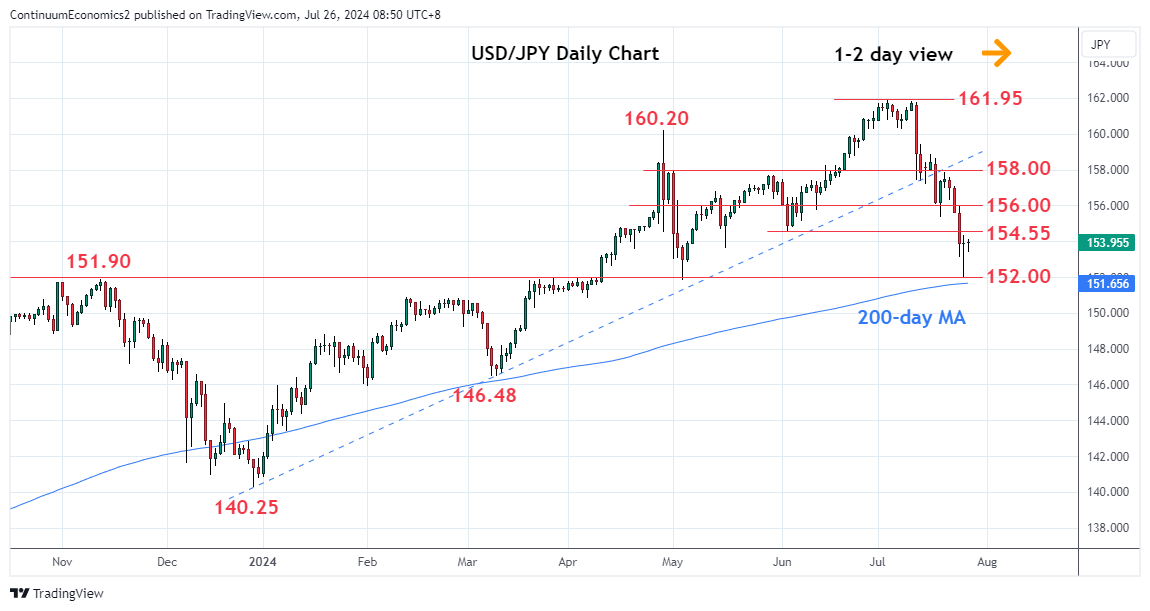
The correction in tech stocks had led to a turn in the USD/JPY. THe turn in USD/JPY is further exacerbated by the contagion to the other two U.S. major equity indexes which brought out haven seeking activity. The JPY has been used as a funding currency for market participants and the reversal also led to another exodus in longs. The spiral may begin the long due correction in the pair especially when the BoJ tightens and Fed eases.
On the chart, USD/JPY rebound at the 152.00 support see prices unwinding deep oversold intraday studies to reach the 154.00/154.55 resistance. Consolidation here expected but break higher cannot be ruled out to unwind the oversold daily studies. Higher will see room for stronger bounce to the 155.37/156.00, previous low and congestion area. Meanwhile, support at the 152.00 level now underpin. However, consolidation here expected to give way to selling pressure later and lower will see room to 151.10, the 50% Fibonacci retracement of the December/July rally.
Figure: Household Net Worth Slumped
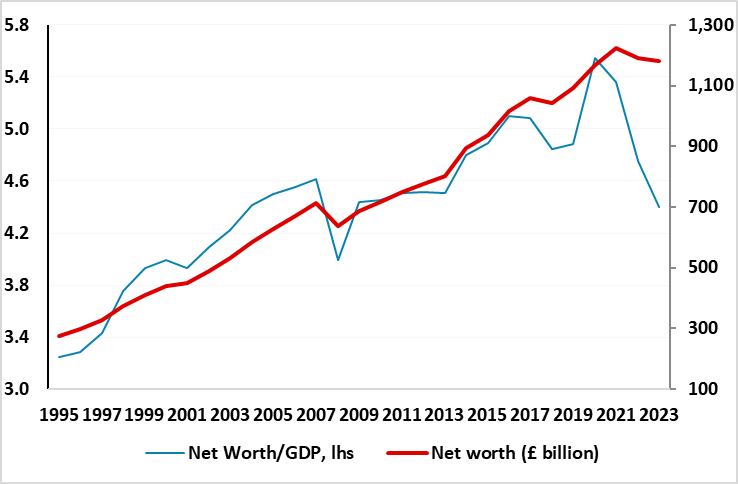
Unlike some other parts of the DM world, UK households have seen a serious dent put into their stock of wealth in the last two years. Indeed, household net worth fell in both 2022 and 2023, both in absolute terms and also as a % GDP (Figure 1). The 2022 drop was very much a slump in pension fund assets as the BoE rate hiking cycle hit government bond prices. It was also a result of a fall back in household savings, after the pandemic induced surge on the previous year or so. The drop in 2023 was more housing market related. But with bond and house prices now on the mend and household saving more, net worth is likely to recover this year. This will have little bearing on most UK households as half of households hold around only 6% of all wealth (Figure 2). They also are more likely to be renting and thus while shielded from higher mortgage rates, but instead are thus exposed to record rental inflation. As for richer households they may benefit from recovering house prices albeit where the link between the latter and consumer spending is far from significant. But the question is whether the unprecedented slump in pension assets (Figure 3) will have any medium-term impacts not just on spending, but even on the supply of labor.
As in all DM countries, wealth in the UK is unevenly distributed, with the richest 10% estimated to hold around half of all wealth, primarily in the form of private pensions and property. In contrast, and as Figure 2 shows, the lower half of the population holds just 6% of all assets. The disparity is regional too with the richest part of the country (the south-east) some three times wealthier than the poorest (north east). Property ownership and property value explains most of the difference in average wealth between these regions. Despite the south east having the highest house prices outside London, those living there are among the most likely to own property (64%). By contrast, those in poorer regions, most notably the North East, were the most likely to live in rented accommodation.