This week's five highlights
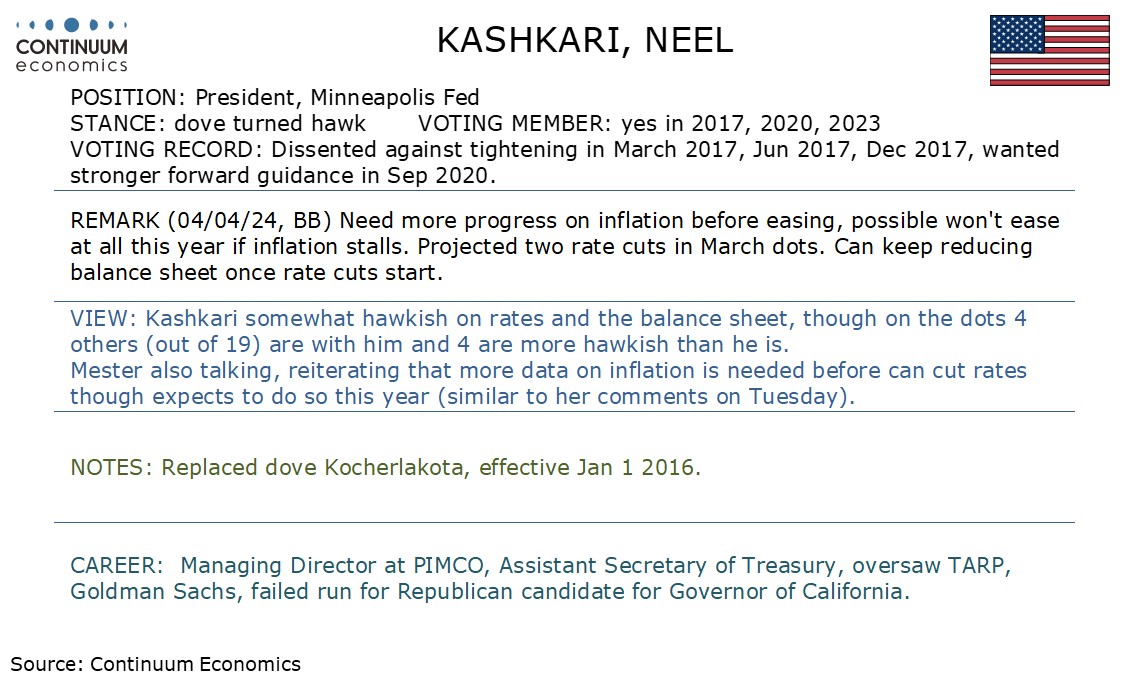
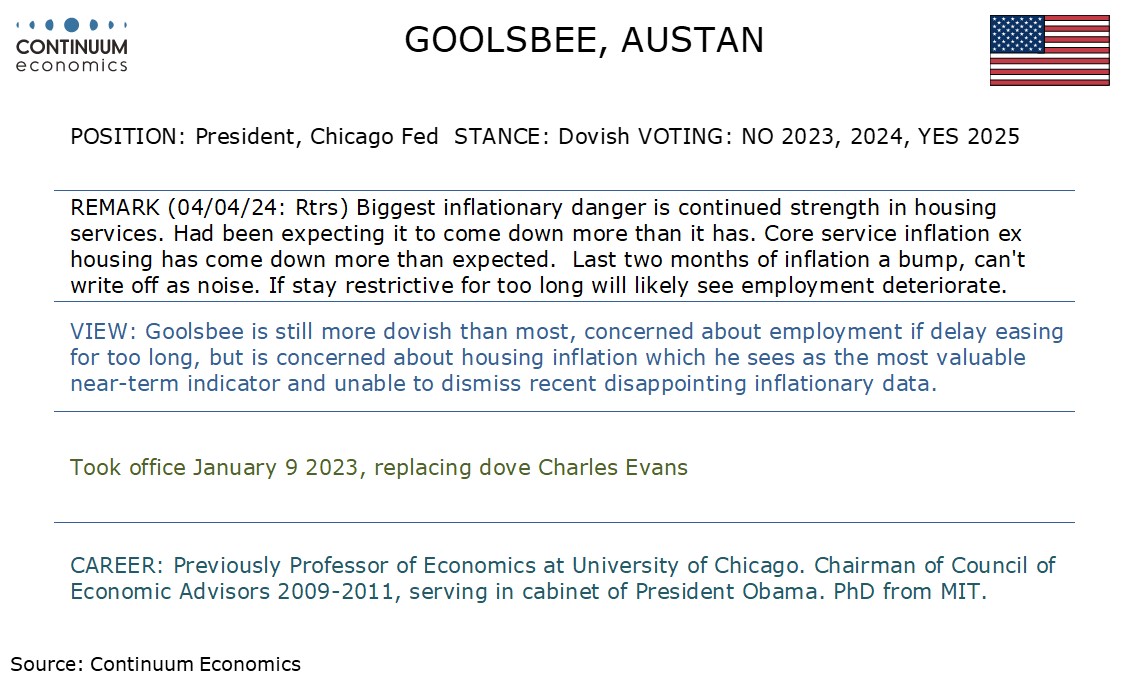
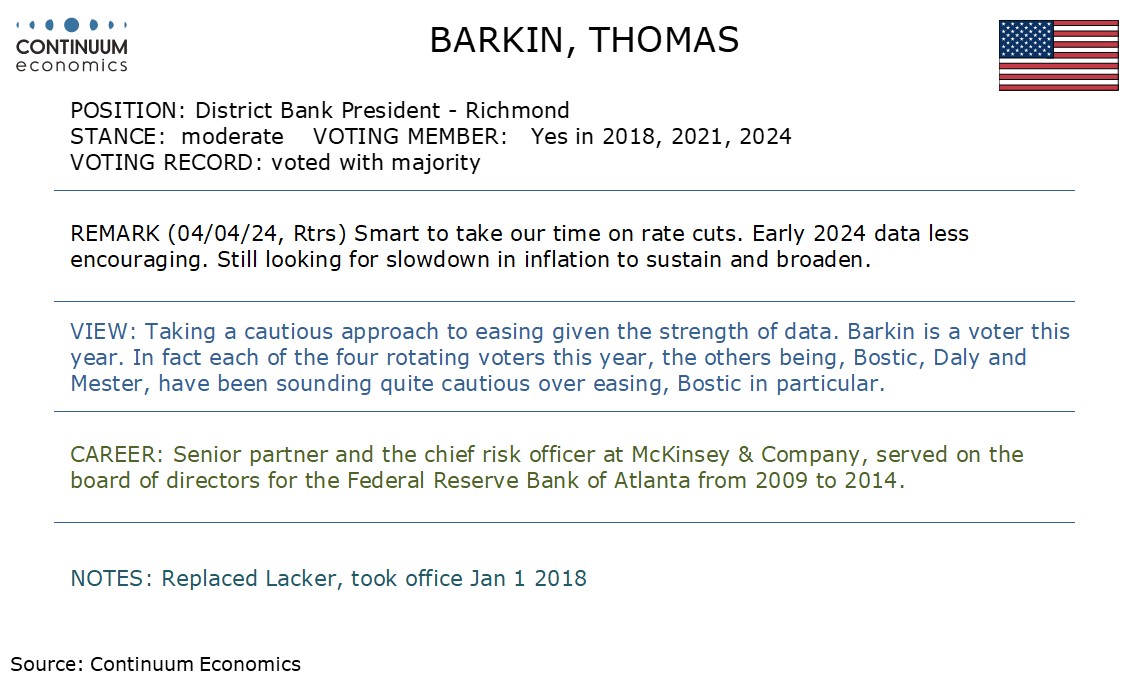
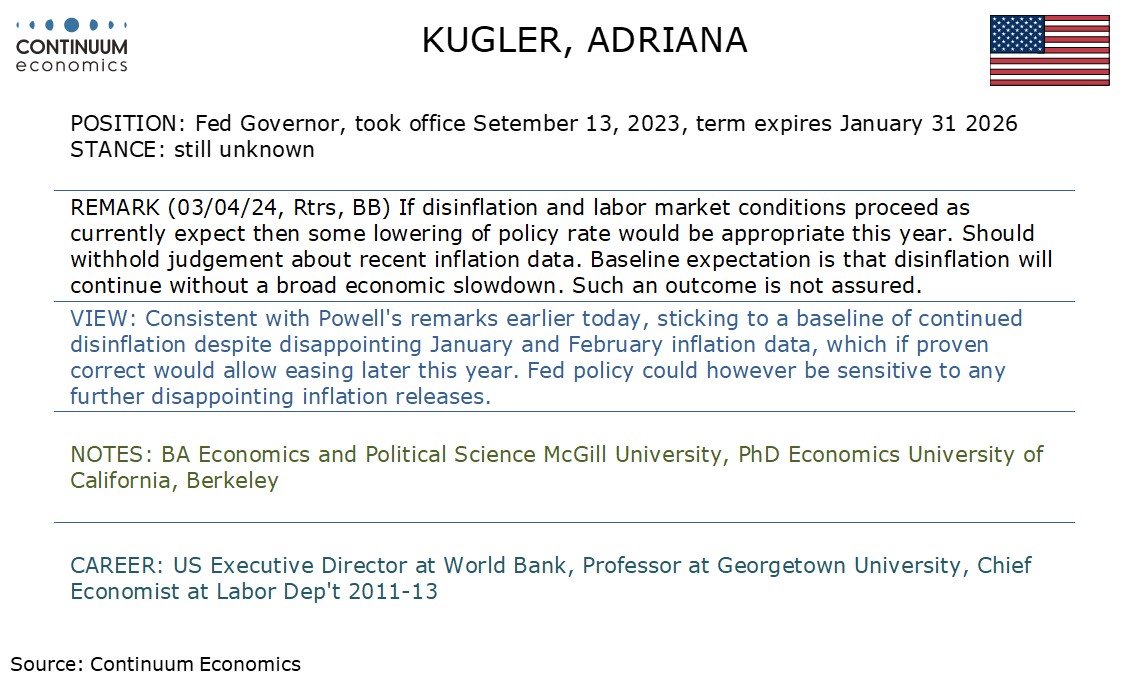
Fed in the Driving Seat Again
USD/JPY Hanging on 151
U.S. ADP Above recent trend
U.S. Non-Farm Payrolls Should be Slightly Slower
EZ Core Disinflation Flattening Out
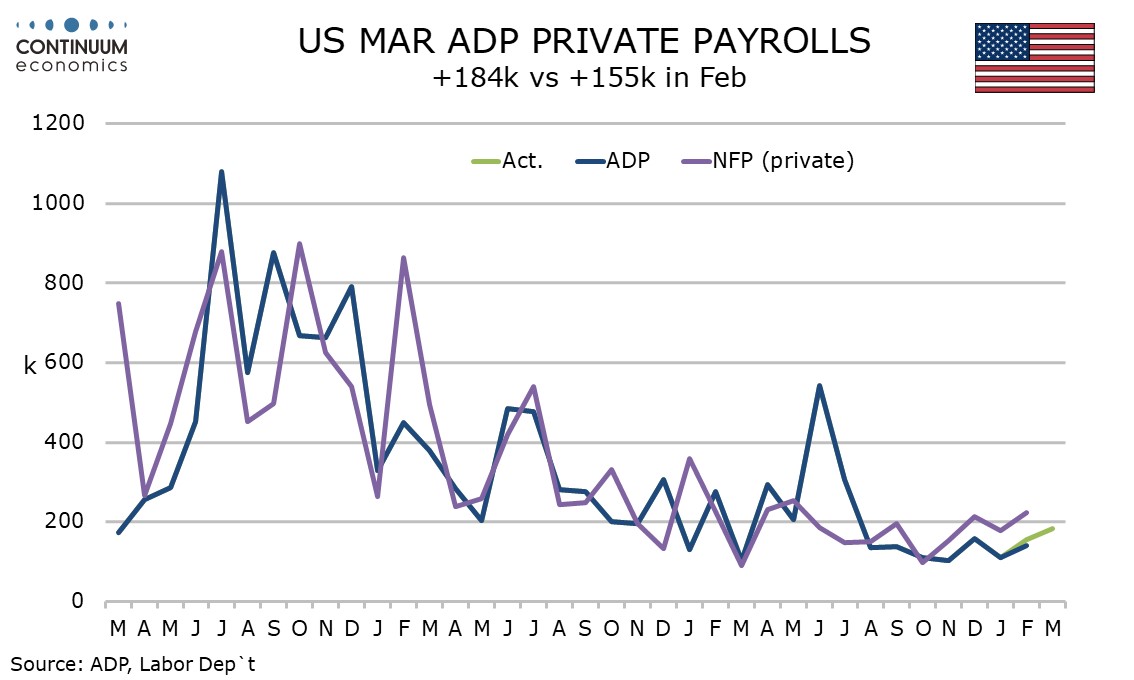
ADP’s March ADP estimate for private sector employment growth of 184k is on the high side of expectations and recent trend and close to our near consensus forecast for private sector payrolls of 180k (we expect overall payrolls to rise by 230k). It is the strongest ADP outcome since July. ADP data has underperformed non-farm payrolls in the last four months and six of the last seven, after sharply outperforming in June and July. It is unclear whether this moderate ADP acceleration is a catch up with payrolls or signaling an acceleration in payrolls. We feel the former is more likely.
In addition to acceleration in job growth, ADP reported a sharp acceleration in wages for job changers, to 10.0% yr/yr from 7.6%, though wages for job stayers remained unchanged at 5.1% yr/yr. The ADP acceleration in jobs is largely due to leisure and hospitality seeing a strong 63k increase, though there was also strength in construction at 33k and trade, transport and utilities at 29k. Education and heath, which has been consistently the strongest component in most recent non-farm payroll releases, was up a modest 17k. March’s payroll may look similar to the ADP data in its headline, but we doubt it will in the detail.
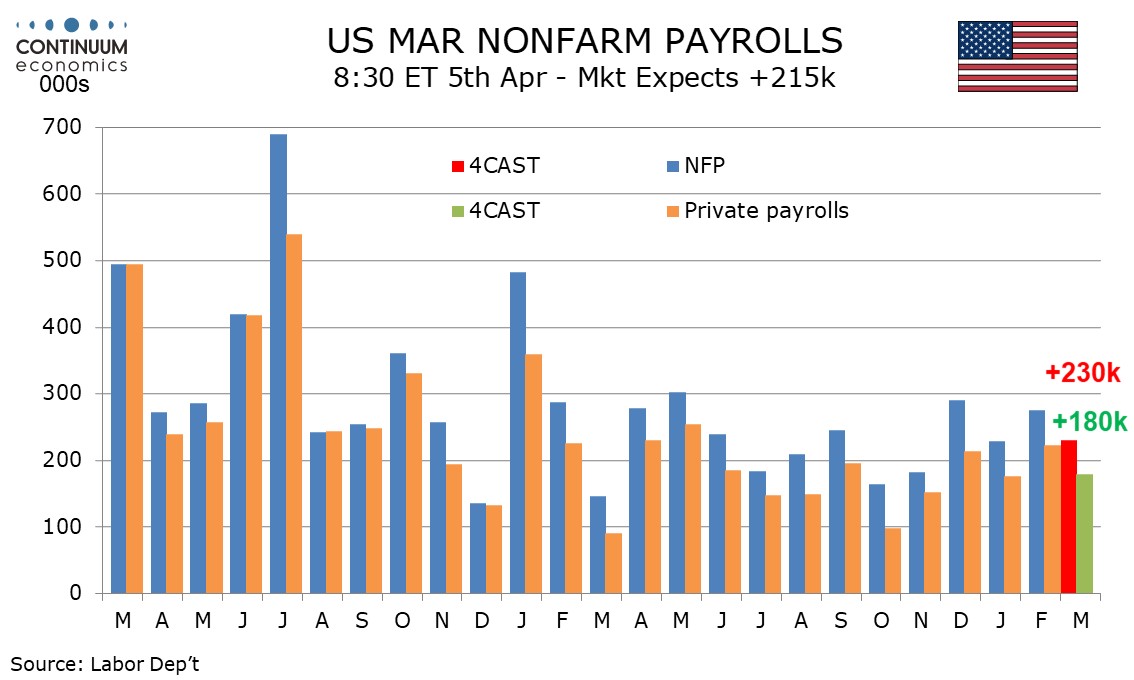
We expect a 230k increase in March’s non-farm payroll, which would be in line with the 6-month average but slightly below the 3-month. We expect a correction lower in unemployment to 3.8% from 3.9% and a moderate 0.3% increase in average hourly earnings. Signals on the labor market remain strong, with initial claims remaining low and labor market perceptions actually picking up in the March consumer confidence report. However a few surveys suggest the economy may be losing a little momentum, so we expect a slightly slower payroll gain than February’s 275k, but there is little reason to expect a break of trend. We expect private payrolls to rise by 180k versus a 223k rise in February, with government remaining strong.
The unemployment rate rose to 3.9% in February after three straight months at 3.7% as the household survey showed employment slipping while the labor force increased. We expect employment to outpace labor force growth in March, moving the rate back down to 3.8%. Average hourly earnings rose by an above trend 0.5% in January and a below trend 0.1% in February, and we expect a 0.3% rise in March. This would see yr/yr growth slowing to 4.1% from 4.3%, to its lowest since June 2021. Trend is a little stronger than 0.3% per month with both January and February data rounded down. That the workweek slipped, probably on bad weather, in January and recovered in February may have inflated earnings per hour in January and restrained February’s data. We expect the workweek to be unchanged in March but with a rise more likely than a fall, which suggests hourly earnings are more likely to be below than above trend. Our forecasts for employment and the workweek would leave aggregate hours worked up by a modest 0.6% annualized in Q1, versus 1.4% in Q4 and 1.5% in Q3, hinting at slower GDP growth after two strong quarters but if productivity remains firm growth should remain respectable.
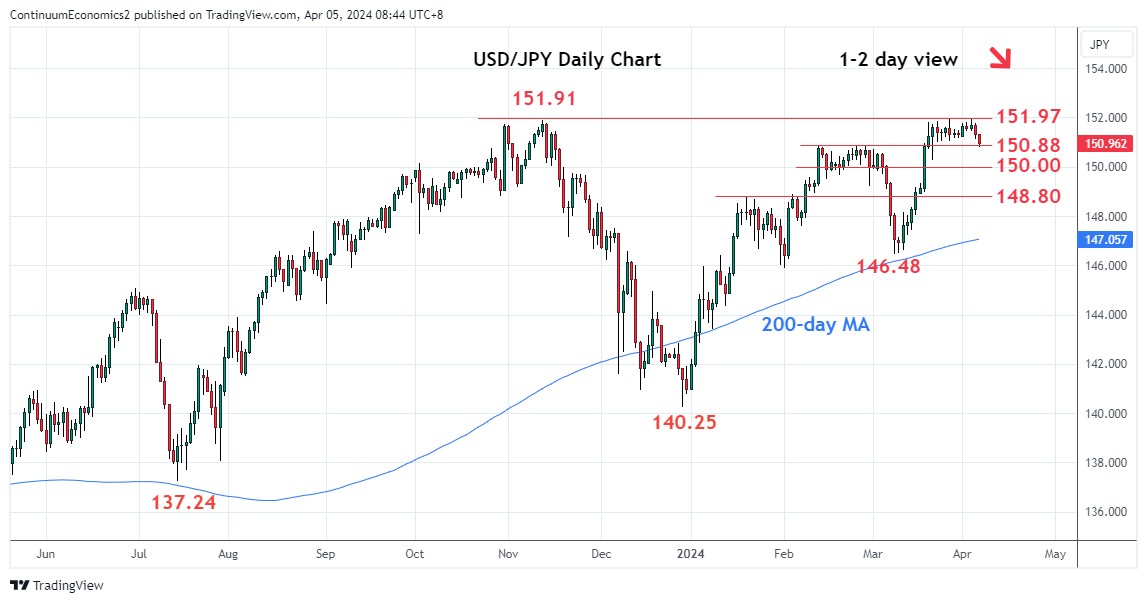
Ever since BoJ exited negative interest rate, USD/JPY has been hovering above 150 with no signs of exhaustion. Multiple rounds of verbal intervention and the subsequent escalation in rhetoric barely kept the USD/JPY bulls in check but it does not suggest and imminent fall as intervention are still not visual. The last move in USD/JPY was triggered by market participants seeking haven when geopolitical tension flares up. It suggest the future trigger in USD/JPY will very likely be led by risk behavior.
On the chart, USD/JPY is under pressure as consolidation below the 151.91/151.97 highs gives way to selling pressure to retest the 151.00/150.88 support. Negative daily studies suggest scope for break here to open up deeper pullback to the 150.00 level which is expected to underpin and limit corrective pullback. Failure, if seen, will open up strong support at 148.80 and 148.00. Meanwhile, resistance at the 151.97 high and the 152.00 level now seen capping. Break here, if seen, will extend the underlying bull trend and see scope for extension to the 153.00/35 congestion from June 1990.
Figure: Headline and Core Inflation Falling Further
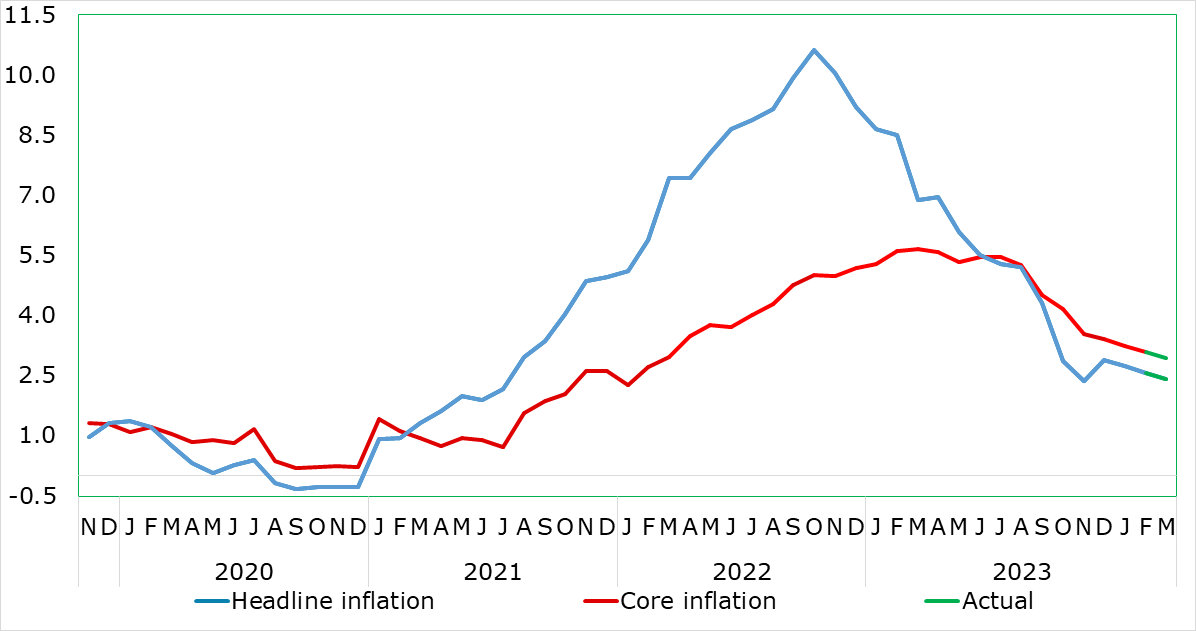
Very much having affected ECB thinking, there has been repeated positive EZ news in the form of falling inflation and somewhat broadly so. This continued in the March HICP numbers, with the 0.2 ppt drops in both headline and core being a notch more sizeable than most anticipated. Regardless, the headline, at 2.4%, continued its recent decline although the latest core (2.9%) exceeded the ECB Q1 projection of 3.0% by 0.1 ppt. Somewhat disappointedly, the latter did not encompass more discernibly softer y/y services inflation, its rate at 4.0% for a fifth month running. This is notable as the ECB has been somewhat troubled by the failure of services inflation to have fallen in the last few months, and its apparent stability may harden some of the hawks worries about aspects of price resilient not least as monthly adjusted numbers have also shown some fresh resilience, if not revival, notably on a core basis. The data do not make the case for rapid ECB easing any greater; we still see three 25 bp cuts this year.
Dominated by a further fall in food inflation, March saw services stay at 4.0% in y/y terms, but with core goods helping take the core down in turn. The upside risks from fuel prices and from rents/eating out may also have been behind the slightly firmer than expected services numbers. Regardless, possibly encompassing added volatility from the early Easter this year, and despite the rise in oil prices of late, we still envisage that the headline now hit target us in summer 2024, well over a year earlier than the ECB envisages, and then undershoot through 2025, while the core should continue to fall in the interim regardless.
There are ever-clearer signs of soft underlying inflation at least in terms of non-energy goods and also in terms of persistent price pressures which are now running around the 2% target on an overall basis and even more so for core measures. However, there are signs that such underlying measures have stopped falling, not least on the ECB’s preferred short-term inflation indicator. Moreover, services inflation has not fallen in y/y terms, a stability seen in seasonally adjusted m/m numbers, the question is whether this is true price persistence linked to high wages or reflection of one-off factors such as indirect tax moves. At this juncture, this is still something we think this is more noise than fresh trend but will continue to monitor closely.