This week's five highlights
ECB Under-Estimating Downside Risks
U.S. August Core CPI at a four month high led by shelter and air fares
U.S. August PPI Ex Food, Energy and Trade a little too high for comfort
UK GDP a More Mixed Messages Give BoE Food for Thought
More of the Same or Game changing Policies for China Equities
Figure: ECB Downgraded Outlook Still Too Rosy?

That the ECB cut the discount rate again by another 25 bp (to 3.5%) was no surprise. Neither was an unchanged tone at the press conference, with no clearer acknowledgment of downside risks even given ECB GDP projections (Figure) which moved down more toward our long-standing below-consensus thinking. In turn this helped reinforce the ECB view that HICP inflation would move below 2% in 2025 and stay there. Equally unsurprising, there was nothing like any firm pointer to the speed and/or timing of further moves. But as these projections are based on market rate thinking which envisages the discount rate close to 2% into 2026 (), it thereby endorses such thinking too. Moreover, given the stimulus that the circa-40 bp drop in market rates should have brought to the economic outlook, the downward revision the GDP outlook is notable. It suggests that the ECB’s unchanged assessment of downside risks is misplaced as those risks may even have materialized.
This 25bp discount rate reduction came alongside larger reductions to the two other and now lower-profile policy rates thereby fulfilling a shift in the Eurosystem’s operational framework that was laid out six months ago. The array of cuts was well flagged despite the alleged meeting-by-meeting guidance the ECB has underscored it is still using; after all, even the hawks on the Council had conceded that the discount rate can (and maybe even should) fall at this juncture. Indeed, the decision this time was unanimous, this implying that the thinking behind the dissent to the June easing has been reassessed!

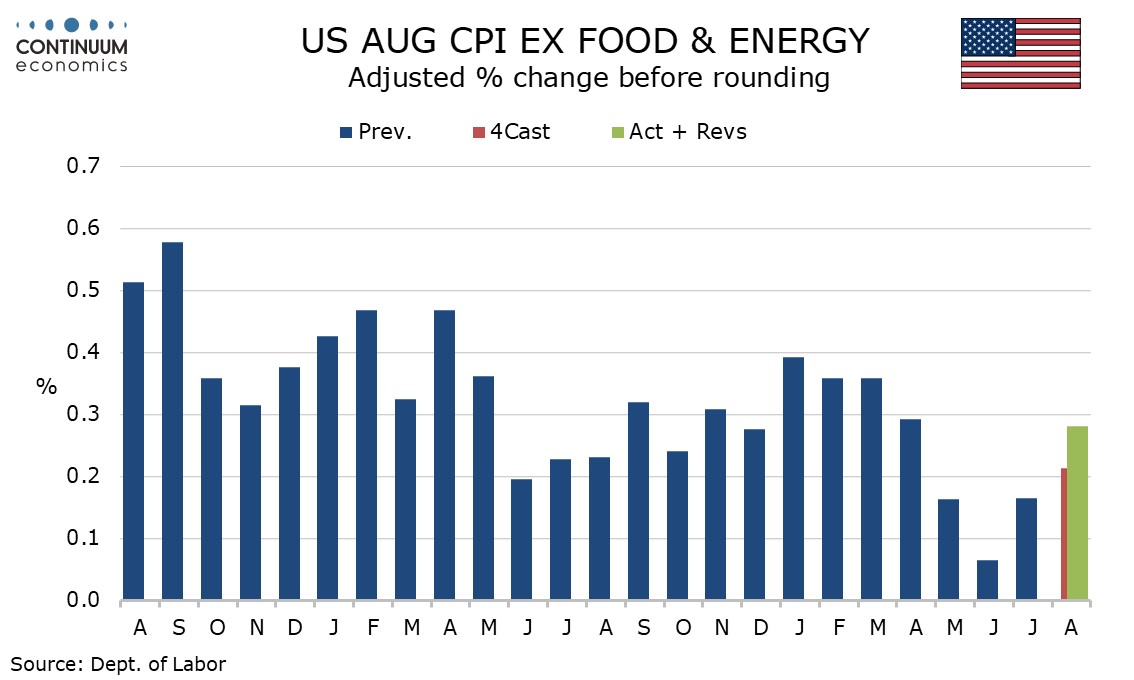
August core CPI has disappointed to the upside with a 0.3% rise ex food and energy with the rise being 0.28% before rounding, a four month high. Overall CPI rose by 0.2% as expected, and by 0.19% before rounding. The data is likely to ensure that the FOMC eases by only 25bps in September. Shelter and air fares were the most obvious contributors to the upside surprise in the core rate. Commodities less food and energy remained soft with a 0.2% decline with used autos still soft at -1.0% if less weak than in July. Apparel corrected a 0.4% July decline with a 0.3% increase. Food rose by a modest 0.1% while gasoline fell by a modest 0.6%, while overall energy fell by 0.8%.
Commodities less food and energy remained soft with a 0.2% decline with used autos still soft at -1.0% if less weak than in July. Apparel corrected a 0.4% July decline with a 0.3% increase. Food rose by a modest 0.1% while gasoline fell by a modest 0.6%, while overall energy fell by 0.8%. Air fares with a 3.9% increase were another area of strength but this looks corrective from three straight declines. On the downside, medical care services fell by 0.1%, a second straight decline.

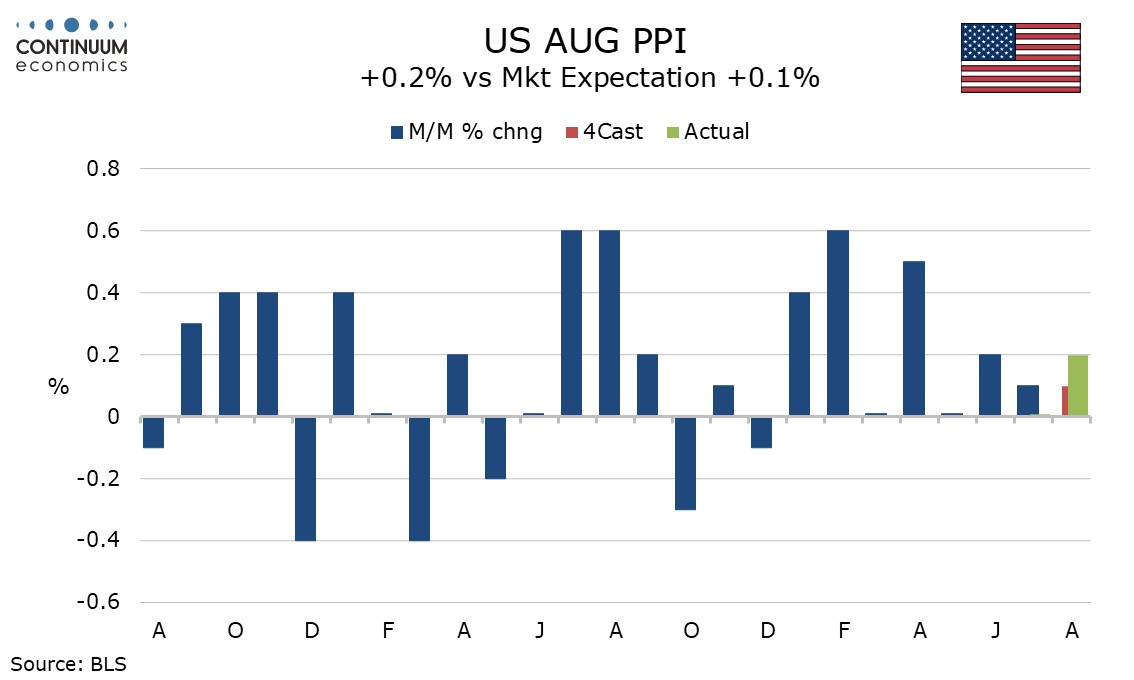
Like the CPI, August PPI was on the firm side of expectations, up by 0.2% overall and 0.3% in both the core rates, ex food and energy and ex food, energy and trade. The data confirms that while inflation has fallen significantly, it is not yet consistent with target. Initial claims provided few surprises, up a modest 2k to 230k. The details look similar to the CPI with food up a marginal 0.1% and energy falling by a modest 0.9%. Goods ex food and energy showed a second straight modest 0.2% increase while services increased by 0.4%, with trade up 0.6%, transportation and warehousing down by 0.1% and other services up by 0.3%.
A 0.3% rise ex food and energy does not look too concerning coming after a 0.2% decline in July, though July’s weakness was largely due to a correction lower in trade from a strong June. Ex food, energy and trade services saw a second straight 0.3% rise, and that is disappointing. Yr/yr PPI slipped to 1.7% from 2.1% as year ago strength in energy dropped out but ex food and energy rose to 2.4% from 2.3% and ex food, energy and trade rose to 3.3% from 3.2% and that is a little too high for comfort. Yr/yr PPI ex food, energy and trade PPI has been above 3.0% for five straight months after having spent the preceding eleven straight months marginally below 3.0%.
Figure: UK Momentum Ebbing?

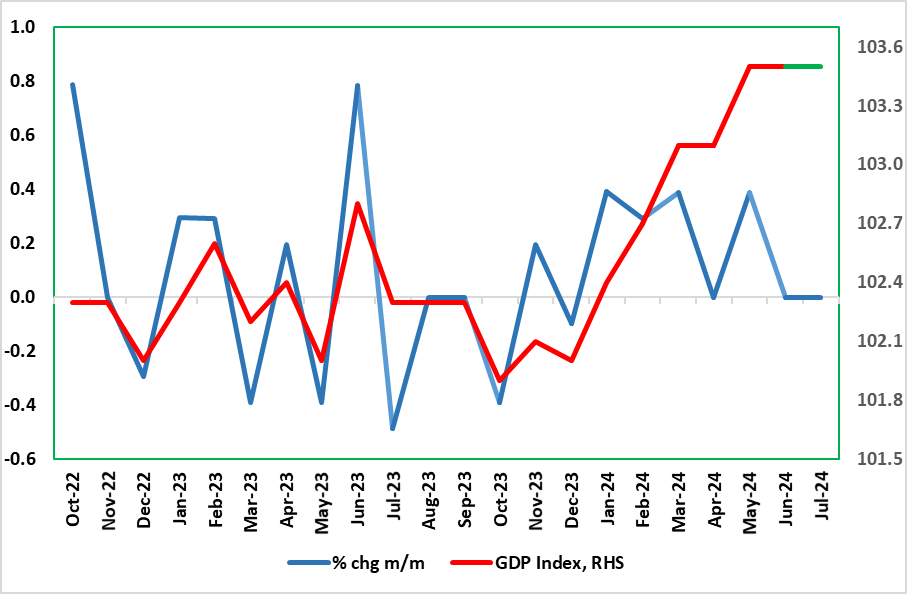
Surprising to the downside, the economy failed to show more positive signs with the July GDP data. Indeed, GDP was flat in m/m terms for the second successive month, compared to a 0.2% m/m rise widely envisaged. Thus the data still show showing volatility, as GDP growth has been positive in only one of the last four months of the last quarter (Figure 1) with the latest softness large due to a divergence between (solid) services and fresh goods output declines. Regardless, the lack of growth in Jun/Jul has created a soft base effect for Q3 growth which we see advancing just 0.1%, a quarter of the BoE estimate. This weaker immediate GDP backdrop is something that chimes more with labor market and public borrowing data and where HMRC payrolls paint a much softer backdrop and possible outlook that also conflicts very much with PMI survey numbers. Indeed, it could be argued that the labor market data released earlier this week may have more impact on BoE thinking, albeit with the marked drop in average earning growth that occurred being something the MPC also expected.
After the mild recession in H2 last year, the ‘recovery’ now evident is much clearer than any expected with GDP growth notably positive but in only one of the last four months. Indeed, amid weaker retail sales, property transactions and car production data, GDP failed to grow in June and failed to do so again in July despite better weather. But this still left Q2 GDP numbers (released alongside the monthly data) showing a 0.6% q/q rise after the 0.7% gain in Q1. That Q1 ‘strength’ was partly due to a further fall in imports, but that was not be the case in the Q2 breakdown, albeit with consumer spending softening, with growth instead boosted by an import-fuelled jump in stock-building. And it does seem as if import gains may Have acted to weigh on July GDP
Regardless, the H1 GDP data is too historic to have any major impact on BoE thinking. As for Q2, on the supply side, as suggested above, the economy was boosted mainly by services with manufacturing contracting (in spite of a clear June bounce), this divergence being something very much evident across W Europe.
Regardless, these national account data have prompted BoE thinking to be much more positive and make it now suggest growth of around 1.25% for the whole year, more than double the previous estimate, albeit we think a little too optimistic, this view borne out by what we think will be Q3 GDP outcome of just 0.1%, a quarter of BoE thinking – GDP would have to rise by 0.3% in both Aug and Sep to reach the BoE projection! Our reticence reflects that this apparent resilience, if not strength, in the GDP data contrasts increasingly with employment weakness (Figure 2) and is partly a result of public sector gains. But the strength in GDP is chiming with PMI survey data and this resonates with the BoE, even though those PMI data (covering the private sector) also conflict with what (possibly more) authoritative private sector payroll suggest.
Figure: China CAPE Yield-10yr Real Bond Yield (%)

We remain strategically underweight China Equities in global and EM equity baskets, due to the structural slowing of growth and low EPS prospects. Event risk around the U.S. presidential election will also start to be considered. Further targeted policies from China authorities could cause intermittent trading driven short-covering, but aggressive game changing policy would be required to sustain a rally. With India now overvalued, we prefer EM Asia ex China. We remain strategically underweight China Equities in global and EM equity baskets, due to the structural slowing of growth and low EPS prospects. Event risk around the U.S. presidential election will also start to be considered. Further targeted policies from China authorities could cause intermittent trading driven short-covering, but aggressive game changing policy would be required to sustain a rally. With India now overvalued, we prefer EM Asia ex China.
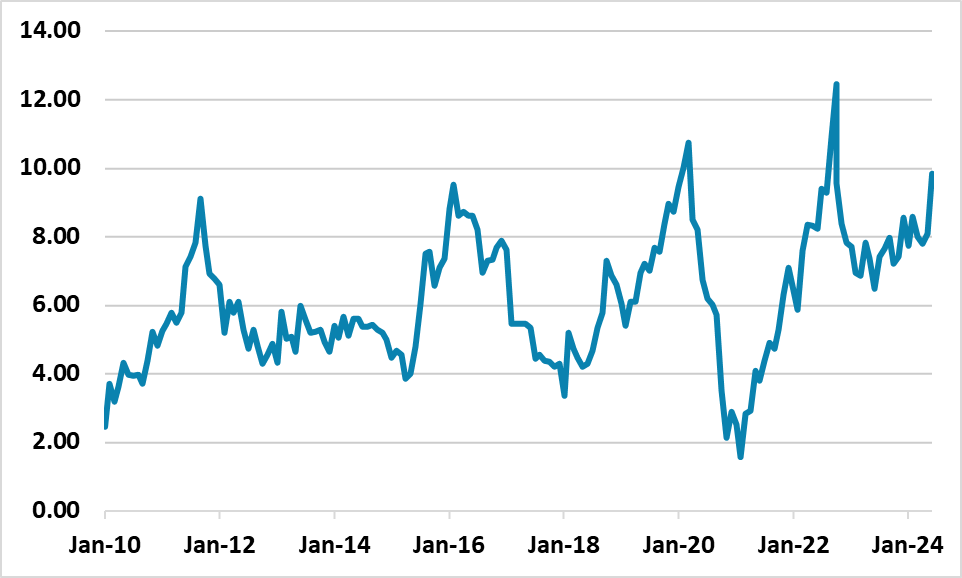
China equities are cheap on a valuation basis whether it is versus its own history or alternatively versus real government bond yields (Figure 1). However, valuation is not enough given the corporate and macro/policy backdrop. Chinese companies have a tendency to issue new shares which means that earnings growth turn into lower EPS growth. Secondly, economists are coming around to our type of view of 4.6% GDP in 2024 and 4.0% in 2025, as increasing concerns surround consumer spending as well as the well-known residential investment problem (here). Indeed, we feel that a 30% probability exists of a harder landing to around 3% in 2025-26 (here), which cause more of an earnings and EPS slowdown than our already downbeat view – baseline we are heading towards single digit earnings growth. CPI inflation also risks not recovering and going negative more persistently. This is not fully discounted in current equity only valuations. However, low nominal 10yr government bond yields do suggest some safety first and capital preservation behavior in China likel that seen in the U.S. during the GFC in 2008-09, though China 10yr real yields are still positive using CPI or GDP deflators. Thirdly, China authorities targeted polices are welcome, though are an insufficient scale given the real economy and aggressive disinflation pressures. This all means that the market is not impressed with low valuations in themselves.
Global investors are concerned about these issues, but also the less business friendly policies compared to the golden years of 1990-2019 – with intermittent crackdowns on certain sectors. Local investor’s capital preservation psychology is also being driven by losses on equity products launched in 2021 at much higher CSI index levels (Figure 2). With property prices falling, corporate bonds having problems, some small rural banks shaky and not trusted, the choice for domestic investors is between low yielding deposits at more stable major banks or government bonds.