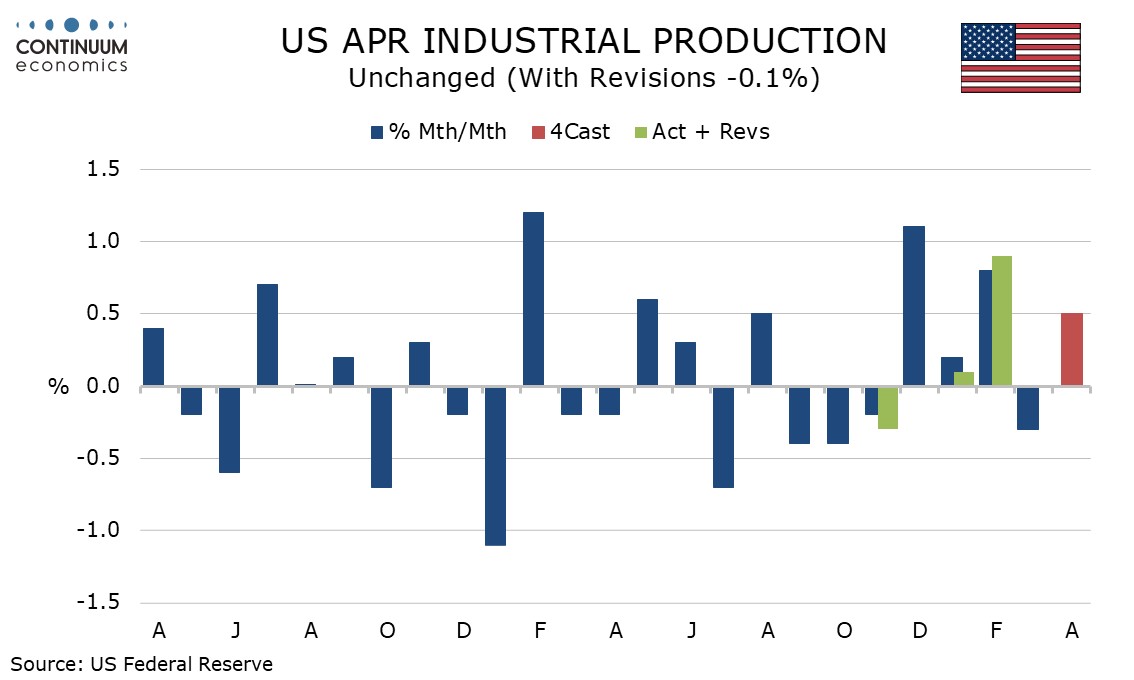
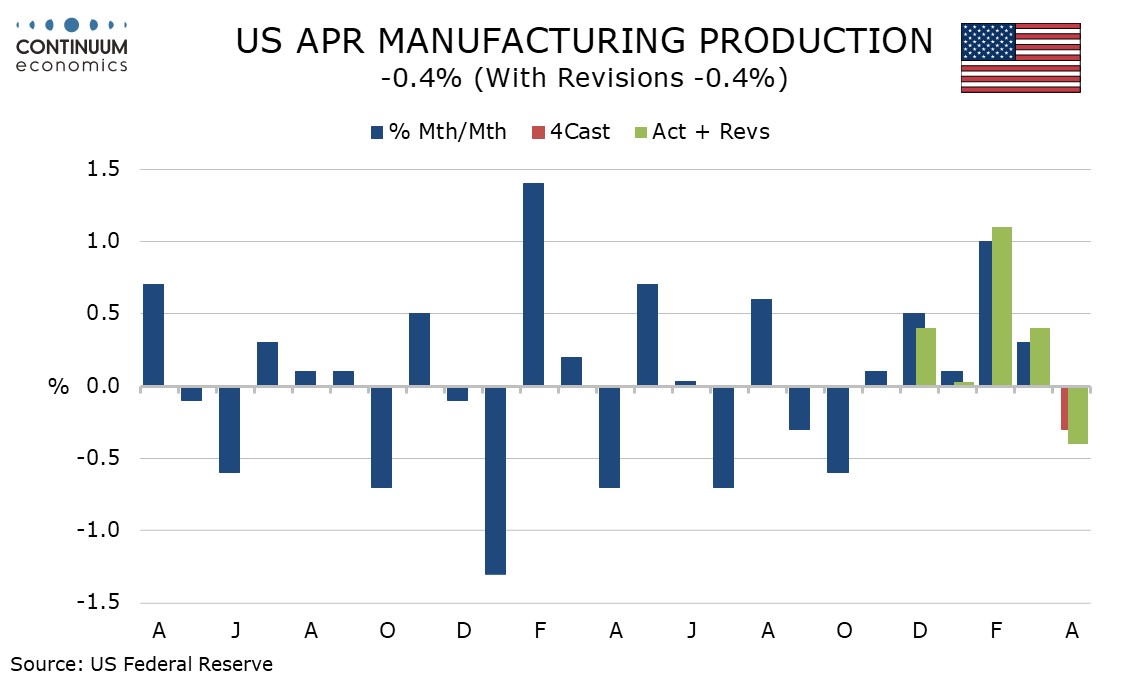
U.S. April Industrial Production - Manufacturing slips but May surveys suggest some resilience
April industrial production was unchanged but manufacturing output saw a weak month, falling by 0.4%, to reverse a March increase. Signals from manufacturing surveys from the Philly Fed and Empire State for May however, released shortly before, are on balance less negative.
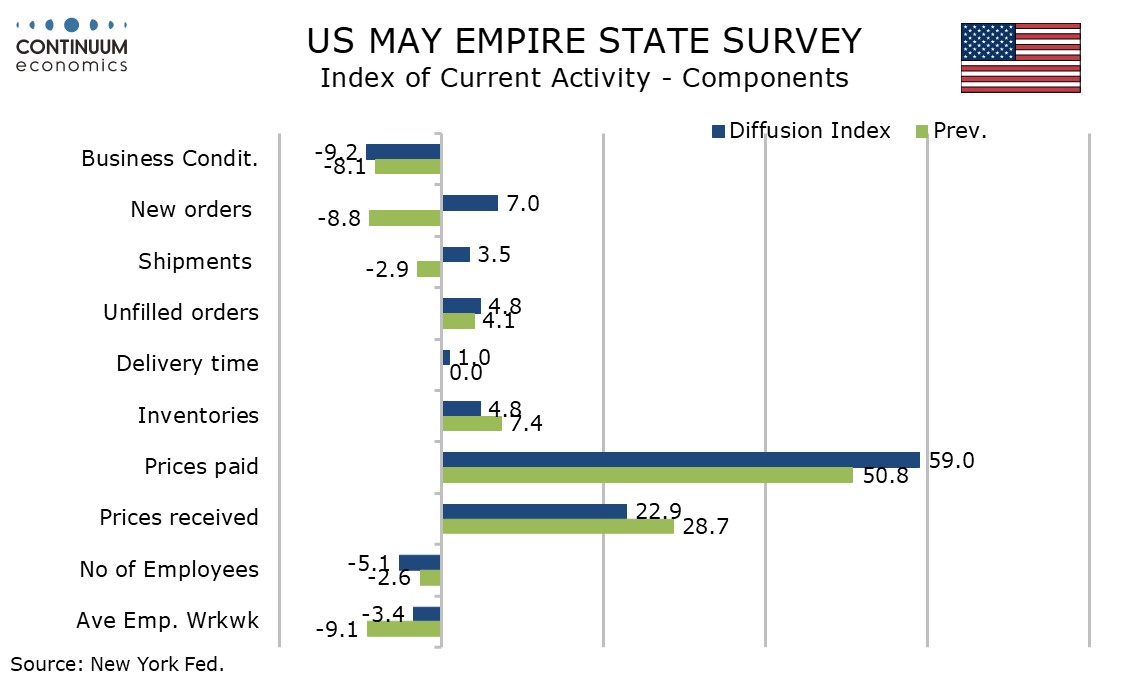
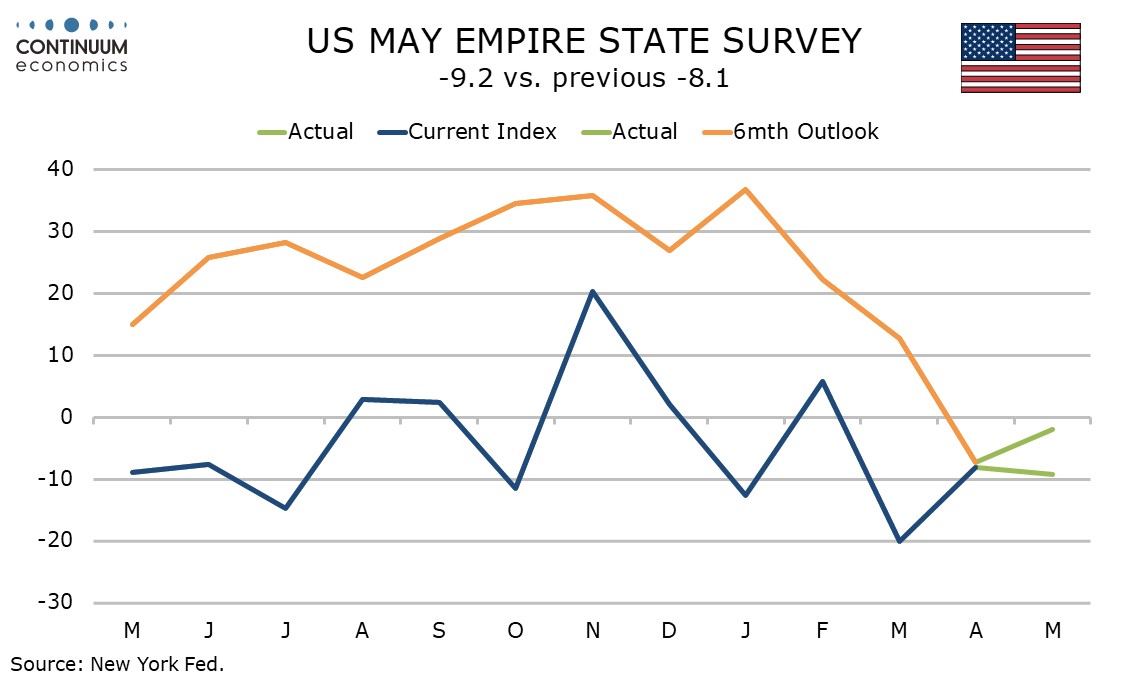
May’s manufacturing surveys from the Philly Fed and Empire State are on balance more positive than was the case in April. The Empire State’s headline index of -9.2 is down from -8.1 in March but not sharply, and new orders rebounded to 7.0 from -8.8 in March.
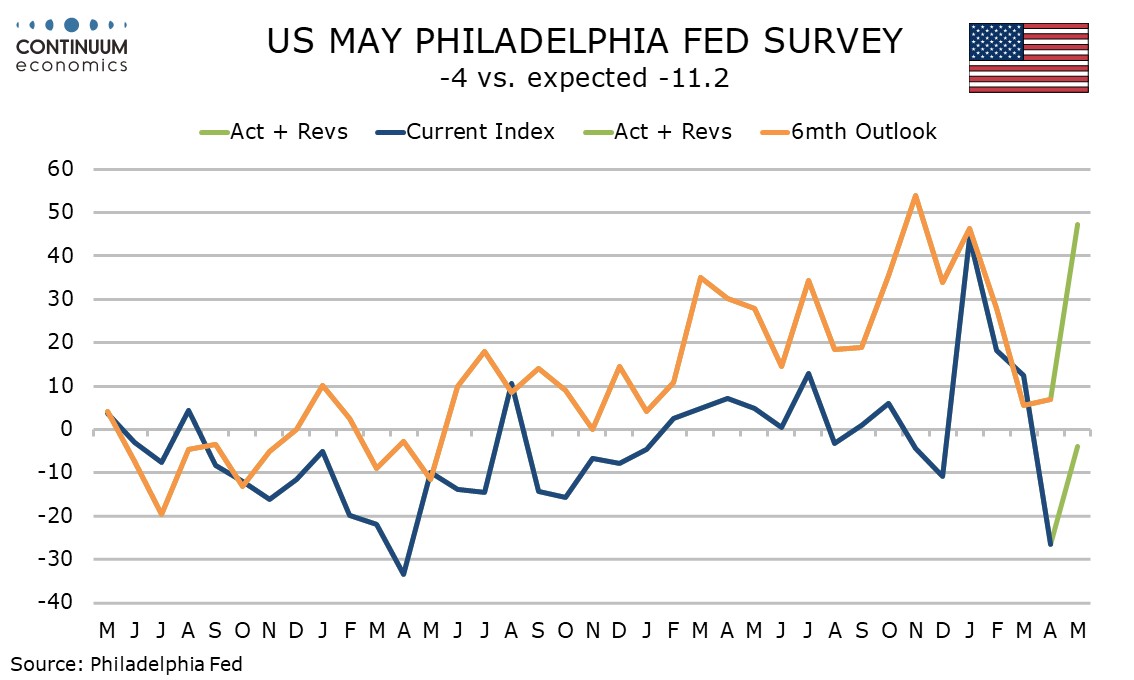
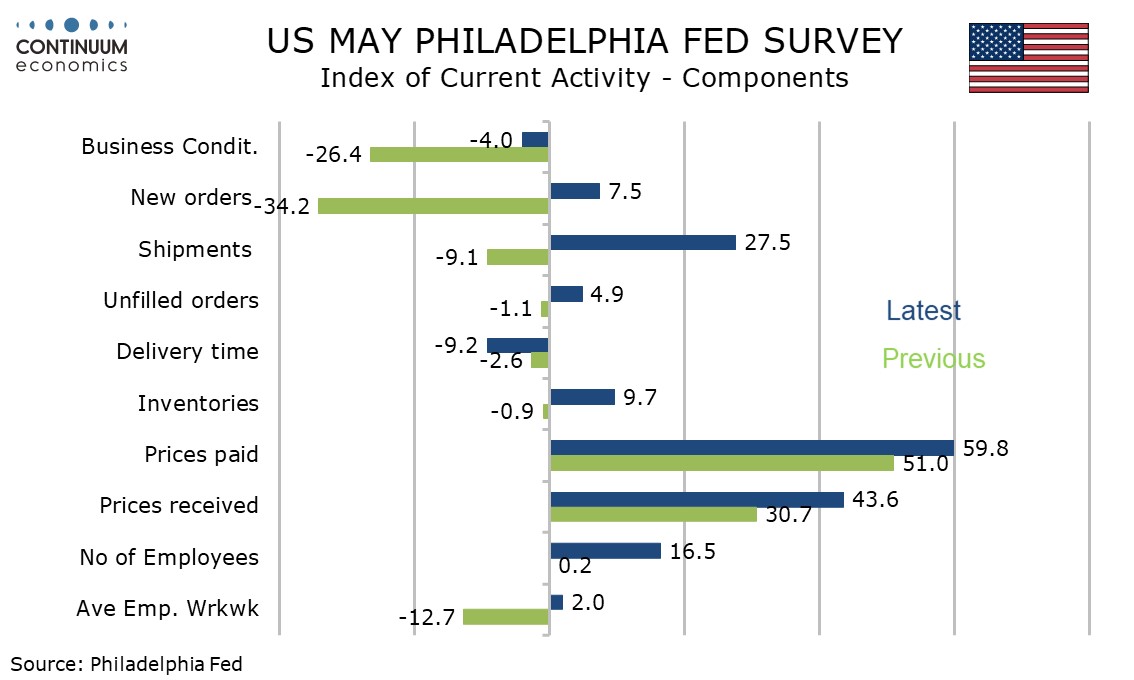
The Philly Fed’s headline of -4.0 is significantly less negative than March’s -26.4 while new orders at 7.5 from -4.2, like in the Empire State’s survey, also tuned positive.
Most significantly the Philly Fed’s 6-month expectation at 47.2 from 6.9 saw a sharp bounce, to its highest level since November 2024. The Empire State’s 6-month index however was less impressive, still negative at -2.0 if up from -7.4 in March.
Price data was on balance strong, with the Philly Fed’s prices paid index at 59.8 from 51.0 the highest since June 2022, as was its prices received index of 43.6 from 30.7.
The Empire State survey saw prices paid at 59.0 from 50.8, reaching its highest since July 2022, but prices received slipped back to 22.9 from 28.7, reversing most of an April acceleration. That Philly Fed respondents are more optimistic about future activity may explain their stronger pricing plans.
6-month expectations on prices were however on balance softer, the Philly Fed’s seeing prices paid at 61.6 from 63.1 and prices received at 50.0 from 67.7, though both were still above March levels. Empire State 6-month data saw prices paid edging up to 66.7 from 65.6 but prices received slipping to a 4-month low of 35.2 from 45.9.