This week's five highlights
U.S. 25% Tariff for Cars, Pharma and Semiconductors?
U.S. February Non-Farm Payrolls Should be Stronger than January
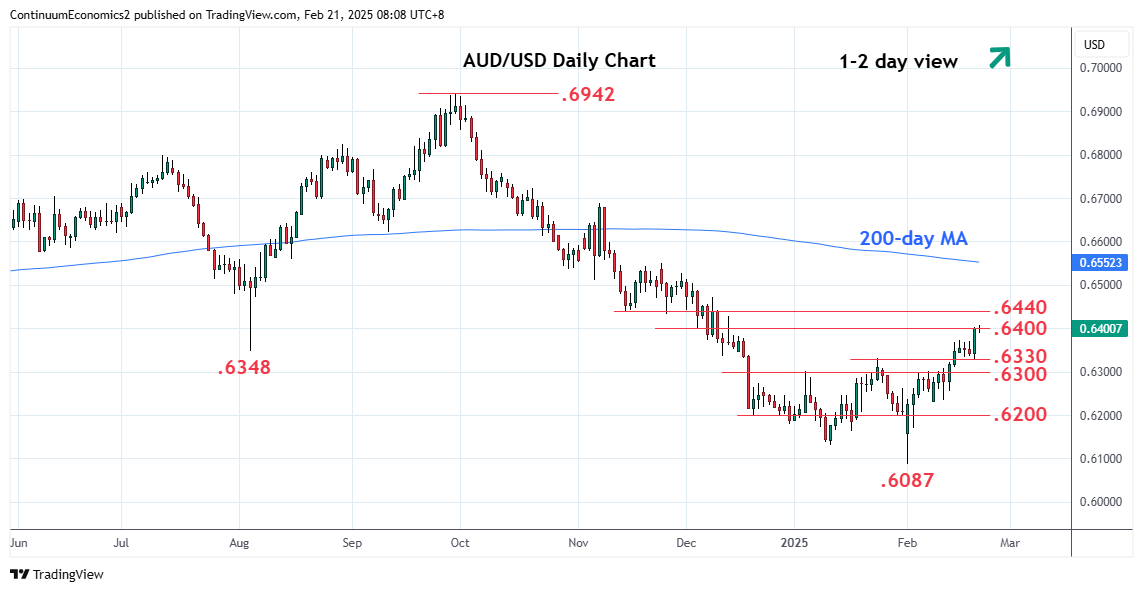
RBA began Easing
RBNZ Continue to Frontload
UK Inflation Jumps
Figure: U.S. 2024 Bilateral Trade Position (USD Blns)
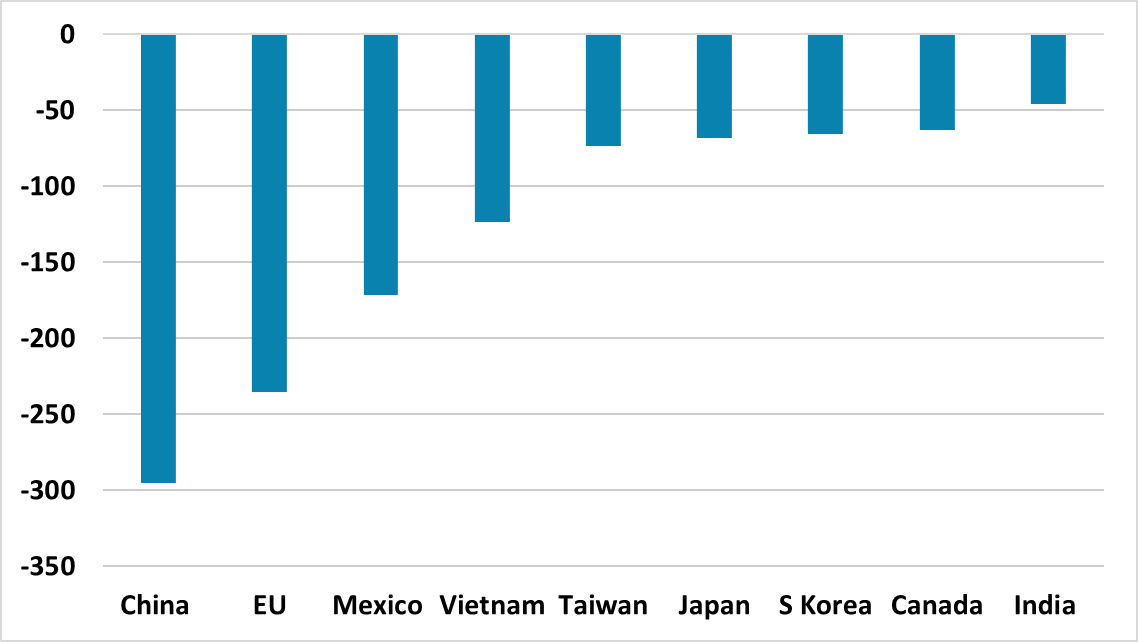
Tariff reality in the spring and summer will likely be both tariff threats to negotiate trade deals and permanently higher tariffs in certain products and reciprocally to raise revenue for the U.S. government – along Peter Navarro guidance to Trump. The macro effects of this could be inflationary in a small to modest or moderate way, which will be a function of the scale of product and reciprocal tariffs and also whether they are implemented against some countries (e.g. China/EU) or globally. We will likely only be clear on this by the summer rather than in April. The economic effects will likely be small to modest adverse impact on U.S. domestic demand as higher prices suppress U.S. domestic demand/trade policy uncertainty more than offset extra military and LNG sales by the U.S.
President Trump on Tuesday signaled that he is likely to announce on April 2, 25% tariffs on imported cars, pharmaceutical and semiconductors into the U.S. No clarity exists on an implementation date (though Trump hinted it could be months to allow manufacturers to switch production into the U.S.); whether certain countries would be hit first or whether they would be subject to a wider trade negotiation on a bilateral basis. While Trump has hinted that his array of tariffs could stack upon each other (steel and aluminum; reciprocal and country specific), this is likely to be a Trump maximist negotiating tactic. For example, if the U.S. imposes across the board 25% of Canada and Mexico and then 25% on top for cars, then the impact on U.S. inflation would start to become a concern. 25% on cars, pharma and semi plus worst-case global reciprocal tariffs implementation would have a bigger adverse inflation impact.
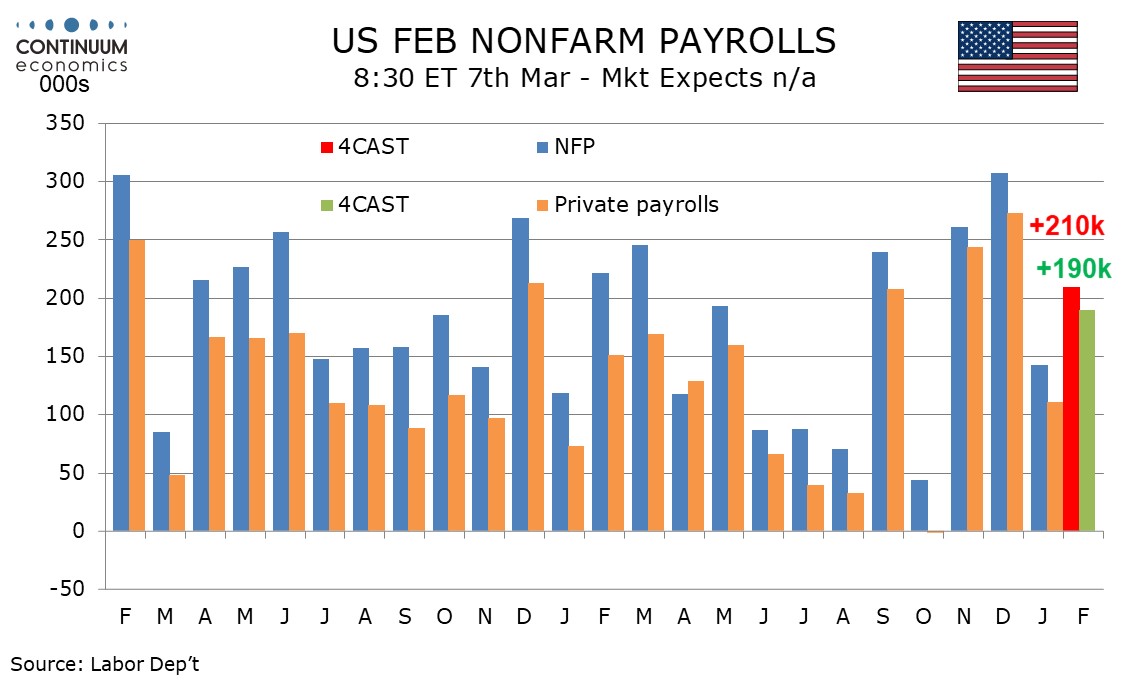
We expect a 210k increase in February’s non-farm payroll, with 190k in the private sector, slightly stronger than in January but slower than in November and December. We expect unemployment to remain at 4.0% and a 0.3% rise in average hourly earnings, following an above trend 0.5% in January. January’s gain of 143k was probably restrained by bad weather, though gains of 307k in December and 261k in November were inflated by a rebound from October’s weak 44k, which was hit by two hurricanes and a strike at Boeing.
Our forecasts for February are slightly slower than January’s 3-month averages of 237k overall and 209k in the private sector, but stronger than the respective 6-month averages of 178k and 145k. This would be consistent with a recent acceleration in labor market momentum peaking, but no significant weakness yet emerging. Initial claims are still low, suggesting underlying labor market strength. Weather in February is likely to be less of a negative than in January, though unusually cold weather persisted. A 20k rise in government payrolls would be on the low side of recent trend as Federal layoffs start to rise, but State and Local government hiring is likely to remain firm.
The RBA has cut the cash rate by 25bps to 4.1% in the Feb 18 meeting, seeing rates remain restrictive after the cut and signals data dependency going forwards. RBA has also revised inflation forecast for the first half of 2025 lower to 2.4% y/y from 2.5%, trimmed mean at 2.7% from 3% but revised 2026/27 headline inflation higher. They see cash rate to be at 3.6% by year end 2025 and at 3.4% June 2026 before returning to 3.5%, a terminal rate so far. The key change of stance from RBA came from softer than expected inflation and GDP growth.
The RBA acknowledged the cooling of Q4 trimmed mean CPI to be a trigger as it approaches target range of 3% at 3.2% y/y. Headline inflation's cooling has been so far downplayed/ignored as it does not fit their rhetoric unless they are aggressively easing. Moreover, they see lower wage pressure and sluggish growth in private demand despite surprisingly strong labor market. It seems to suggest it will be a gradual easing path the RBA to be on, instead of the aggressive cutting from the RBNZ. The market is reading the cut as a hawkish one, as it does not suggest an urgency in further easing.
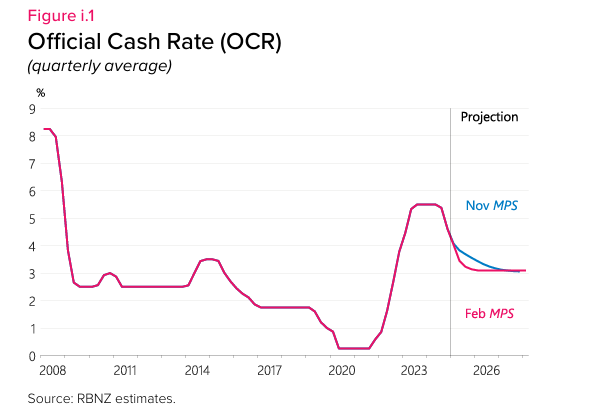
The RBNZ cut its cash rate by 50bp to 3.75% in the February meeting, revised OCR forecast to indicate more rate cut in 2025 and keep terminal rate at sub 3% after mid 2025, along with minor revision in other economic forecast.
Some key takeaways:
More Cuts to Come: "If economic conditions continue to evolve, scope to lower OCR further in 2025". The RBNZ cut by 50bps which is faster than the November forecast. The February forecast now see another frontload of 50bps before a 25bps to bring rate to 3%.
Inflation Expectation: The RBNZ sees CPI, core CPI & expectation to remain closer to the middle of target range and they are forecasting such momentum to roll through 2025. Moreover, the latest spike in Q4 CPI has been attributed to transitory factors of energy price and is expected to further moderates. Thus, the RBNZ is comfortable to further aggressively ease rates.
Forward Guidance Stays with Forecast Revision: The forward guidance has been changed in wordings but not its meaning "If economic conditions continue to evolve as projected, the Committee expects to be able to lower the OCR further early next year.". The CPI has shown stronger inflation in the first half of 2025 and sharper moderation in the second half of 2025.
Figure: January Inflation Spikes Broadly Higher?
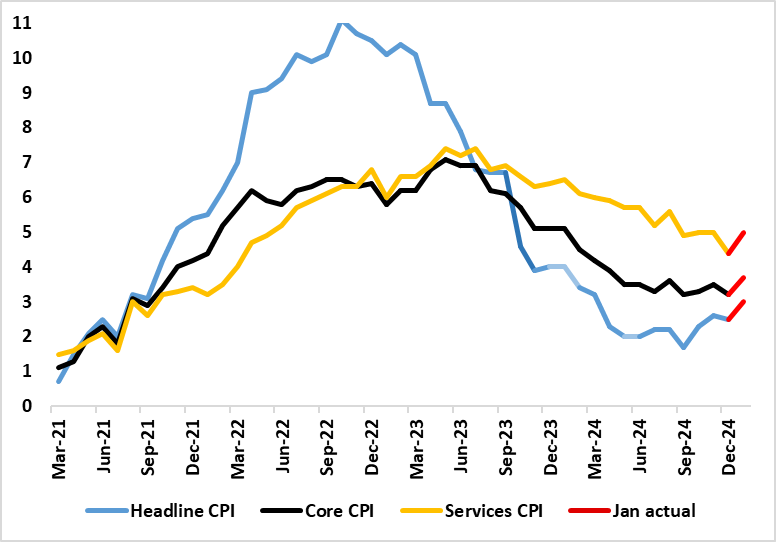
January’s CPI numbers showed a marked bounce back up, and with the 0.5 ppt rise taking it to a 10-month high of 3.0%, this being above consensus and BoE thinking. Notably services jumped from 4.4% to 5.0%, actually below expectations, having been driven higher by a swing in airfares and the rise in school fees, but with further upward pressure evident in rents too. The data add to worries about a fresh spike, albeit with it unclear the extent to which pandemic-induced changes in seasonal price patterns have acted to make the CPI backdrop much more volatile. These CPI data come after more apparently perturbing wage data, although we think that there are actually signs that companies are reacting to labor costs pressures by curbing jobs as a means of trying to raise prices. This explains out still optimistic outlook.
The January jump also reflect ‘noise’ elsewhere in volatile services and higher energy inflation both due to fuel price rises (including a rise in the energy price cap) and base effects. More notably, while overall inflation may drop back in the rest of the current quarter we acknowledge that the headline will spike back higher in Q2 as a series of regulated prices (water bills) and energy costs (mainly gas) take effect. Indeed, inflation may now average around 3% in Q3, some one ppt higher than previously thought but still well below the 3.7% rate that the BoE now projects. This added price pressures are hardly demand determined and may accentuate already weak growth, thereby further restraining company pricing power. We therefore still see 3-4 more 25 bp Bank Rate cuts this year, as the BoE reacts to weaker core inflation and the added damage to demand ensuing from price spikes.
One reason for this still optimistic outlook is an alternative and more reassuring assessment of the labor market and cost pressures. To suggest that the UK labor market is merely getting less tight misses the point entirely. Amid continued reservations about the accuracy of official labor market data produced by the ONS, alternative and very clearly more authoritative data on payrolls suggest that employment is continuing to contract. Indeed, the payroll data produced by the HMRC, have now show six m/m falls since the level of payrolls peaked nine months ago. Admittedly, the drop in this five-month period is only 0.1%, but this is a marked contrast to the 1.4% increase official data suggest has occurred in the last year. More notably, overall payrolls have been buttressed by sizeable public sector employment gains to a degree that private payrolls in the last five months are down almost 100K (ie -0.5%). Moreover, amid fiscal strains, non-health public sector jobs have now started to fall too, compounding what has been an ever clearer haemorrhaging of jobs in private services, thereby suggesting that cost pressures (now accentuated by the looming increase in employee National Insurance Contributions and the actual rise in the minimum wage) have already affected the labor market severely.