This week's five highlights
A more balanced U.S. October CPI
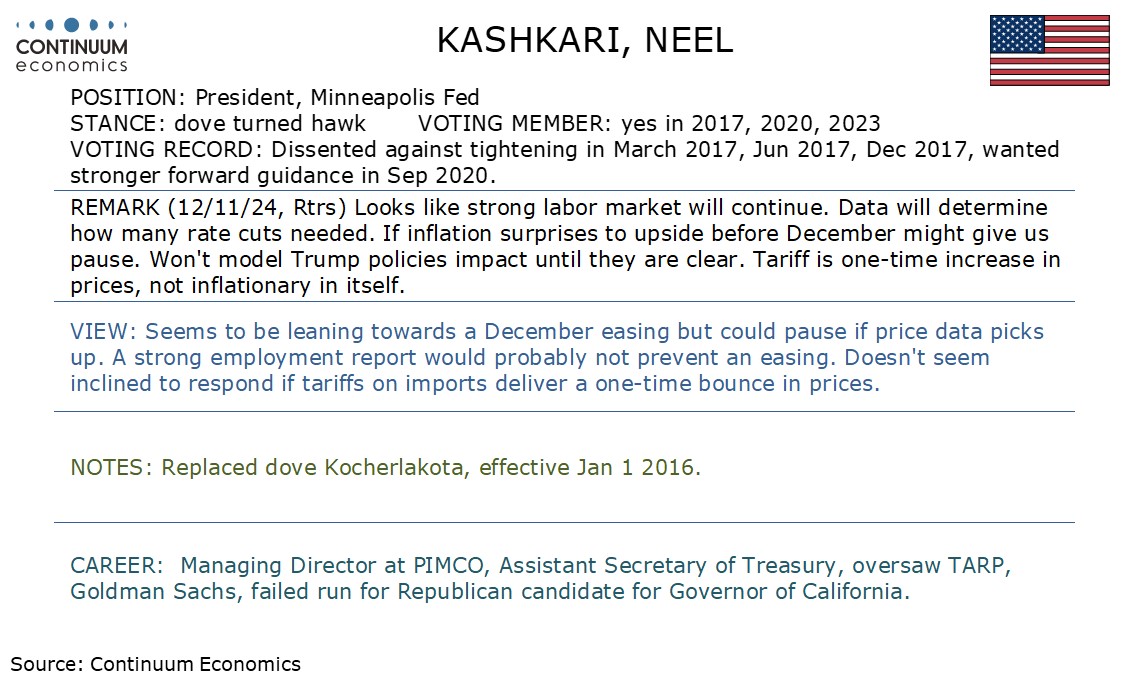
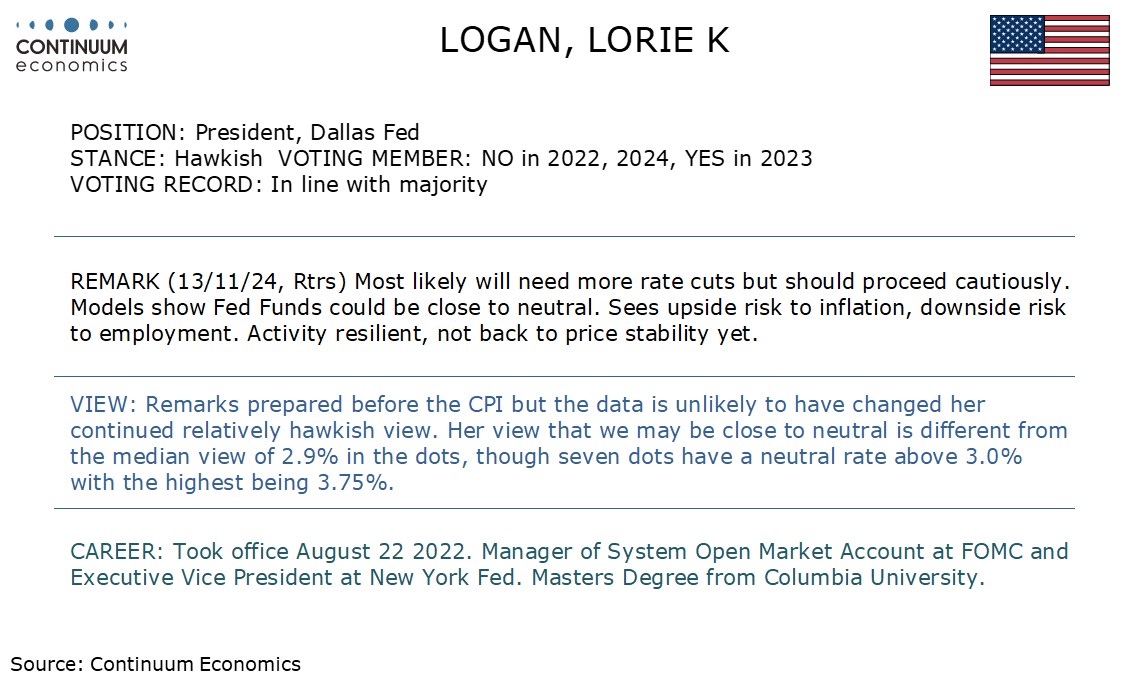
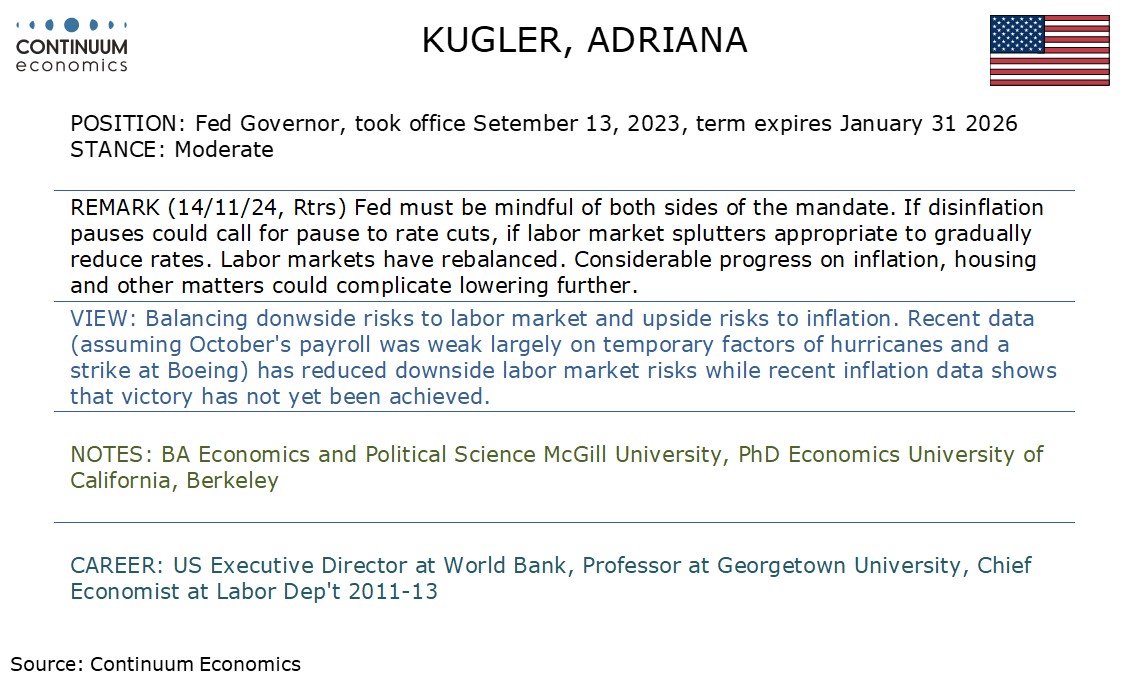
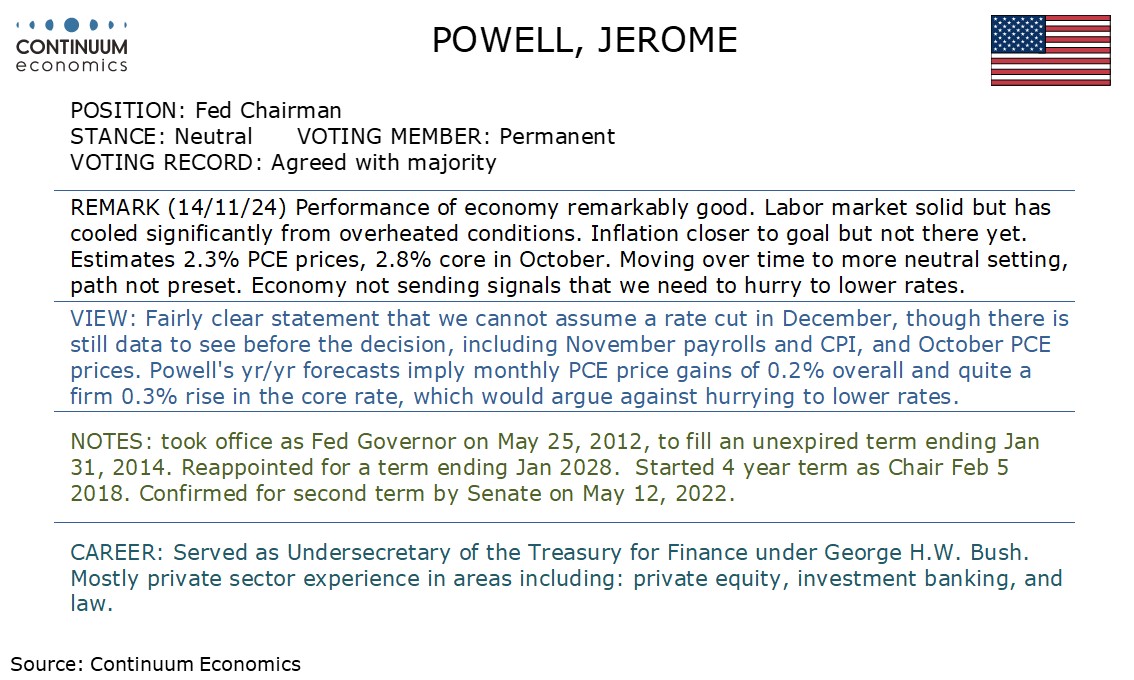
And the slate of Fed speakers
One way traffic for USD/JPY
UK GDP Momentum Dissipated
Mixed Chinese Data Backs More Stimulus
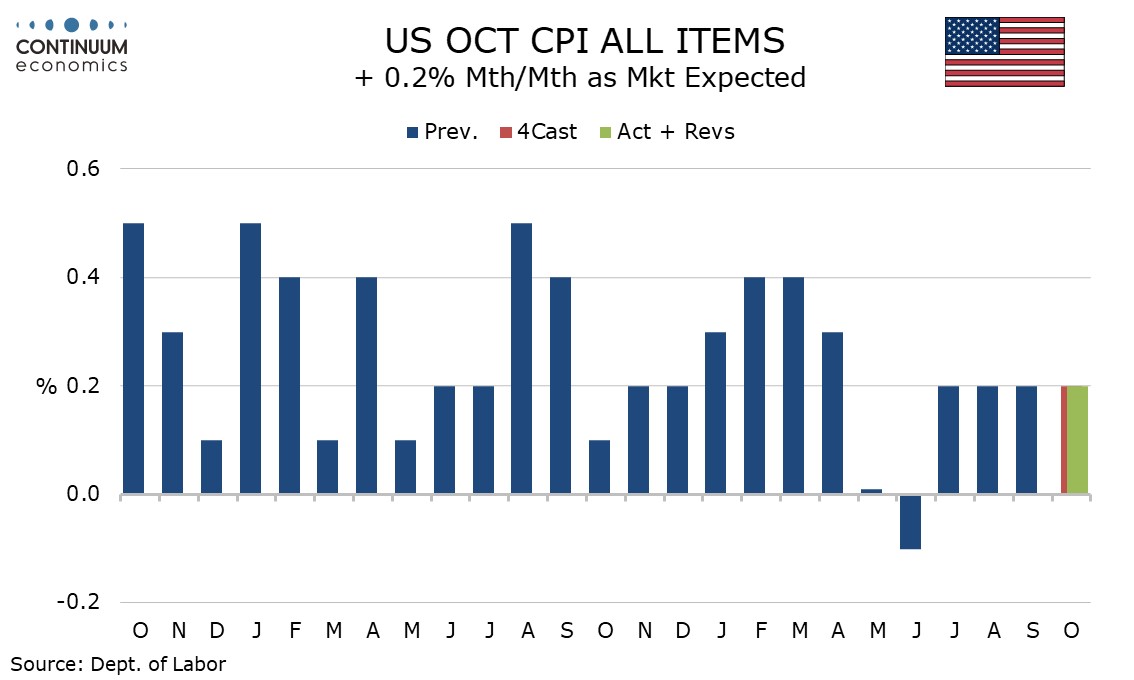
October CPI has seen the fourth straight rise of 0.2% overall and the third straight rise ex food and energy of 0.3%, both on consensus. Before rounding the gains were 0.24% and 0.28% respectively, the latter slower than September’s 0.31% but in line with August’s. The data leaves the December FOMC decision dependent on future data, with November’s employment report and CPI both due before the meeting. Energy prices were unchanged with a rise in electricity offsetting a dip in gasoline. Food rose a modest 0.2% leaving the overall outcome only marginally below the core before rounding. Commodities less food and energy were unchanged and appear to be stabilizing after recent declines. Services less energy with a 0.3% increase were on the low side of recent trend. The picture is becoming more balanced.
The commodities data was restrained by a 1.5% decline in apparel in a correction from a 1.1% increase in September, and the main reason why October’s core rate was slightly softer than September’s. Used auto however saw a strong 2.7% increase and deflation in that sector, a significant factor in recent slowing, appears to have run its course.

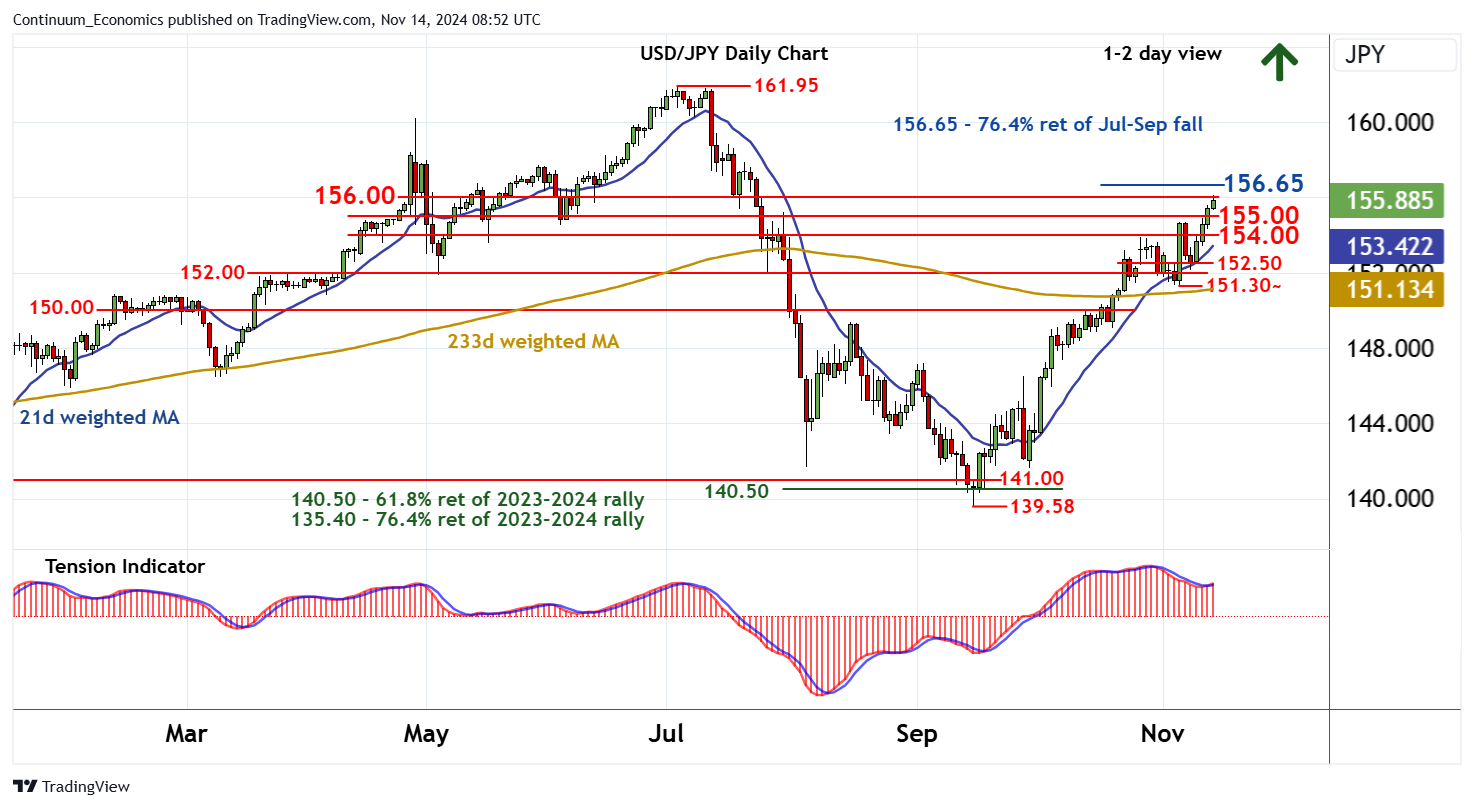
Since Trump was elected as the new U.S. president, it has been one way traffic for USD/JPY as USD triumphs other major FX counterparts. The soft rhetoric from Japanese minsters did not help nor the minor correction in the equity space as U.S. Treasury Yields' pace of advance has been faster than the JGB counterpart. There is also little support coming from the BoJ with no signal of imminent hike despite CPI flares up in Q3. While JPY is once again approaching historic weakness, the Japan finance ministry may focus on the speed of weakness rather than a specific level to actually intervene.
On the chart, the anticipated break above 155.00 has reached congestion resistance at 156.00, where flattening overbought intraday studies are prompting short-term reactions. Daily readings continue to improve, highlighting room for a break above here and continuation of September gains towards the 156.65 Fibonacci retracement. But flat overbought weekly stochastics could prompt profit-taking/consolidation around here, before the positive weekly Tension Indicator extends gains still further. Meanwhile, a close below congestion support at 155.00 would turn sentiment neutral. But a further break below 154.00 would add weight to price action and prompt a pullback towards 152.50.
Figure: Momentum Has Ebbed
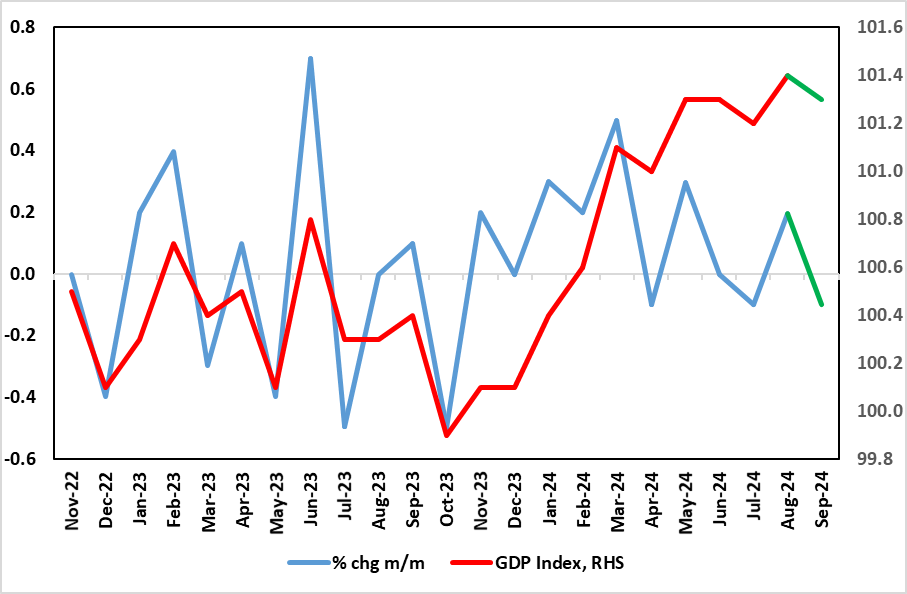
The latest data, including that for the Q3, very much questions the UK’s economy’s apparent solidity, if not strength, as apparently seen in sizeable q/q gains in the first two quarters of the year of 0.7% and 0.5% respectively. Indeed, GDP growth has been positive in only two of the last six months of data and worth a cumulative 0.3%, and where even that much more modest momentum looks to have ebbed given that September GDP fell 0.1% m/m, soft enough to have limited Q3 GDP growth to a 0.1% q/q rise, half the pace the BoE recently pared back its estimate too but in line with our thinking. Echoing an inventory draw-down, output weakness was widespread, but most notable in manufacturing, thereby chiming with business survey data which has also pointed to a softer service sector backdrop that these figures also point to. The GDP data also are more in line with the weakness in payroll growth, albeit where the combination of small gains in q/q GDP suggest a possibly less downbeat productivity picture than the BoE reverted to in its last set of data. Regardless, the monthly real economy data may be becoming an increasingly important factor in shaping BoE policy ahead.
To suggest that the unexpected GDP drop in September was a result of pre-Budget apprehension is wide of the mark; after all, GDP stopped growing between March and when the new government too office in July. As for the latest details, m/m real GDP is estimated to have fallen by 0.1% in September, largely because of declines in manufacturing output and information and communication services, after unrevised growth of 0.2% in August 2024. Monthly services output showed no growth, following an unrevised increase of 0.1% in August 2024, and grew by 0.1% in the three months to September 2024. Even construction, where surveys are the most upbeat, output grew only by 0.1% in September 2024, following a revised growth of 0.6% in
As for September, we think that mild weather curbed utility production. There was a small boost from real estate, but with something of an imponderable being the public sector which had been clearly boosting activity in H1, but may now be flattening out, if not reversing, at least outside of health.
Figure: China Industrial Production Yr/Yr (%)
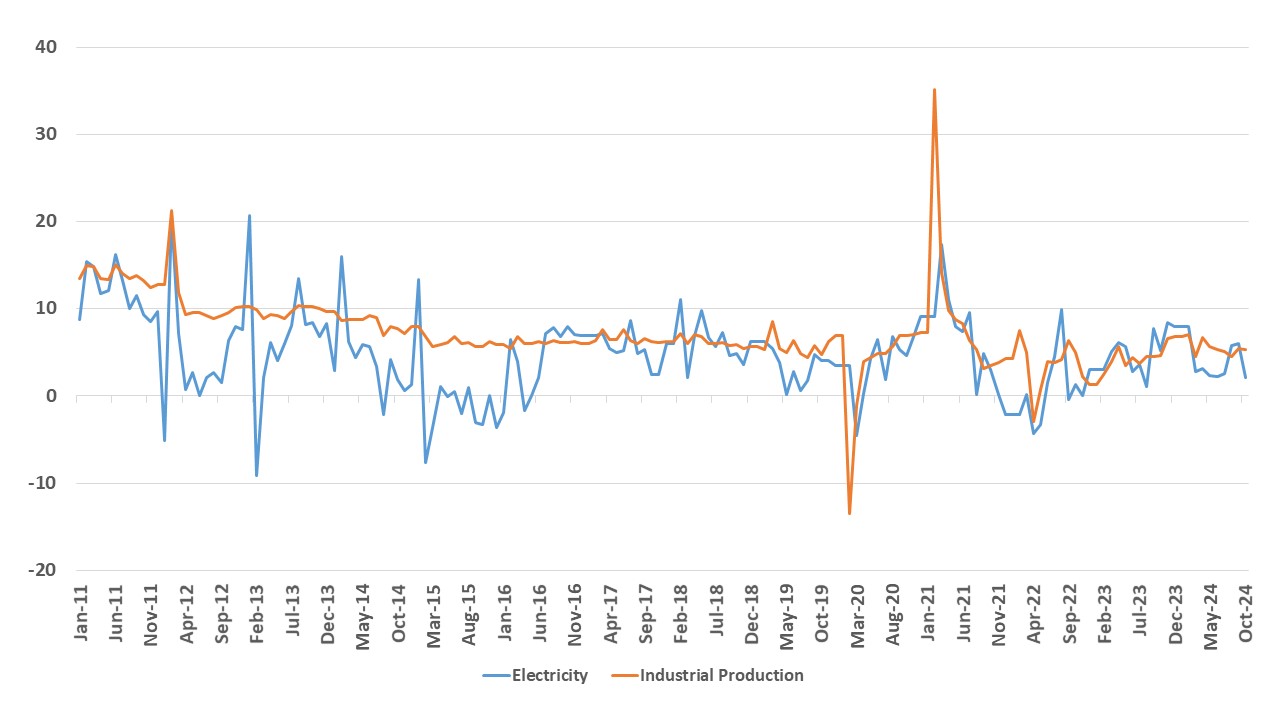
China October data is mixed with a bounce in retail sales helped by government trade ins and a holiday, but industrial production and housing construction disappointing. This all argues for further fiscal stimulus. However, given our view that some tariff increases against China by the U.S will be seen H2 2025, we now revise our end 2025 USDCNY forecast to 7.45.
A mixed set of data for October. Industrial production was weaker than expected at 5.3% Yr/Yr versus the 5.6% expected. Meanwhile, October retail sales data rose +4.8% Yr/Yr versus +3.2% expected, with NBS reporting that the singles day shopping event starting October 14 and a week long holiday caused a sales surge. Retail sales were also boosted by the government trade in program for home appliances, where a jump to +39% Yr/Yr was seen. Meanwhile, numbers from the property sector also were mixed. Home sales picked-up, which fell -15.8% YTD Yr/Yr versus -17.1% in Jan-Sep. New Home prices fell 0.5% in October versus a 0.7% decline in September. The reduction in mortgage rates and policy rates has helped some households to be more confident. However, the overhang of complete and incomplete homes remains massive and even if a further sustained pick-up is seen in sales it will not translate into a pick-up in residential fixed investment in the coming quarters – worse at -10.3% YTD Yr/Yr versus -10.1% Jan-Sep. Indeed, we remain concerned that the household concerns over the property market are so large, that the bounce in home sales will slow into early 2025. Additionally, household confidence and employment are unlikely to pick up enough to allow a sustained bounce in home sales. The data does not change our forecast of 4.5% for 2025 GDP growth – though we now look for 4.9% for 2024 v our previous forecast of 4.8%.