FX Weekly Strategy: Sep 9th-13th

U.S. August CPI Subdued
PPI In line with the underlying trend
More Mixed Messages for UK GDP
Japan GDP Unlikely to Change BoJ's Mind
Strategy for the week ahead
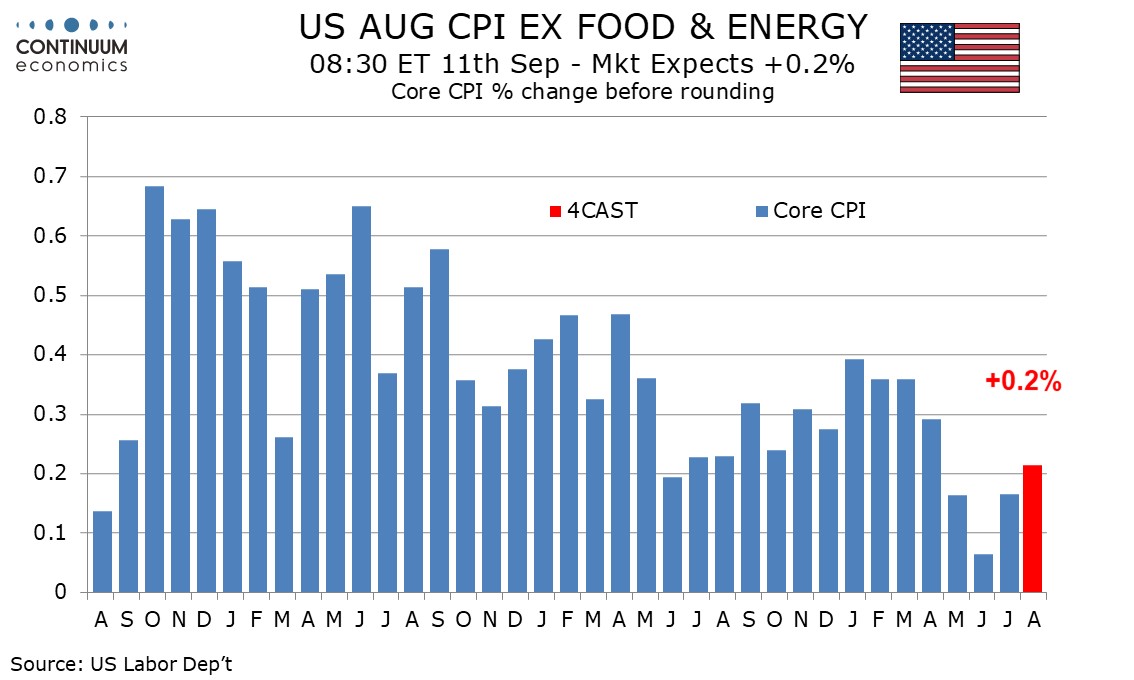
We expect August’s CPI to increase by 0.2% both overall and ex food and energy, with the respective gains before rounding being 0.18% and 0.21%. Such an ex food and energy rate would be slightly stronger before rounding than in the preceding three months, though not strong enough to trouble the FOMC. We expect a slightly firmer ex food and energy rate, not because we expect any real strength in any components but because some components are unlikely to be quite as soft as in recent months. Used autos saw a particularly sharp decline in July while medical care also saw an unusual decline. Apparel has declined in two of the past three months while air fares have fallen significantly in the last three, though less so in July which hints we may be seeing some stabilization. Most of the above components are likely to be a little less weak in August. We do however expect a renewed loss of momentum in shelter after July corrected higher from a slower June outcome.
Gasoline prices saw a marginal decline in August but the impact on CPI will be small with energy prices seen down by only 0.3%. Food is likely to continue showing marginal increases with a third straight gain of 0.2%. Year ago strength in energy prices is likely to see yr/yr CPI slip to 2.6% from 2.9%, reaching its lowest level since March 2021. However we expect the yr/yr ex food and energy rate to remain at July’s 3.2% pace, which was the slowest since April 2021.
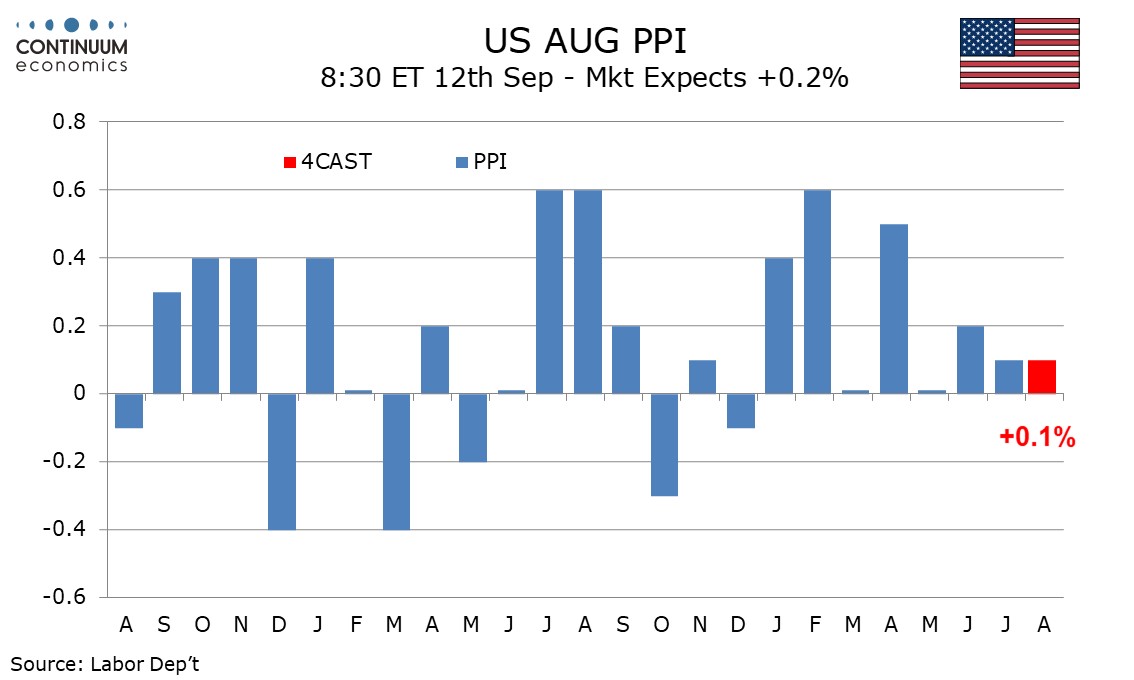
We expect a 0.1% increase in August PPI, matching the outcome of July, while the core rates ex food and energy and ex food, energy and trade both increase by 0.2%, all suggesting a subdued underlying picture. Trade prices have recently shown some volatility, rising sharply in June before reversing in July. June ex food and energy PPI was lifted to 0.3% by trade while ex food, energy and trade rose by only 0.1%. In July the correction in trade saw ex food and energy PPI unchanged while ex food, energy and trade rose by 0.3%. Underling trend appears to be close to 0.2%. We expect energy prices to be unchanged but food to correct lower from an above trend June leaving overall PPI slightly softer than the core rates in August. We see goods PPI unchanged with a 0.1% rise ex food and energy, while services increase by 0.2%. Year ago strength in energy will see yr/yr PPI slip to 1.8% from 2.2%, reaching its lowest since February but we expect yr/yr growth ex food and energy to edge up to 2.5% from 2.4% while ex food, energy and trade PPI remains at July’s 3.3% pace.
Figure: Volatile But Clear(er) Recovery?
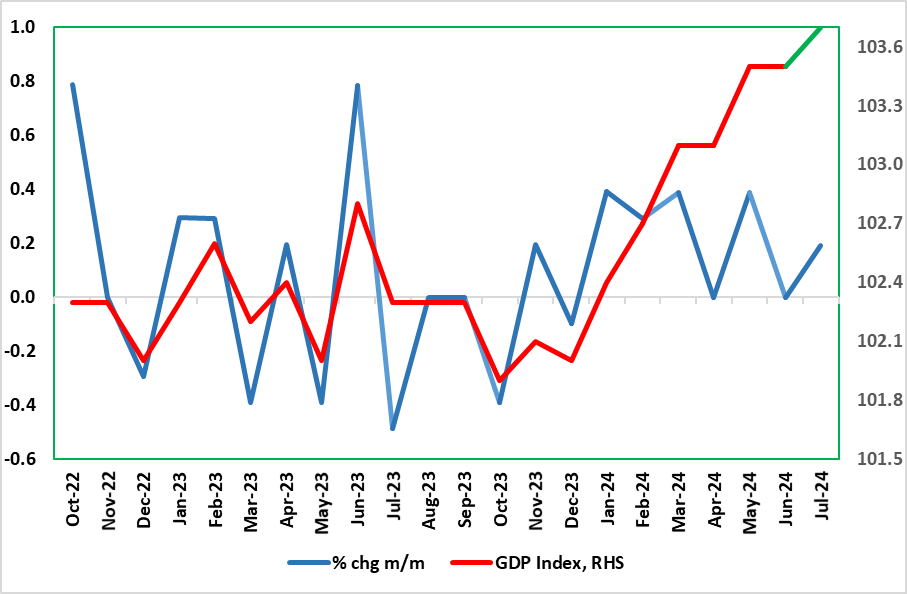
It does seem as if the economy is going to show more positive signs with the July GDP data. Indeed, we see a 0.2% m/m rise, albeit with the data still showing volatility. Indeed, GDP growth has been positive in only one of the three months of the last quarter, having been flat in June. Regardless, amid a small rise in retail sales and car production data, GDP does seem destined for a fresh rise (Figure), but where the June lack of growth in June has created a soft base effect for Q3 growth which we see advancing just 0.1%, a quarter of the BoE estimate. This weaker immediate outlook is something that chimes more with labor market and public borrowing data and where HMRC payrolls paint a much softer backdrop and possible outlook that also conflicts very much with PMI survey numbers. Indeed, it could be argued that the labor market data due Sep 10 may have more impact on BoE thinking, albeit with the anticipated marked drop in average earning growth we envisage being something the MPC also expected.
After the mild recession in H2 last year, the ‘recovery’ now evident is much clearer than any expected with GDP growth notably positive but in only one of the three months of the last quarter. Indeed, amid weaker retail sales, property transactions and car production data, GDP failed to grow in June. But this still left Q2 GDP numbers (released alongside the monthly data) showing a 0.6% q/q rise after the 0.7% gain in Q1. That Q1 ‘strength’ was partly due to a further fall in imports, but that was not be the case in the Q2 breakdown, albeit with consumer spending softening, with growth instead boosted by an import-fueled jump in stock-building.
Regardless, the H1 GDP data is too historic to have any major impact on BoE thinking. As for Q2, on the supply side, as suggested above, the economy was boosted mainly by services with manufacturing contracting (in spite of a clear June bounce), this divergence being something very much evident across W Europe. Consumer spending growth halved to 0,2% while business investment slipped slightly, with domestic demand instead boost by government spending – hardly likely to persist. Unlike the Q1 GDP jump, imports actually detracted from GDP, but this import build spilled over into an inventory rise which also may not persist. Even so, the Q2 jump actually saw little growth in the quarter, instead boosted by base effects from Q1
The Q2 Japan GDP will likely show another quarter of sluggish growth. While wage growth is picking up, real wage remain negative mostly in Q2 with Japanese resident struggling to justify consumption at a high price. However, BoJ is likely to overlook such data as their focus remain on trend inflation which in their eyes are rising due to wage/consumption behavior changes in Japan. However, the pace and magnitude of such would likely be slow than BoJ's forecast. Thus, USD/JPY will likely follow the narrative by the Fed and BoJ on yield differential and correct further. The Japan revised Q2 GDP indeed came in lower than preliminary (+0.8%) at+0.7% q/q. Key areas like private consumption is also trimmed slightly by 0.1% q/q but it is unlikely to affect BoJ's policy tilt with Ueda suggesting multiple hike to come.
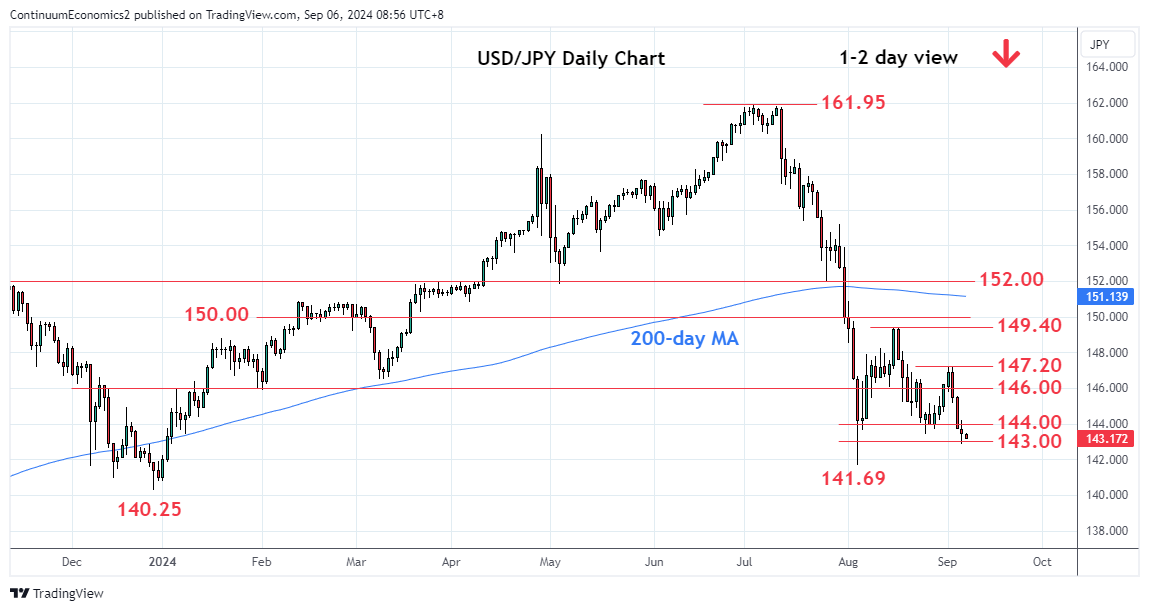
On the chart, the pair is consolidating at the 143.00 level as prices unwind the oversold intraday studies but pressure remains firmly on the downside. Break will will see room to extend losses to retest the 142.00 level and the 141.69, August low. Would expect reaction here but corrective bounce see resistance now at the 145.00/145.20 congestion area which is expected to cap and sustain losses from the 147.20, lower high. Below the 141.69 low will extend losses from the July YTD high at 161.95 and see room to the 140.80/140.25, January YTD and December lows.
Data and events for the week ahead
USA
The key release from the US is August’s CPI on Wednesday, where we expect 0.2% increases both overall and ex food and energy. These will be acceptably subdued to the Fed, though we expect the core rate to be marginally above 0.2% before rounding, and that would be a little firmer than the three preceding outcomes. August PPI is due on Thursday, and we expect a 0.1% rise overall, and a 0.2% increase ex food and energy.
Monday sees July wholesale trade and consumer credit data, and Tuesday August’s NFIB survey of small business optimism. Tuesday’s debate between Kamala Harris and Donald Trump will be closely watched, given the closeness of the race. Weekly initial claims and August’s budget data are due on Thursday. Friday sees August import prices and the preliminary September Michigan CSI. Fed speakers are likely to be quiet ahead of the September 18 rates decision.
CANADA
Canada releases July building permits on Thursday. Friday sees Q2 capacity utilization and July wholesale sales, for which the preliminary estimate was for a 1.1% decline.
UK
Major data awaits with the July GDP data (Wed). We see a 0.2% m/m rise, albeit with the data still showing volatility. Indeed, GDP growth has been positive in only one of the three months of the last quarter, having been flat in June. The day before sees key labor market data which may show a rise in the jobless rate and higher inactivity, but there will be as much weight on HMRC numbers regarding job dynamics which have suggested clearer slowing in private sector employment, if not an actual contraction, thereby painting a conflicting picture to that of the GDP numbers. However, the average earnings figures will be the most closely watched. We see a further discernible slowing in both regular pay growth (3 mth mov avg) down to 5% and the headline rate down to around 4% on base effects.
Otherwise RICS survey data (Thu) should offer more mixed signs of the housing market while the BoE compiled household survey (Fri) should show inflation expectation still being well anchored
Eurozone
Obviously, the main even is the ECB decision (Thu). That the ECB will cuts official rates again is now almost a given. Even the hawks on the Council are willing to concede that the discount rate can (and maybe even should) fall another 25 bp (to 3.5%). This will come alongside larger reductions to the two other policy rates thereby fulfilling a shift in the Eurosystem’s operational framework that was laid out six months ago. But markets will be more interested in what is said, aware too that the ECB is likely to adhere to its data dependent guidance, with nothing like any firm pointer to the speed and/or timing of further moves, albeit some more reassuring comments of wage and price pressures and a continued below target inflation outlook from late 2005 onwards.
Datawise, the main interest will be the EZ industrial production data (Fri) which are likely to show some further m/m slippage in July after a negative Q2.
Rest of Western Europe
There are key events in Sweden, with (expected again to be weak but still slightly positive) monthly GDP indicator data (Tue). More notable is that Thursday sees important CPI data, made all the more interesting by the still below-target 1.7% outcome in July for CPI-ATE. We see no change in this August update. In Norway, August CPI is due on Tuesday, followed by the Q3 report from Norges Bank's regional network on Thursday. Regarding the targeted core inflation rate (CPI-ATE), mainly due to temporary factors it may fall again and at just above 3.0% y/y would be well below Norges Bank thinking.
JP
Kickstarting the Japan calendar with Q2 GDP. Japanese economy has been improving since the rolling out of negotiated wage increase. It is likely we will see another growth for Q2 GDP, yet the magnitude maybe limited for it takes time for wage to translated into consumption willingness. We also have trade balance on the same day.
AU
Consumer confidence and business confidence are on Tuesday, followed by Consumer inflation expectation on Thursday.
NZ
Only Business PMI on Friday worth an eye.
Recap for the week
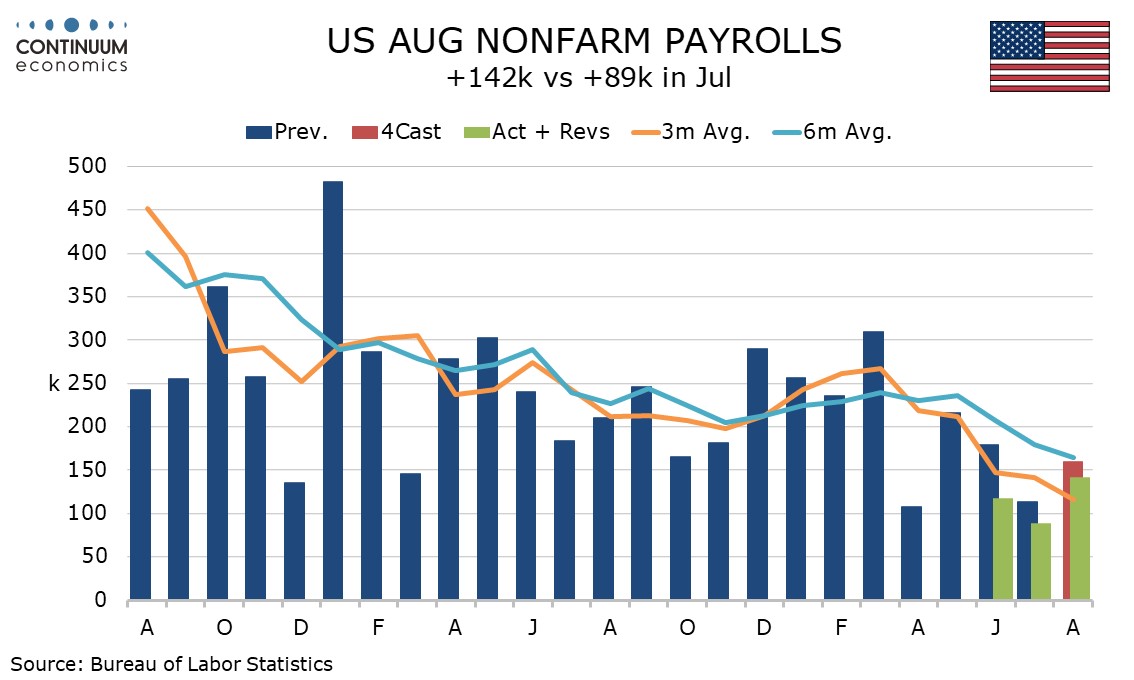
August’s non-farm payroll is a little weaker than expected with a 142k rise overall, 118k in the private sector, with significant negative back month revisions in the preceding two months totaling 86k. However the data is stronger than July’s, not only in the payroll, but also a correction lower in unemployment to 4.2% from 4.3%, a reversal of July’s dip in the workweek and an above trend 0.4% rise in average hourly earnings to follow July’s below trend 0.2%. This suggests a 25bps FOMC easing in September rather than 50bps.
Initial claims data to the August survey week shows the 4-week average almost unchanged from July’s survey week, suggesting the labor market has not weakened further in August. Recent JOLTS job openings for July and ADP private sector employment data for August were weaker than expected, but neither in our view represented a sharp deviation from a gradually slowing trend.
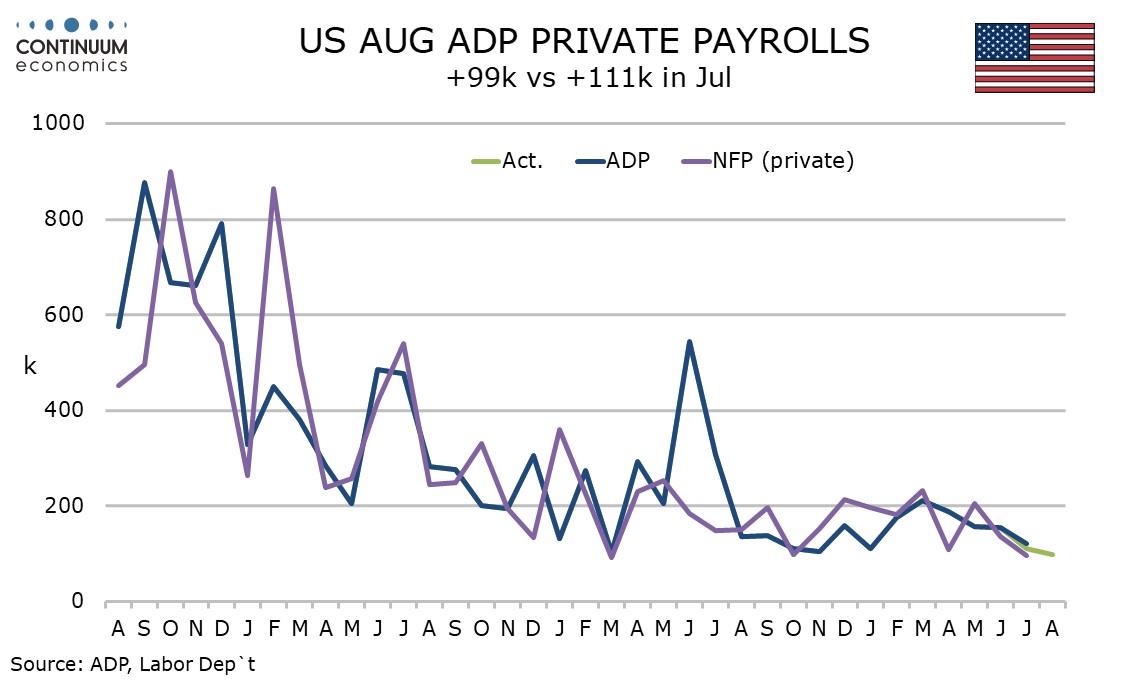
ADP’s August estimate for private sector employment growth of 99k is below expectations and consistent with a continued slowing of the labor market, with the gain being the slowest since January 2021. While the data suggests some downside risk to non-farm payrolls, our private sector payrolls call of 135k would to be a dramatic outperformance of the ADP data. We expect overall payrolls to rise by 160k. Initial claims at 227k from 232k still suggest quite a strong labor market. August’s ADP data shows education and health up by only 29k. This sector has been leading recent non-farm payroll gains and while some slowing is possible it is still likely to outperform the ADP data. The ADP data also showed leisure and hospitality, a sector which until quite recently was leading ADP gains, with a second straight subdued month, up by 11k.
One sector to look quite strong in the ADP report is construction, up by 27k. Declines were seen in manufacturing by 8k and business and professional by 16k. ADP data signaled some stabilization in wage growth with yr/yr gains of 4.8% for job stayers and 7.3% for job changers both unchanged from July, a pause in what had been a steady slowing in trend.
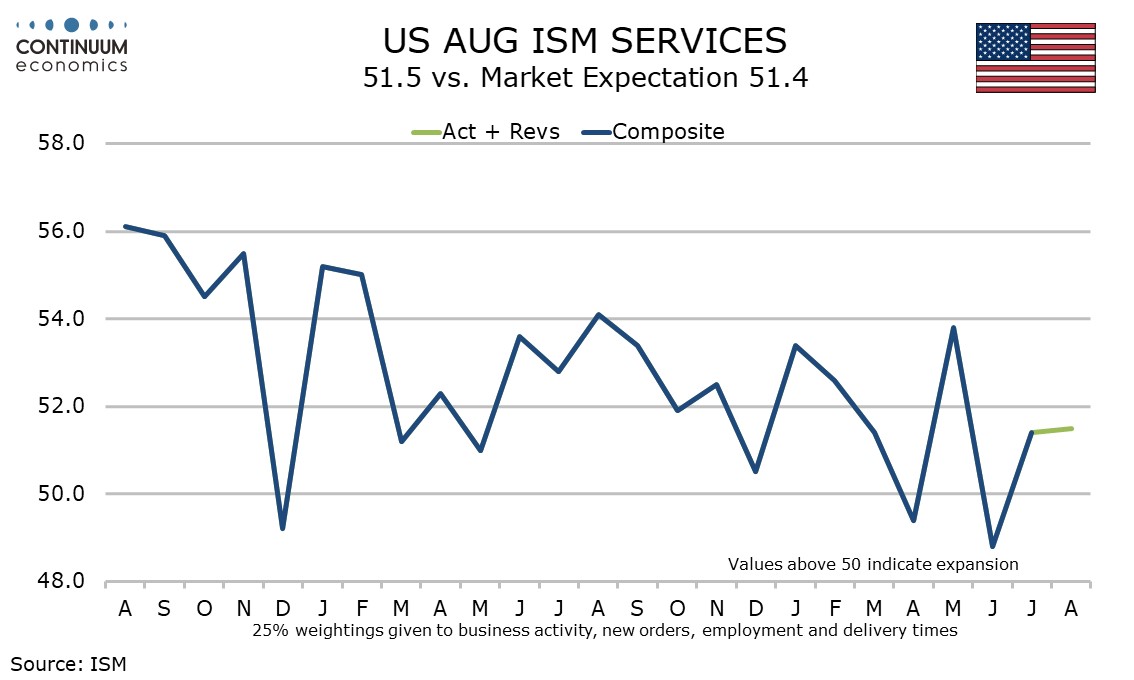
August’s ISM services index at 51.5 is almost unchanged from July’s 51.4 and implies an economy continuing to expand at a modest pace. Employment at 50.2 is down from July’s 51.1, but in being above the neutral 50 remains stronger than the readings seen from February through June. The composite is less positive than the S and P services index of 55.7, with the correlation between the two series poor and the S and P data seemingly more sensitive to interest rate expectations.
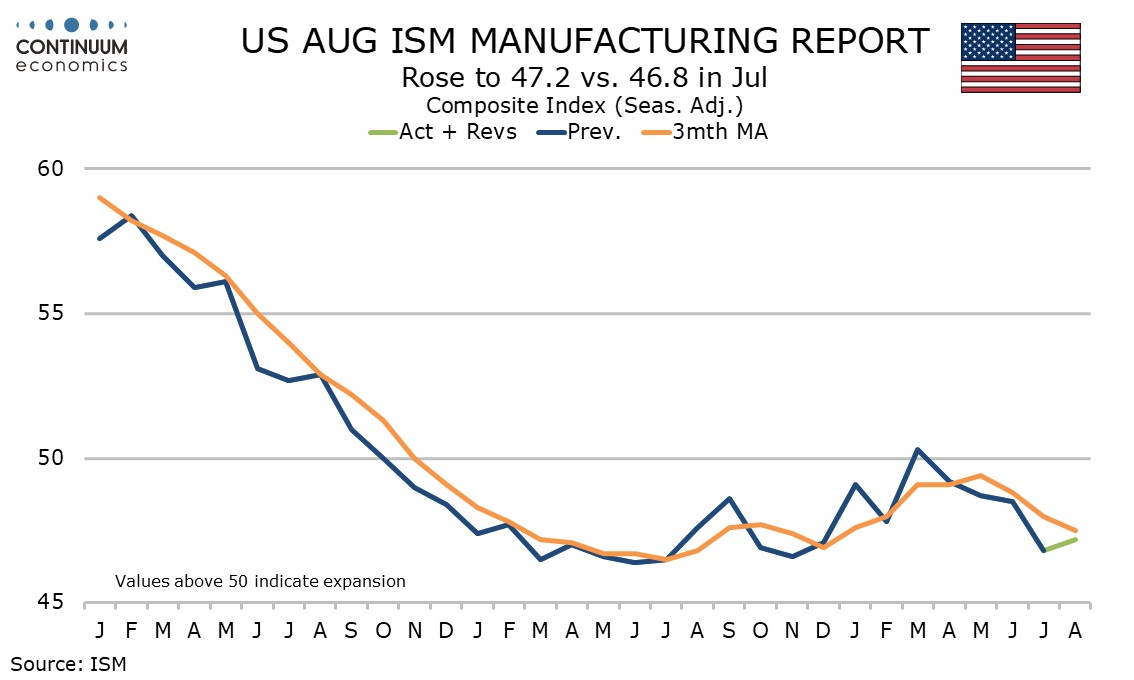
August’s ISM manufacturing index at 47.2 is up from July’s 46.8 but still quite weak, with the first two months of Q3 weaker than each of the six months in the first half of the year. New orders at 44.6 from 47.4 are the weakest since May 2023. Production also weakened to 44.8 from 45.9, this the lowest since May 2020 at the height of the pandemic. The gain in the composite was led by inventories, which saw a sharp rise to 50.3 from 44.5.
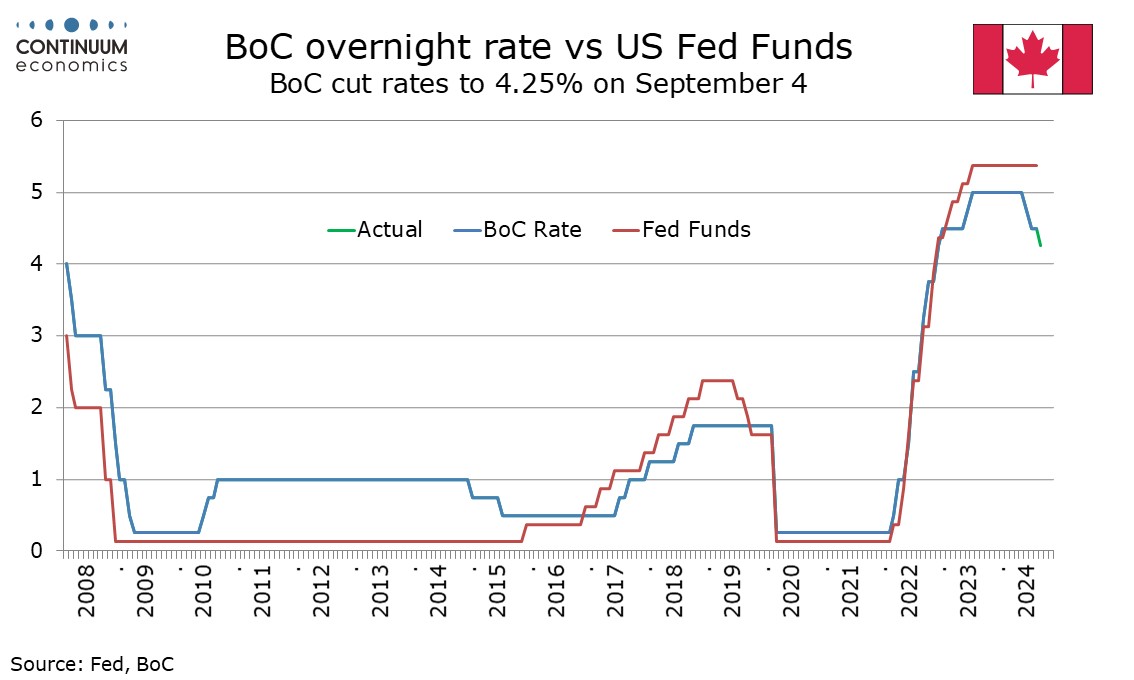
The Bank of Canada eased rates by 25bps for a third straight meeting as expected, taking the rate to 4.25%. The tone of the statement and press conference was dovish, expressing concern that growth may fall short of their expectations while seeing some progress in still resilient shelter inflation. This suggests that the pace of easing could be accelerated by early 2025. The statement saw global growth as in line with projections in July’s Monetary Policy report, and 2.1% annualized Canadian GDP growth in Q2 was above forecast. However the statement also noted soft activity in June and July and continued slowing in the labor market. Inflation slowing to 2.5% in July was seen as expected. While the statement stated the BoC continues to weigh the opposing forces of excess supply reducing inflation and price increases in shelter and other services holding inflation up, the tone of Governor Tiff Macklem’s opening press statement was dovish. He saw the sources of upside pressure from shelter and some other services as having eased slightly but the downward pressure from excess supply remaining. He also noted that July’s economic projection had growth strengthening further in the second half of the year but recent indicators suggested some downside risk to this. He stated the share of CPI components growing above 3% was now around the historical norm but shelter inflation was still too high, despite early signs of easing.
In responding to questions Macklem stated there was a strong consensus for a 25bps cut and that a slower and faster pace of easing were both considered. He added that the BoC was prepared to take a bigger step if needed. If GDP growth does not improve as expected, leaving the upward trend in unemployment, now at 6.4% after starting 2023 at 5.0%, intact, and inflation gets close to target, the BoC may consider accelerating the pace of easing. The neutral range is currently estimated as 2.25-3.25% and the BoC may want to move more rapidly to neutral, or even a little below. We continue to expect 25bps moves in the remaining two meetings this year, on October 23 and December 11. Risk is however for more, increasingly so for December, if, as we expect, GDP does not gain momentum.
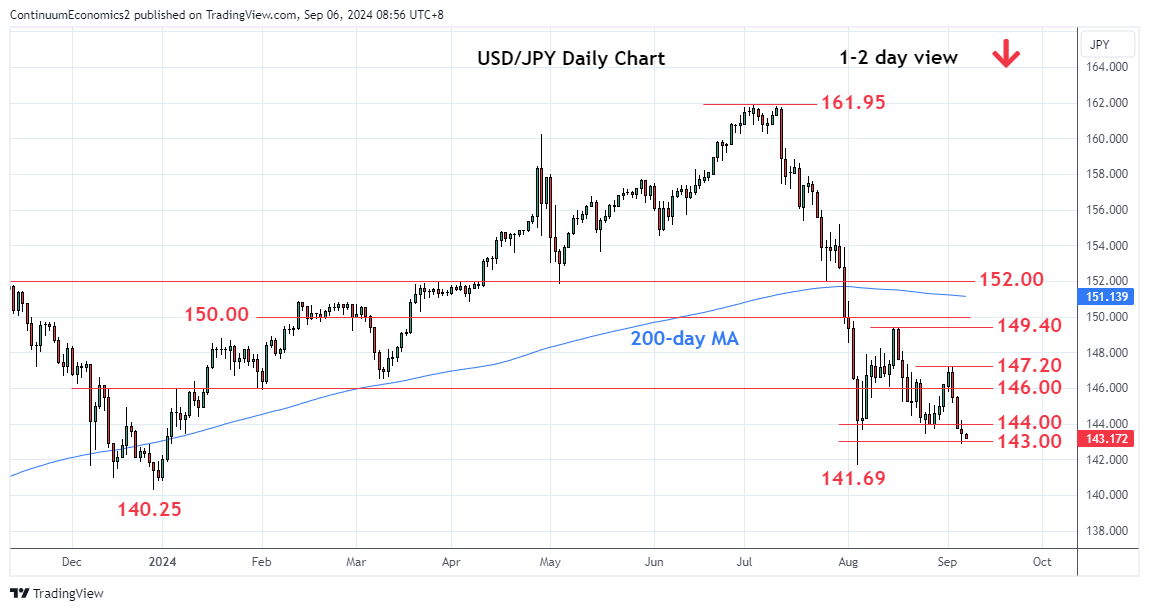
USD/JPY is beginning is breakout of consolidation, currently waiting for the U.S. NFP release to trigger another move. U.S. Treasury Yields continue to slide while JGB yields are relatively steady. The market is waiting for the Fed to cut and is anticipating the BoJ to hike at least once this year, which will further narrow the yield differential and decrease the attractiveness of carry trade. That may deteriorate when market participants feel like the downside potential out-scale the potential yield. The major correction have begun and we may see another wave of it in the coming weeks.
On the chart, USD/JPY is consolidating at the 143.00 level as prices unwind the oversold intraday studies but pressure remains firmly on the downside. Break will will see room to extend losses to retest the 142.00 level and the 141.69, August low. Would expect reaction here but corrective bounce see resistance now at the 145.00/145.20 congestion area which is expected to cap and sustain losses from the 147.20, lower high. Below the 141.69 low will extend losses from the July YTD high at 161.95 and see room to the 140.80/140.25, January YTD and December lows.