Eurozone GDP Review: GDP – Divergent Weakness?

According to official national accounts data, the EZ economy has avoided recession, at least formally albeit against a backdrop of marked, if not increasing national divergence. Overall the flat q/q EZ GDP 4 reading was a notch below ECB thinking but a notch above consensus but this reflected marked divergences among the EZ economies, most notably among the ‘Big 4’. Spanish GDP growth picked up to 0.6% q/q continuing a very solid and relatively balanced path seen of late. In contrast, the German economy sank 0.3%, while in France GDP slipped marginally for a second successive quarter, thereby implying formal recession in the EZ two largest economies. While possibly providing the Council with a little less urgency, this activity backdrop (where the economy has risen a bare 0.1% in the last year) will have little to impact on ECB thinking, not least as it probably masks a much weaker domestic demand picture (French domestic demand sank by over 1% q/q in Q4) while German activity was hampered by declines in business and construction investment. Regardless there are some better (at least less adverse) real economy signs, albeit still implying contracting activity, the question being the extent to which ECB tightening has yet to deliver anything like its full impact on demand.
Such a backdrop will do little to reassure some Council members who have been very wary that the ECB’s recently downgraded growth forecast were still too optimistic, albeit where the 2023 outcome was a still a notch below the formal forecast. Notably, however, weakness is still being flagged by survey data such as the PMIs albeit slightly less acutely at least for manufacturing. But it is of clear importance that they are suggesting that contracting activity may even be extending into the current quarter, especially if the weak construction, retail and government sector readings are taken into account. In this regard the broader based European Commission survey data released alongside the GDP figures may be telling as it slipped afresh and remains very much in contraction territory see below|).
Figure 1: Q4 EZ GDP Picture
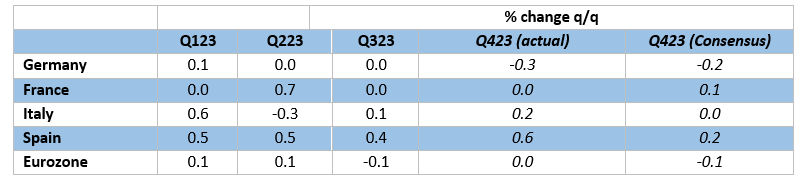
Source: Eurostat, Continuum Economics, Bloomberg
Thus we remain of the view that the ECB is still too optimistic, not least as nowhere near the full extent of its policy tightening ha filtered through yet, this formal hiking being accentuated both by the ECB balance sheet shrinkage and by credit standards being raised by the banking sector. Indeed, in the December Council meeting account, it was argued that the transmission of monetary policy tightening, via prices (loan rates) and quantities (credit volumes) since the first rate hike in July 2022, was both much stronger and faster than expected, and much stronger and faster than suggested by macroeconomic models. It seems the transmission mechanism may now be biting even harder. As a result, we see GDP growth this year of no more than 0.4%, half that of the ECB.
Policy Tightening Biting Further
This is a little below-consensus thinking too, the latter having fallen to converge more with our more long-standing wariness. As for details, this involves continued weakness in domestic demand, something that has been masked somewhat by relative resilience in headline GDP data where the y/y rate up to Q3 2023 was nothing worse than zero. This seemingly remained the case in Q4, largely due to continued marked declines in imports in France, Italy and Germany and where on an EZ basis imports have contributed exactly two whole ppt to growth in the year to Q3
Surveys Still Weak
As we have repeated before, we remain a little wary of the PMI data, at least in terms of offering insights in real activity, as the numbers cover only part of the EZ in either geographical or sector terms – the currently much softer construction PMI is not included in the composite measure. Notably, alternative and more broadly-based business survey data from the European Commission have painted a less upbeat picture (Figure 2). Regardless, all such business surveys suggest that overall EZ activity may now be contracting, led by a very marked slump in manufacturing. Also of note the EZ national account data has masked clear divergences among member economies with Germany faring poorly while Spain has seen clear par-type growth.
Figure 2: Business Surveys Still Suggest Continued Downside EZ Growth Risks?
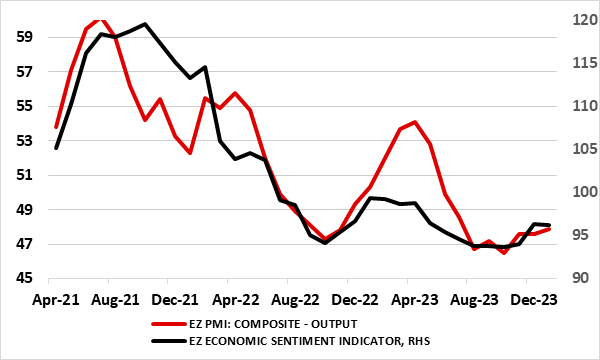
Source: Markit, European Commission
Flash GDP in Perspective
Otherwise, and as we have underlined before, it is important to recognize that there are clear shortcomings to the flash estimate for GDP. No details comes with these flashes and they are prone to clear revisions. Indeed, the original Q3 and Q1 GDP numbers gave a clearly misleading impression, in that they implied initially modest growth in both quarters. Then Q2 GDP was initially recorded at 0.3%, only to be revised back as well, the same fate besetting the Q3 numbers too. Time will tell whether the Q4 flash numbers will tell any more authoritative a story! Regardless, the apparent resilience in overall GDP makes the sharp and broad fall in inflation all the more likely to have been driven more by supply factors than demand. But with demand likely to buckle or at least be constrained by policy tightening the disinflation process may have much further to run.