This week's five highlights
U.S. June CPI Very soft
USD/JPY Swings
More Upside Surprises on UK GDP
RBNZ Signals easing soon
Weak CPI and M2 Trends in China
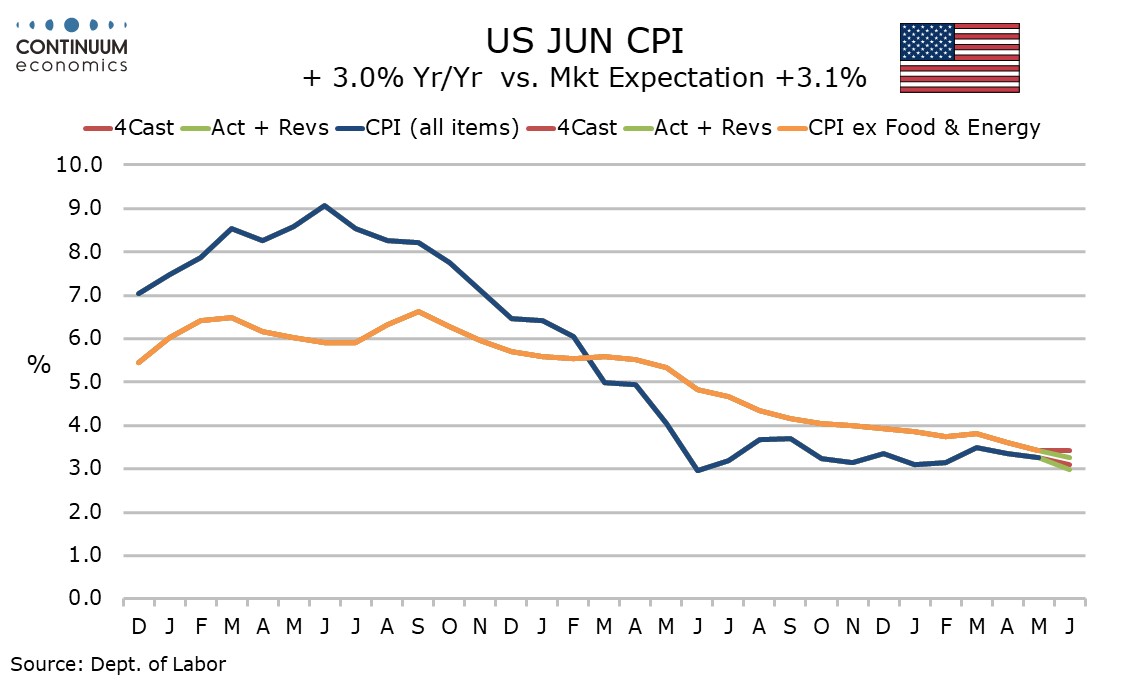
June CPI is even weaker than expected, down by 0.1% overall and up by only 0.1% ex food and energy, with the core increase before rounding only 0.065%, a sign that inflationary pressures have faded significantly since the bounce at the start of the year. Initial claims at 222k from 239k suggest the labor market remains strong, but the 4 July holiday may have flattered the data. Core CPI was quite strong at the start of 2023 before fading later in the year, so there may be some residual seasonality not fully compensated for by seasonal adjustments. June was the softest month of 2023 for core CPI, though its gain of 0.195% was significantly stronger than the latest month which is the slowest since January 2021.
Yr/yr core CPI slowed to 3.3% from 3.4%, to its slowest since March 2021 while overall CPI fell to 3.0% from 3.3%. Energy saw a second straight decline of 2.0% led by gasoline while food saw a modest rise of 0.2%. Commodities ex food and energy maintained recent trend with a fall of 0.1%, with used autos patricianly soft at -1.5%. Services less energy, which were strong in the first four months of the year, followed May’s slower 0.2% gain with even slower rise of 0.1%. Transportation services saw a second straight 0.5% decline in a continued reversal of early year strength led by a 5.0% fall in air fares that looks like feed through from lower energy prices. Shelter rose by only 0.2% with a 2.5% fall in lodging away from home looking a little erratic, though owners’ equivalent rent slowed to 0.3% after four straight months of 0.4% and the heavy weight of this components makes the slowing significant. While there seem to be a few components that are erratically weak, the data is soft enough to suggest an underlying picture consistent with on target inflation, though the Fed will want to see more soft data before easing. Still, even data slightly less soft than this month would be satisfactory for the Fed.
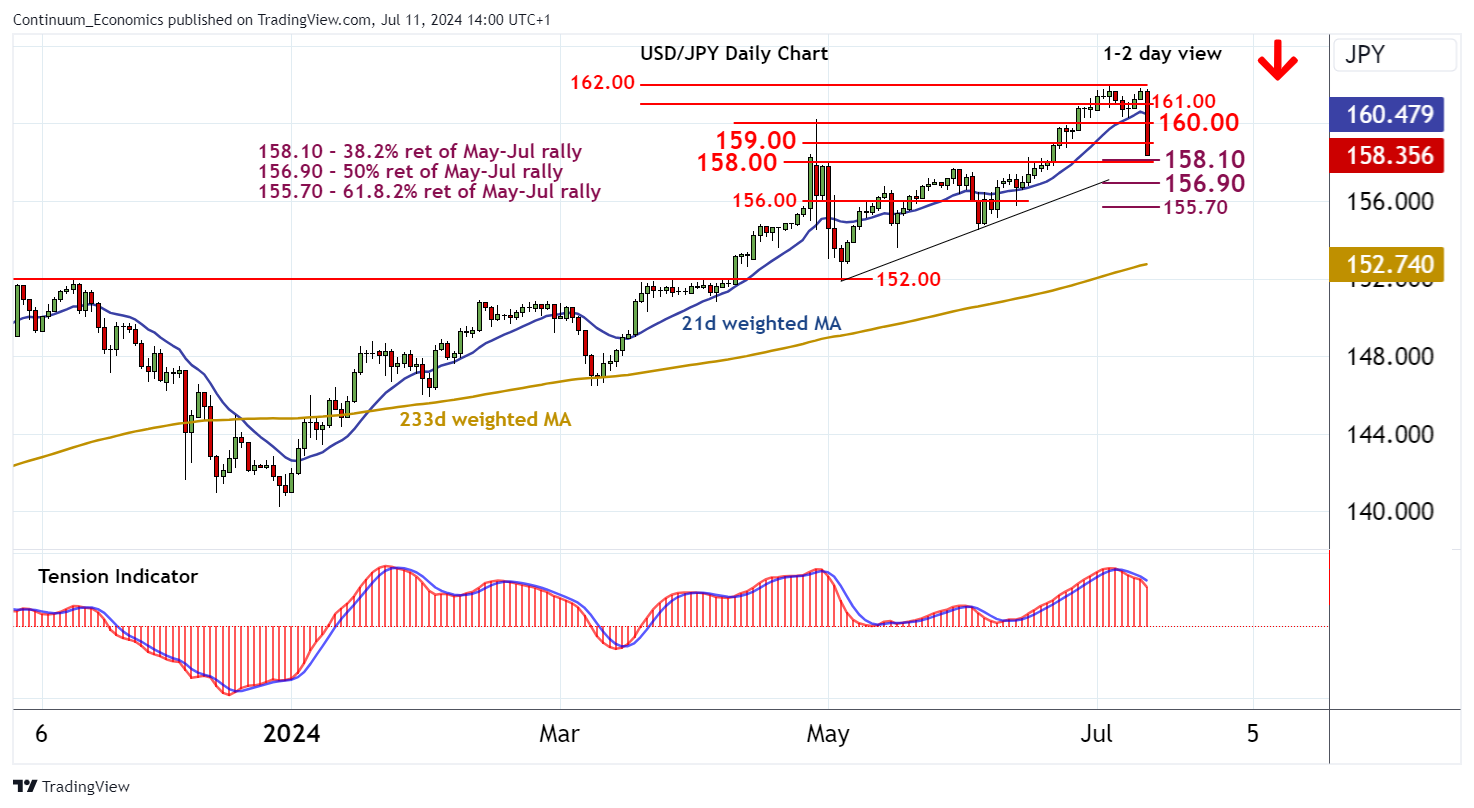
The lower than expected U.S. CPI has triggered a major pullback in USD/JPY, which seems to be exacerbated by BoJ's intervention that was denied by Japan's Kanda. The move did not end as the BoJ rate checked and lead to another round of panic selling for it usually indicates imminent intervention. The "rate check" led to another two figure drop but was quickly reversed. As Kanda is stepping down the end of month, there seems to be a change of intervention method. The BoJ tried to lean on downward wave and target thin liquidity hours to do their jump scare. USD/JPY may have a cap for now circa the 159-161 area.
On the chart, the cautious trade has given way to a sharp pullback in both USD- and JPY-driven trade, with prices currently consolidating around congestion support at 159.00. Intraday studies are negative and daily readings are also under pressure, highlighting room for further losses in the coming sessions. Support is at congestion around 158.00 and the 158.10 Fibonacci retracement, but risk is for a further break towards the 156.90 retracement. Meanwhile, resistance is lowered to congestion around 160.00 and should cap any immediate tests higher.
Figure: Clearer Recovery But Contrast with Survey Volatility?
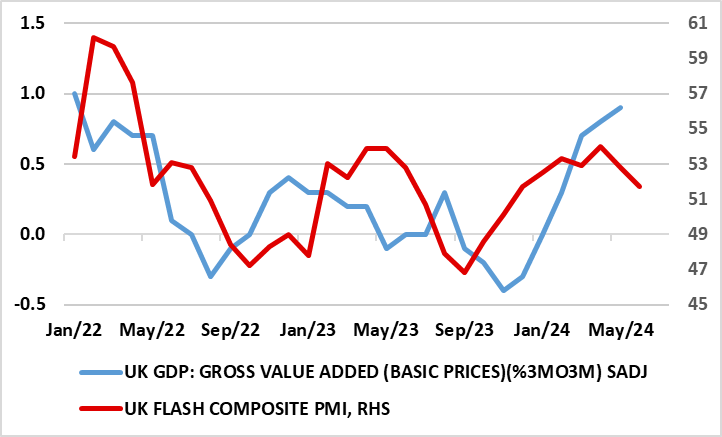
After the mild recession in H2 last year, the ‘recovery’ now evident is much clearer than any expected with GDP growth notably positive, and with less apparent volatility. Indeed, coming in more than expected, GDP rose by 0.4% m/m in May accentuating the bounce in the two months prior to the flat April reading. As a result, this would be consistent with a circa-0.6% Q2 q/q outcome, building and almost matching the strong but possibly misleading Q1 jump. It would also be above BoE thinking for the last quarter and would suggest growth of around 1% for the whole year, double the previous estimate. But the apparent resilience, if not strength, in the GDP data contrasts increasingly with employment weakness and is partly a result of public sector gains, but also does not appear to be a result of import weakness as was the case in Q1. But the strength in GDP also contrasts with survey data (Figure 1).
Volatile weather appears to have affected activity in recent months. Rainfall in April was well above average while May was the warmest on record since records began in 1884, according to the Met Office. This may explain the apparent marked bounce in construction, albeit against a backdrop in May which saw broad-based increases in activity
As for the last set of monthly GDP numbers, real gross domestic product (GDP) is estimated to have grown by 0.9% in the three months to May. This is the strongest three-monthly growth since January 2022. Services output was the main contributor, with a growth of 1.1% in this period, while production output showed no growth and construction fell by 0.7%. Overall we are sceptical about the GDP strength, even though it does not appear to be the result of import weakness as was the case in Q1 and before. The GDP data conflicts with both survey data (Figure 1) and with employment Regardless, it now looks as if GDP growth may be around 1% this year, double the estimate previously and more in line with what we thought may occur for 2025. We do not think the data will have much impact in reshaping BoE thinking, although solid GDP growth may accentuate worries about possible price persistent among the MPC hawks, especially as the relative strength in services output chimes with resilient services inflation.
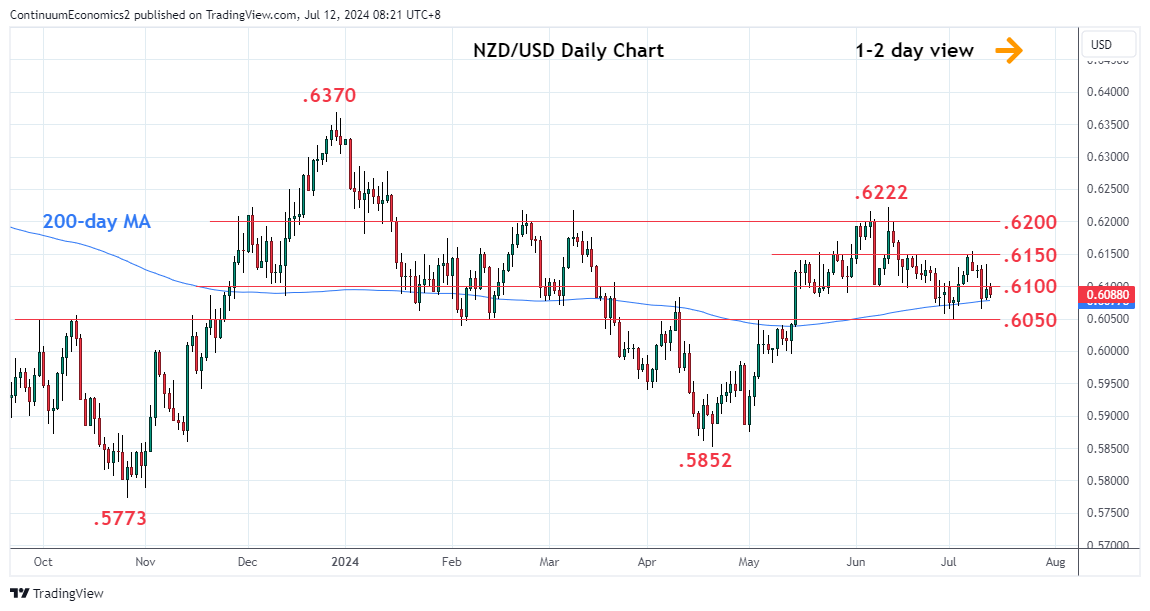
There is no change to OCR in the RBNZ July meeting.
Some key takeaways:
Change of stance: "Restrictive monetary policy has significantly reduced consumer price inflation, with the Committee expecting headline inflation to return to within the 1 to 3 percent target range in the second half of this year." The RBNZ openly stated inflation is approaching target range in their title, which is a turn around from May's statement when they suggest rate would be higher for longer. It seems to suggest the Q2 CPI would likely tread lower.
Inflation Approaching Target: "Some domestically generated price pressures remain strong. But there are signs inflation persistence will ease in line with the fall in capacity pressures and business pricing intentions.". RBNZ should be referring to service inflation that was moderating slower than expected and suggest such moderation will align with inflation forecast.
Forward Guidance Change: The forward guidance is changed to "The Committee agreed that monetary policy will need to remain restrictive. The extent of this restraint will be tempered over time consistent with the expected decline in inflation pressures." from "The Committee agreed that monetary policy needs to remain restrictive to ensure inflation returns to target within a reasonable timeframe." The RBNZ is signalling current inflationary dynamics are following their playbook and they are ready to ease when CPI reaches target range.
The July meeting is a turn around from the May one. In May, RBNZ is suggest higher rates would be here for longer but now they are saying inflation is approaching target range. While they have not release their inflation forecast, the turn around seems to be driven by the moderation in service inflation, which has been a thorn by their side as it remain stubbornly high. We will have to wait for the next meeting in August or Q2 CPI to confirm. We do not see CPI to go below 3% in Q2 and thus we will likely only see a rate cut in Q4 2024.
Figure: China CPI and PPI (Yr/Yr %)
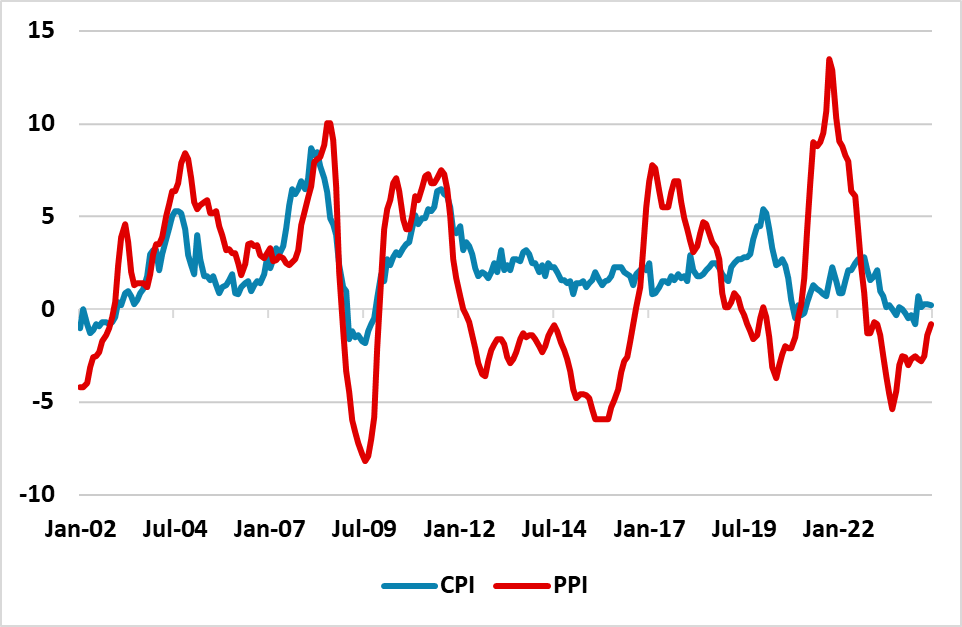
China disinflation process is clear in the June CPI data, with excess production and soft consumer spending producing a lower than expected outcome. Combined with weak M2 money growth, parts of China economy remain weak and point to a softening of GDP growth in H2. However, policy action will likely remain targeted.
China June CPI data came in weaker than expected at +0.2% Yr/Yr versus +0.4% expected. The breakdown of the data points to ongoing disinflationary pressures, with headline down 0.2% on the month and a monthly fall in core inflation – Yr/Yr core remains at +0.6%. The 618 shopping festival saw downward price pressures, with weakness in consumer goods and cars falling -5.3% Yr/Yr. This all reflects excess domestic production chasing weak consumer demand and the end result being persistent disinflationary pressures. Though PPI is less negative Yr/Yr, this process will likely remain in place in the remainder of 2024. Consumer demand is softer, as the post COVID pent up demand in catering is losing momentum. Meanwhile, sour sentiment towards housing, plus slow private sector hiring, is denting consumer spending in household goods/furniture/cars.
Additionally, weak demand for loans from households is also a drag for consumption and is one of the forces behind the ongoing slowing in M2 growth, which at 6.8% is now very low by China’s standards.