This week's five highlights
The Bank of Canada accelerated the pace of easing
U.S. Initial Claims back to pre-hurricane trend
And other U.S. Data
USD/JPY Challenge Monthly High
Eurozone Services Risks Clearer
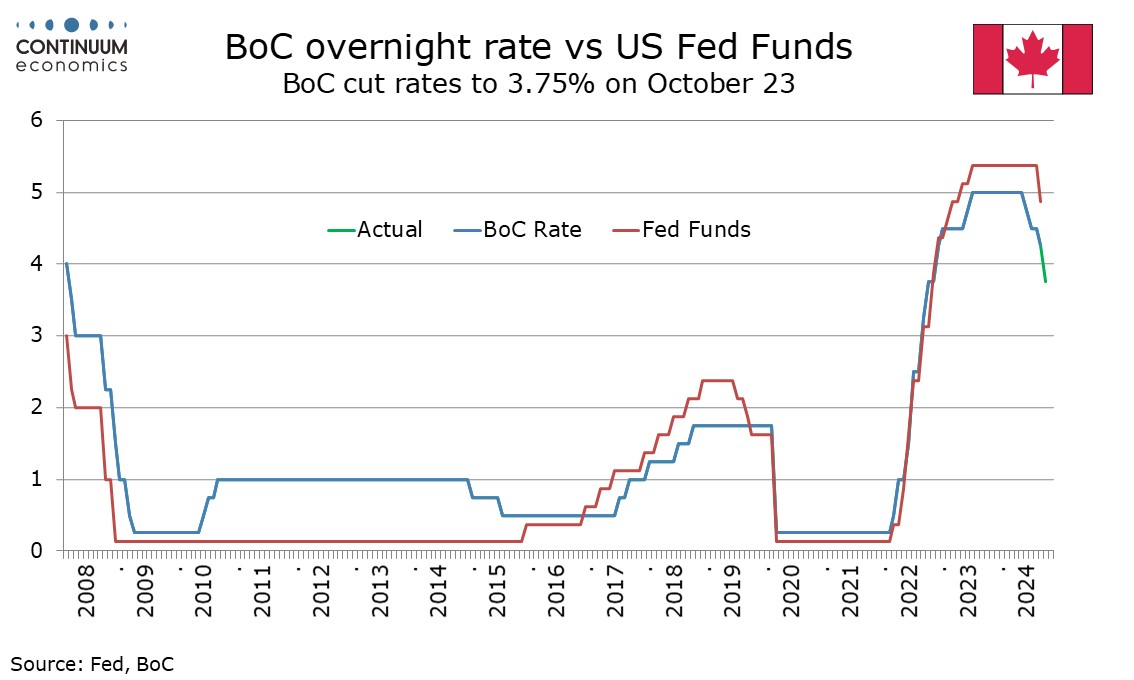
The Bank of Canada has accelerated the pace of easing, cutting by 50bps to 3.75% after three straight meetings when policy was eased by 25bps. The accelerated pace of easing was largely as expected and follows headline inflation data moving back to target. The BoC wants to lift the pace of GDP growth and is likely to do so, and how quickly growth picks up is likely to determine whether further 50bps moves will be seen. We now expect a 50bps move in December, before three 25bps moves in 2025.
While there are tentative signs that the economy is starting to regain momentum, we are not convinced enough will be seen by December to prevent a further 50bps easing, which would take the rate to 3.25%. That would put the rate at the upper end of the 2.25%-3.25% range the BoC sees as neutral, and after that easing is likely to be more cautious unless inflation falls below target or growth fails to respond to easing. While some improvement in the economy is likely, risk for 2025 is for data to underperform the BoC’s expectations. We expect two 25bps easings in Q1 of 2025, and one more in Q2 taking the rate slightly below the midpoint of the neutral range at 2.5%. 2026 may see rates nudged back up to neutral.
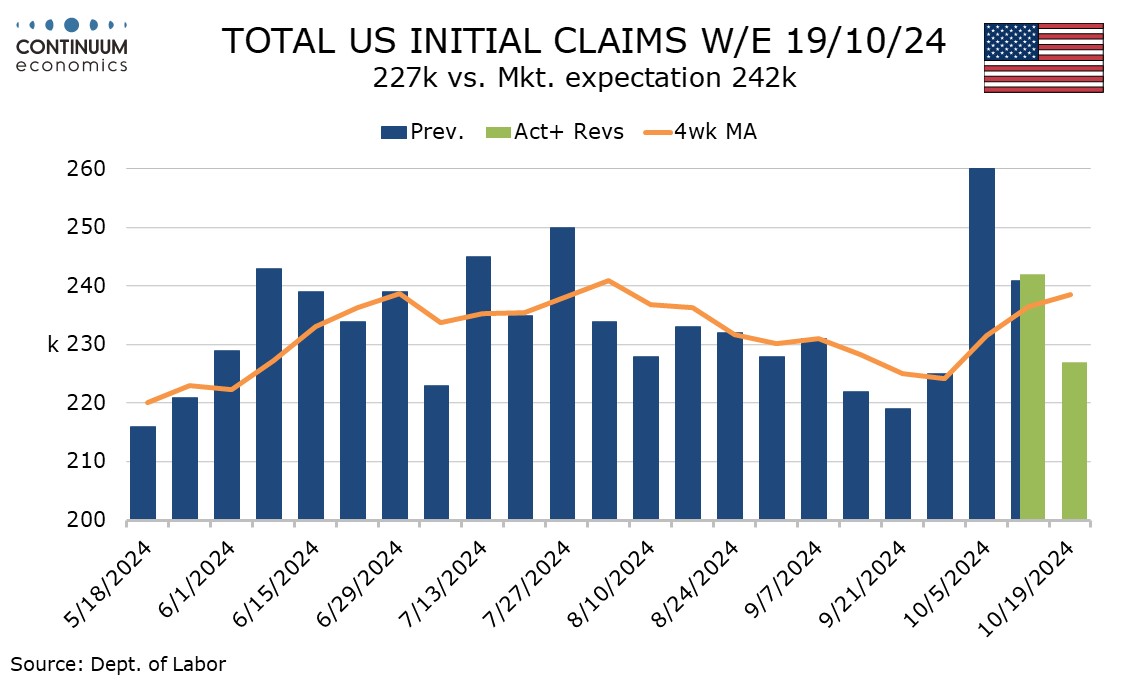
Initial claims at 227k from 242k are lower than expected after two straight above trend weeks, which were attributed to hurricanes, last week to Milton and the 260k two weeks ago to Helene. The data appears to suggest a still healthy labor market now the hurricanes have passed.
The latest weekly level of 227k is in line with the pre-hurricane 4-week average. The boost after Hurricane Helene came a week after the hurricane hit but the boost from Milton, which turned out to be less than that of Helene, came as the hurricane hit, with the aftermath turning out to be less severe than feared.
The survey week for October’s non-farm payroll came last week, suggesting risk of a significant negative impact given the two hurricanes, which both came after September’s strong non-farm payroll was surveyed. Our forecast is for a rise of only 75k. However, the latest initial claims data suggests that any weakness in October’s non-farm payroll will be temporary.
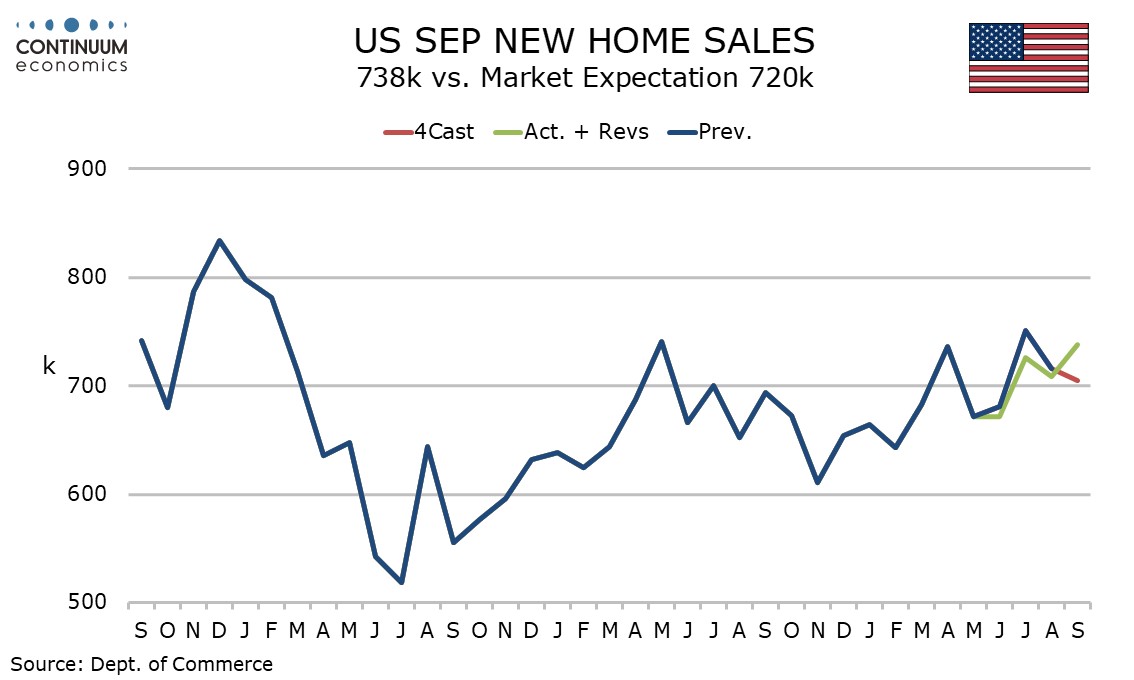
September new home sales with a 4.1% rise to 738k are on the firm side of expectations. The series, while volatile, has been trending higher since falling to a 12-month low of 611k in November 2023. The improving new home sales trend contrasts weakness in existing home sales, which in September fell to their lowest level since October 2010. This suggests improving supply is offsetting weakness in demand in the new home sales picture. September sales saw the strongest rise in the Northeast, followed by the South, despite Hurricane Helene arriving late in the month. Sales were flat in the Midwest and fell in the Midwest.
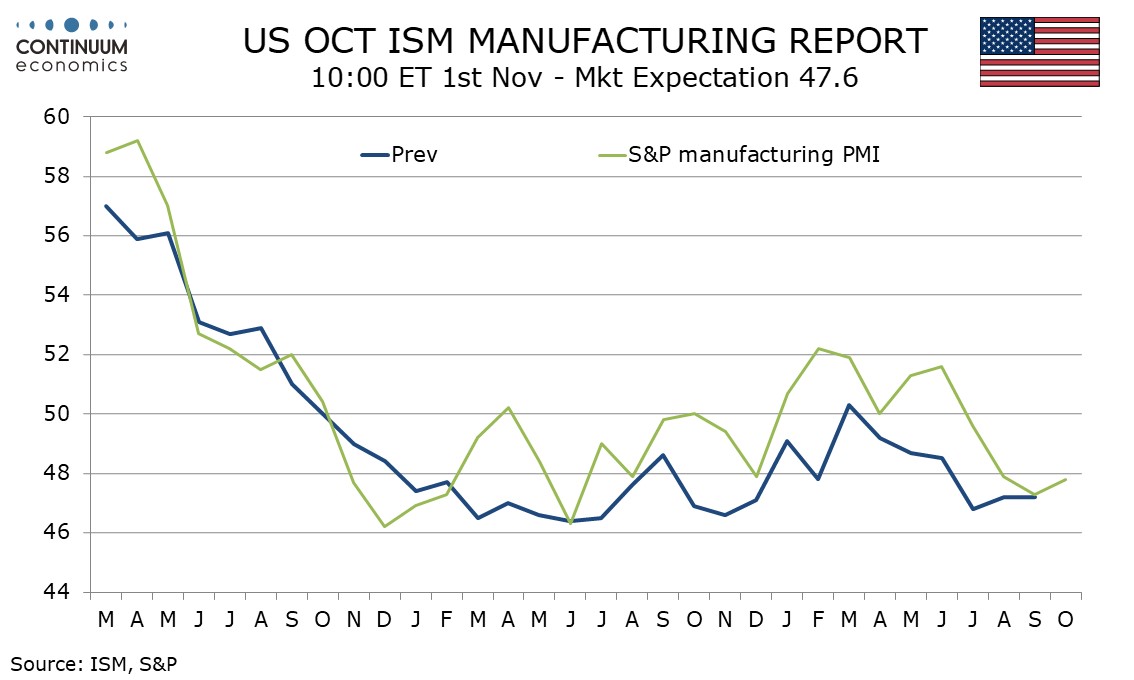
October’s preliminary S and P PMIs are marginally improved, with manufacturing still weak at 47.8 from 47.3 and services still healthy at 55.3 from 55.2. The manufacturing index marks the first improvement since June reached 51.6. The recent slippage in the S and P manufacturing index moved it back into line with the ISM’s. Regional surveys to date for October show a stronger Philly Fed, a weaker Empire State index and a less negative Richmond Fed. On balance the evidence appears to be for a slightly less weak ISM manufacturing index.
The S and P services index is not well correlated with the ISM counterpart, and has now seen a sixth straight quite firm reading near 55.0. October saw the ISM services index consistent with the S and P’s but in most recent months it has been weaker. Regional services surveys also show stronger data from the Philly and Richmond Feds, but weaker data from the Empire State. The ISM services survey may struggle to fully sustain its October bounce.
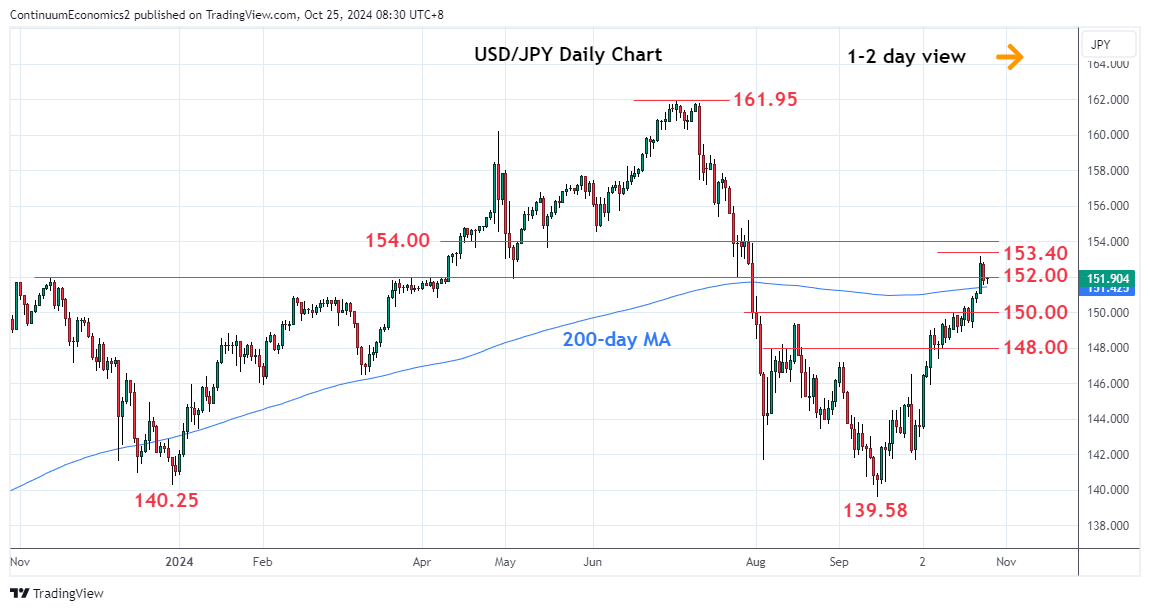
USD/JPY has jumped past 150 as the lack of strength in verbal intervention from the Japan side and little expectation from next week's BoJ meeting, failed to deter USD strength driven by higher yield. The choppy yet somewhat positive risk sentiment also sees market participants favor the USD over the JPY. However, such move is destined to be shortlived for yield differential has a high chance to be further reduced. We believe the market is under pricing the chance of BoJ to hike by year end 2024, which may spark a correction in the pair soon.
On the chart, the pair settled back from the 153.19 mid-week high as prices consolidate bullish break of the 150.00 level earlier in the week. Consolidation see prices unwinding the overbought intraday and daily studies and below the 152.00 level see room for deeper pullback to the 151.00 congestion. Would take break of the latter to fade the upside pressure and open up room for deeper correction to the 150.00 level and 149.40 support. Meanwhile, break above the 153.19/40 resistance will see further extension of gains from the September low and see scope to the 154.00 congestion.
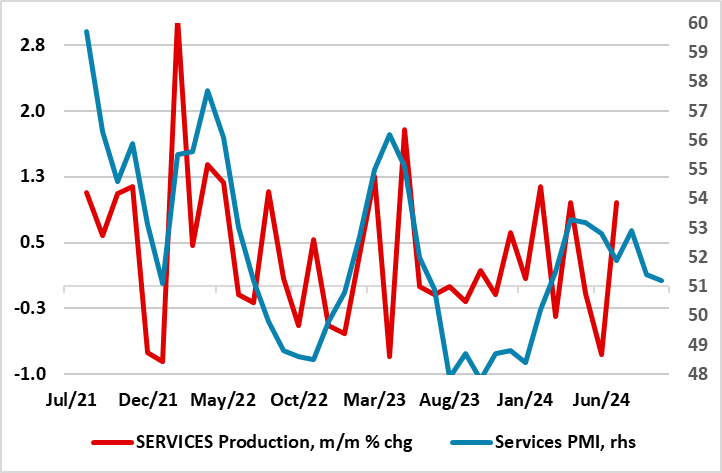
Figure: Services Sector Growth Slowing Clearly
It is clear that PMI data are a key component of the data analysis of the ECB. We are somewhat sceptical of the data, at least in its ability to track GDP growth coincidently and accurately. But the data does offer a wide-ranging insight into private sector economic momentum. With this in mind the October PMI data will be reverberating within the confines of the ECB Council even though it is clear (and justified) that policy will be shaped by an array of data rather than any particular data points! The PMI data offer a several key messages, not least weak momentum, albeit where the continued marginal drop below the apparently key 50 reading is probably indicative of sluggish growth than recession. But the risks of the latter are growing and possibly materializing if the weakness in orders and now employment are anything to go by. However, what is clear at present is that a) services are weakening, possibly heralding the end of the only part of the economy that has been growing and b) partly as a consequence, price and costs pressures are receding clearly, thereby adding to the ever-clearer disinflation picture.
Flash PMI numbers for October showed that the composite measure edged up 0.1 point to 49.7, but staying below the apparently key 50 mark for a second successive month. This reflected output being scaled back in response to a weakening demand environment, with new orders down for the fifth consecutive month. This resulting lower workloads led firms to reduce employment by the largest degree in almost four years, while business confidence dropped to an 11-month low.
The marginal reduction in overall business activity masked a continued divergence between the manufacturing and services sectors, albeit by the smallest margin since February. Even so, manufacturing production fell markedly again while the service sector managed to continue expanding but at an eight-month low. However, the very unusual divergence seen between services and EZ manufacturing may be coming to an end – the factory sector has contracted for six and probably seven successive quarters while services have risen alongside. But services are slowing with official data for the sector having fallen for three out of the last five months of data and where business survey data (both the PMI and European Commission data suggest near-stagnation looms (Figure).
Notably, outside of Germany and France, the rest of the EZ actually saw output increase at the fastest pace in four months. This contrast reflects the varying size of the industrial sectors in these economies with those with the larger services sectors as % of GDP (eg Spain) prospering more than those more reliant on recession-bound manufacturing (eg Germany).